The Aquaculture Therapeutics Market is anticipated to be valued at USD 1.9 billion in 2025 and is expected to reach USD 3.8 billion by 2035, registering a CAGR of 7.2%.
| Metric | Value (USD Million) |
|---|---|
| Industry Size (2025E) | USD 1.9 billion |
| Industry Value (2035F) | USD 3.8 billion |
| CAGR (2025 to 2035) | 7.2% |
This market is experiencing significant growth, driven by the intensification of aquaculture practices and the rising incidence of infectious diseases among high-value aquatic species. Between 2020 and 2024, there was a notable increase in the adoption of preventive and curative interventions, including antibiotics, antiparasitics, and vaccines, across major aquaculture regions.
This trend is expected to continue, fueled by the increasing demand for sustainable seafood and innovations in fish health management. The market's future growth opportunities are underpinned by advancements in vaccine technology, the development of autogenous vaccines, and the integration of precision aquaculture practices. These factors collectively contribute to reducing mortality rates, mitigating the spread of pathogens, and minimizing environmental impacts, thereby ensuring healthy and sustainable seafood production.
Prominent players in the Aquaculture Therapeutics Market include ViAqua Therapeutics Ltd., Alpharma Inc., Blue Ridge Aquaculture, Cermaq ASA, Cooke Aquaculture, Nireus Aquaculture S.A., and Tassal Group Ltd. These companies are actively engaged in developing innovative solutions to enhance fish health and sustainability.
In Dec 2024, BioMar announced the launch of SmartCare Endurance, a new feed solution that aims to boost fish health and fish resilience. According to the company, the fish fed with the product showed faster recovery and lower mortality rates, ensuring robust growth and productivity during critical periods.
“SmartCare Endurance provides farmers with a powerful tool to support fish health during environmental challenging periods, this new product reflects our commitment to helping farmers overcome the challenges of modern aquaculture while prioritising fish welfare and performance.” explained Torunn Forberg, BioMar’s Product Marketing Manager SmartCare.

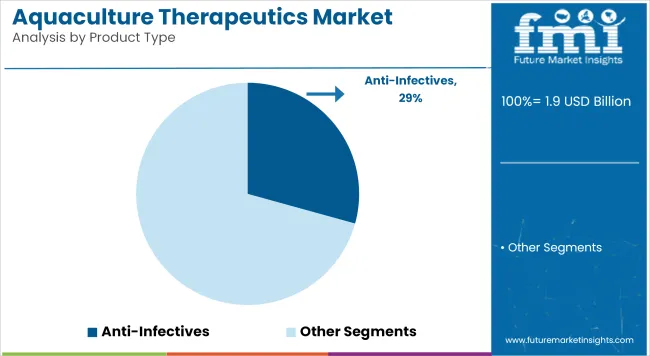
The Anti-Infectives segment, commanding a 29.3% revenue share in 2025, has emerged as the dominant product category within the aquaculture therapeutics market. This segment's growth has been driven primarily by the rising prevalence of bacterial infections such as furunculosis, vibriosis, and columnaris among intensively farmed aquatic species.
A significant reliance on curative treatment rather than prevention has been observed in key production regions like Southeast Asia and Latin America, where environmental fluctuations and overcrowding amplify disease vulnerability. Increased antibiotic consumption has been reported, particularly in shrimp and tilapia farming systems. Anti-infectives have been favored due to their rapid action, wide-spectrum coverage, and ease of administration via feed.
Despite growing regulatory scrutiny, anti-infectives continue to be prescribed extensively where biosecurity protocols are weak or vaccine coverage is limited. Additionally, limited cold-chain infrastructure in certain geographies has made vaccines less feasible, further sustaining demand for anti-infectives. As resistance issues become more pronounced, the adoption of next-generation antimicrobials and combination therapies is being explored to sustain efficacy.

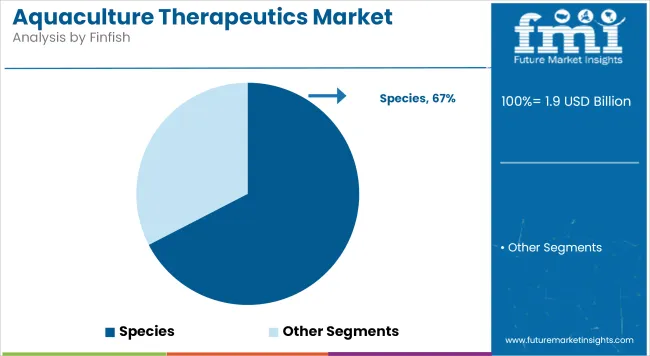
The Finfish segment, accounting for a 67.4% revenue share in 2025, has been identified as the most commercially significant category within the aquaculture therapeutics market. This dominance has been supported by the widespread cultivation of species such as salmon, tilapia, and catfish, which collectively represent the majority of global aquaculture production. These species are highly susceptible to a range of bacterial, parasitic, and fungal infections, leading to increased therapeutic requirements.
The segment's expansion has been enabled by structured farming systems, high stocking densities, and advanced monitoring technologies, which have encouraged the use of proactive health management protocols. Vaccine deployment has been particularly aggressive in salmon farming across Europe and North America, while anti-infectives remain crucial in Asian finfish operations.
The economic value and export potential of finfish have led to higher veterinary investments and disease surveillance, reinforcing the segment’s priority within aquaculture therapeutics. Innovations in feed-based drug delivery and species-specific vaccines have also contributed to the segment’s continued expansion.
Holding a 36.9% share in 2025, Veterinary Hospitals have remained the leading end-user segment in the aquaculture therapeutics market. This growth has been attributed to the increased demand for specialized diagnostic services, precision disease identification, and advanced therapeutic administration. Veterinary hospitals have played a critical role in monitoring aquatic health through laboratory-backed diagnostics, enabling timely intervention and targeted treatment protocols.
Hospitals have been preferred by large-scale aquaculture enterprises for their access to certified professionals, post-treatment monitoring, and regulatory compliance. In regions where government-funded animal healthcare infrastructure exists such as Norway, Chile, and select Indian coastal states public veterinary hospitals have facilitated structured therapeutic dispensing.
Furthermore, new aquatic medicine divisions and mobile units have been introduced in developing economies, expanding reach into rural and semi-intensive aquaculture zones. Through centralized expertise, improved accessibility, and higher trust from producers, veterinary hospitals are expected to maintain their lead as the most reliable route for aquaculture therapeutics administration.
The Aquaculture Therapeutics Market Faces Challenges Such as Stringent Regulatory Approvals Delaying Product Commercialization.
The approval process for aquaculture therapeutics is highly stringent, requiring compliance with extensive regulatory frameworks set by organizations such as the USA FDA, EMA, and other national regulatory bodies. This complexity is particularly pronounced in developing nations, where regulatory pathways may be less structured or heavily bureaucratic, leading to prolonged approval timelines.
Companies must conduct comprehensive clinical trials, safety assessments, and environmental impact studies before securing market authorization. These regulatory hurdles not only delay the commercialization of new products but also inflate research and development costs, disproportionately affecting small and medium-sized enterprises (SMEs) that lack the financial resilience of larger corporations. Such barriers can limit innovation and slow down the introduction of novel therapeutics in the market.
The Aquaculture Therapeutics Market Presents Significant Opportunities Through The Rise Of Non-Antibiotic Solutions.
With growing concerns over antibiotic resistance and regulatory restrictions on antimicrobial use in aquaculture, there is an increasing shift towards non-antibiotic therapeutics. Vaccines, probiotics, immunostimulants, and phage therapy have emerged as effective alternatives, reducing the dependency on antibiotics while enhancing disease prevention and control.
Governments and industry stakeholders are investing in research to improve the efficacy of these solutions, ensuring they meet global safety and sustainability standards. Probiotics help in maintaining gut health and improving fish immunity, while immunostimulants and phage therapy offer targeted disease control without contributing to antimicrobial resistance. As consumer demand for antibiotic-free seafood rises, these innovations align with sustainability initiatives, creating significant growth opportunities for aquaculture therapeutics providers.
The aquaculture industry is undergoing a transformative shift toward preventive health management, with a growing emphasis on proactive rather than reactive approaches. Vaccination programs, real-time water quality monitoring, and the use of functional feed additives and nutritional supplements are becoming central to reducing disease incidence and improving overall yield.
Concurrently, advancements in genomics and diagnostics are playing a pivotal role in early disease detection. Rapid diagnostic kits, genetic screening tools, and biomarker-based monitoring enable aquaculture producers to identify pathogens swiftly, contain outbreaks, and mitigate economic losses.
These innovations are significantly reducing response times and improving biosecurity protocols across aquaculture farms. Furthermore, there is a strong movement toward customization of therapeutics tailored to specific aquatic species. Targeted solutions for shrimp, tilapia, salmon, and carp are being developed based on unique disease susceptibility and physiological responses.
The aquaculture therapeutics market is witnessing a surge in biotechnology-based innovations, including RNA-based vaccines, phage therapy, and CRISPR-based disease resistance programs. These novel approaches are redefining disease prevention by offering highly specific, effective, and environmentally sustainable alternatives to traditional antibiotics and chemicals.
Startups and established firms alike are investing heavily in research to bring these next-generation therapeutics to market. Their development is closely tied to the growing demand for antibiotic-free seafood and increasing regulatory pressure to limit drug residues in aquaculture products.Another significant trend is the digitization of fish health management.

Market Outlook
The aquaculture therapeutics market in the United States is experiencing steady growth, fueled by rising seafood consumption, increasing fish farming operations, and the need to address disease outbreaks in high-value species like salmon and trout. The regulatory emphasis on sustainable aquaculture and antibiotic stewardship is driving demand for vaccines, probiotics, and water treatment solutions. Additionally, technological integration-such as real-time health monitoring and precision aquaculture-is enhancing disease prevention and therapeutic application.
Market Growth Factors
Market Forecast
| Country | CAGR (2025 to 2035) |
|---|---|
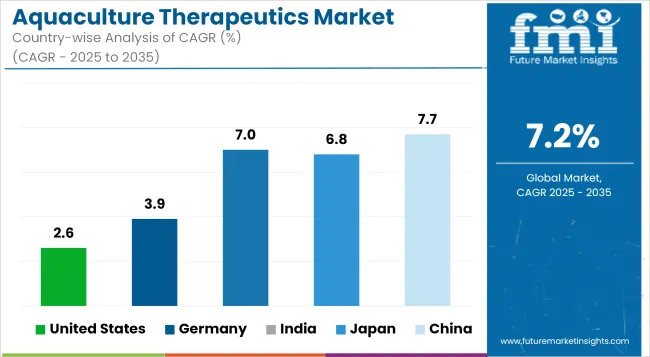
| United States | 2.6% |
Market Outlook
Germany is a global leader in aquaculture therapeutics, particularly in salmon farming. The country has one of the most mature aquaculture ecosystems, supported by extensive research, innovation, and regulation. Germany’s focus on sustainable farming practices has led to widespread adoption of vaccines, integrated pest management (e.g., for sea lice), and advanced monitoring systems.
Market Growth Factors
Market Forecast
| Country | CAGR (2025 to 2035) |
|---|---|
| Germany | 3 .9% |
Market Outlook
India’s aquaculture therapeutics market is growing rapidly, driven by the country’s large-scale freshwater fish and shrimp farming sectors. The increasing frequency of disease outbreaks-particularly in shrimp hatcheries-has led to growing use of antibiotics, immunostimulants, and functional feed additives. While regulatory oversight is evolving, the need for biosecurity, diagnostics, and disease-specific treatments is creating strong demand for veterinary pharmaceuticals and biologicals in aquaculture.
Market Growth Factors
Market Forecast
| Country | CAGR (2025 to 2035) |
|---|---|
| India | 7.0% |
Market Outlook
Japan is a major player in global salmon aquaculture, and its therapeutics market is driven by the need to manage bacterial, parasitic, and viral diseases in intensive marine farming environments. Regulatory agencies and the private sector are investing heavily in reducing antibiotic use and improving vaccination rates, particularly against Piscirickettsiasalmonis and sea lice infestations.
Market Growth Factors
Market Forecast
| Country | CAGR (2025 to 2035) |
|---|---|
| Japan | 6.8% |
Market Outlook
China is the world’s largest producer and consumer of aquaculture products, and its therapeutics market is expanding rapidly. The country is shifting from traditional, high-density farming methods toward more sustainable practices, driving demand for safer and more effective therapeutics. Regulatory reforms are targeting antibiotic misuse, creating space for innovation in vaccines, immune boosters, and environmentally safe treatments.
Market Growth Factors
Market Forecast
| Country | CAGR (2025 to 2035) |
|---|---|
| China | 7.7% |
The aquaculture therapeutics market is highly competitive, driven by the increasing global demand for farmed seafood, advancements in fish health management, and the rising incidence of aquatic diseases. Companies are investing in antimicrobial agents, parasiticides, vaccines, and probiotic-based solutions to maintain a competitive edge. The market is shaped by well-established animal health companies, aquaculture pharmaceutical developers, and emerging biotechnology firms, each contributing to the evolving landscape of aquatic animal therapeutics.
the market is segmented into Anti-Infectives, Vaccines, Immunostimulants, Probiotics, Feed Additives & Nutraceuticals, and Disinfectants.
the market is segmented into Finfish, Crustaceans, Mollusks, and Others.
the market is segmented into Veterinary Pharmacies, E-Commerce, Veterinary Clinics, and Veterinary Hospitals.
the Aquaculture Therapeutics Market is analyzed across North America, Latin America, Western Europe, Eastern Europe, East Asia, South Asia & Pacific, and the Middle East & Africa.
The Aquaculture Therapeutics industry is projected to witness CAGR of 7.2% between 2025 and 2035.
The Aquaculture Therapeutics industry stood at USD 1,865.3 million in 2024.
The global Aquaculture Therapeutics industry is anticipated to reach USD 3.8 billion by 2035 end.
China is expected to show a CAGR of 7.7% in the assessment period.
The key players operating in the global Aquaculture Therapeutics industry are Zoetis Inc., Merck Animal Health, Elanco Animal Health, Phibro Animal Health, Benchmark Holdings plc, INVE Aquaculture, Skretting (Nutreco), AquaBounty Technologies, HIPRA, Virbac Animal Health and others.


Our Research Products

The "Full Research Suite" delivers actionable market intel, deep dives on markets or technologies, so clients act faster, cut risk, and unlock growth.

The Leaderboard benchmarks and ranks top vendors, classifying them as Established Leaders, Leading Challengers, or Disruptors & Challengers.

Locates where complements amplify value and substitutes erode it, forecasting net impact by horizon

We deliver granular, decision-grade intel: market sizing, 5-year forecasts, pricing, adoption, usage, revenue, and operational KPIs—plus competitor tracking, regulation, and value chains—across 60 countries broadly.

Spot the shifts before they hit your P&L. We track inflection points, adoption curves, pricing moves, and ecosystem plays to show where demand is heading, why it is changing, and what to do next across high-growth markets and disruptive tech

Real-time reads of user behavior. We track shifting priorities, perceptions of today’s and next-gen services, and provider experience, then pace how fast tech moves from trial to adoption, blending buyer, consumer, and channel inputs with social signals (#WhySwitch, #UX).

Partner with our analyst team to build a custom report designed around your business priorities. From analysing market trends to assessing competitors or crafting bespoke datasets, we tailor insights to your needs.
Supplier Intelligence
Discovery & Profiling
Capacity & Footprint
Performance & Risk
Compliance & Governance
Commercial Readiness
Who Supplies Whom
Scorecards & Shortlists
Playbooks & Docs
Category Intelligence
Definition & Scope
Demand & Use Cases
Cost Drivers
Market Structure
Supply Chain Map
Trade & Policy
Operating Norms
Deliverables
Buyer Intelligence
Account Basics
Spend & Scope
Procurement Model
Vendor Requirements
Terms & Policies
Entry Strategy
Pain Points & Triggers
Outputs
Pricing Analysis
Benchmarks
Trends
Should-Cost
Indexation
Landed Cost
Commercial Terms
Deliverables
Brand Analysis
Positioning & Value Prop
Share & Presence
Customer Evidence
Go-to-Market
Digital & Reputation
Compliance & Trust
KPIs & Gaps
Outputs
Full Research Suite comprises of:
Market outlook & trends analysis
Interviews & case studies
Strategic recommendations
Vendor profiles & capabilities analysis
5-year forecasts
8 regions and 60+ country-level data splits
Market segment data splits
12 months of continuous data updates
DELIVERED AS:
PDF EXCEL ONLINE
Aquaculture Prebiotics Market Analysis - Size, Share, and Forecast Outlook 2025 to 2035
Aquaculture Equipment Market Size and Share Forecast Outlook 2025 to 2035
Aquaculture Vaccines Market Analysis - Size, Share, and Forecast Outlook for 2025 to 2035
Aquaculture Market – Growth, Demand & Sustainable Practices
Global Aquaculture Immunostimulants Market Analysis – Size, Share & Forecast 2024-2034
Biotherapeutics Virus Removal Filters Market Trends – Growth & Forecast 2025 to 2035
COPD Therapeutics Market Report – Growth, Demand & Industry Forecast 2023-2033
Chile Aquaculture Vaccines Market Insights – Size, Demand & Forecast 2025-2035
China Aquaculture Vaccines Market Outlook – Growth & Forecast 2025-2035
Norway Aquaculture Vaccines Market Insights – Size, Demand & Growth 2025-2035
Digital Therapeutics and Wellness Market Size and Share Forecast Outlook 2025 to 2035
Digital Therapeutics Market Size and Share Forecast Outlook 2025 to 2035
Vietnam Aquaculture Vaccines Market Trends – Growth & Demand 2025-2035
Peptide Therapeutics Market Analysis - Growth & Forecast 2024 to 2034
Advanced Therapeutics Pharmaceutical Outsourcing Market Size and Share Forecast Outlook 2025 to 2035
Glaucoma Therapeutics Market Size and Share Forecast Outlook 2025 to 2035
Leukemia Therapeutics Treatment Market Analysis - Growth & Forecast 2025 to 2035
Precision Aquaculture Market Size and Share Forecast Outlook 2025 to 2035
Demand for Aquaculture Vaccines in USA Size and Share Forecast Outlook 2025 to 2035
Demand for Aquaculture Vaccines in Japan Size and Share Forecast Outlook 2025 to 2035

Thank you!
You will receive an email from our Business Development Manager. Please be sure to check your SPAM/JUNK folder too.
Chat With
MaRIA