The Aquarium Hydrometers Market is estimated to be valued at USD 1.4 million in 2025 and is projected to reach USD 3.0 million by 2035, registering a compound annual growth rate (CAGR) of 8.0% over the forecast period.
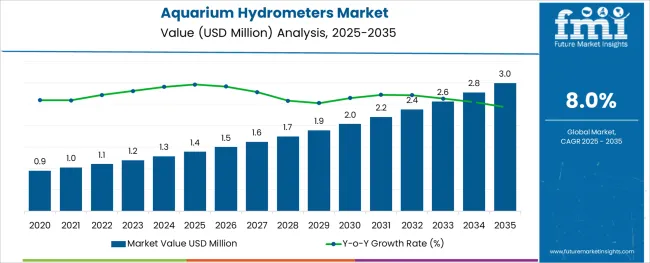
The aquarium hydrometers market is experiencing stable expansion driven by growing interest in marine aquariums, reef systems, and sustainable aquaculture practices. As consumer preferences shift toward replicating natural marine habitats, precise salinity measurement tools have become essential for maintaining aquatic health. The increasing popularity of hobbyist saltwater aquariums and professional marine displays has intensified demand for accurate and user-friendly hydrometers.
Manufacturers are introducing compact, affordable devices with durable construction and clear calibration to cater to a broad user base ranging from beginners to advanced aquarists. In parallel, e-commerce and specialty pet stores have expanded access to a variety of hydrometer models, further supporting global market penetration.
Advancements in design and material technology have enabled more reliable readings and longer product life, which continues to drive product replacement and upgrade cycles. Future growth opportunities are expected to stem from emerging markets, increased marine conservation awareness, and integration of hydrometers with digital water monitoring systems.
The market is segmented by Product Type, Price, Application, and Distribution Channel and region. By Product Type, the market is divided into Swing arm hydrometers and Floating hydrometers. In terms of Price, the market is classified into Low, Economy, and Premium. Based on Application, the market is segmented into Seawater Aquarium and Freshwater Aquarium. By Distribution Channel, the market is divided into Supermarket/Hypermarkets, Specialty Stores, Wholesale distributors, Aqua specialty Centre, Aquarium shops, Pet Care Shops, Online Retailers, and Other Sales Channel. Regionally, the market is classified into North America, Latin America, Western Europe, Eastern Europe, Balkan & Baltic Countries, Russia & Belarus, Central Asia, East Asia, South Asia & Pacific, and the Middle East & Africa.
The market is segmented by Product Type, Price, Application, and Distribution Channel and region. By Product Type, the market is divided into Swing arm hydrometers and Floating hydrometers. In terms of Price, the market is classified into Low, Economy, and Premium. Based on Application, the market is segmented into Seawater Aquarium and Freshwater Aquarium. By Distribution Channel, the market is divided into Supermarket/Hypermarkets, Specialty Stores, Wholesale distributors, Aqua specialty Centre, Aquarium shops, Pet Care Shops, Online Retailers, and Other Sales Channel. Regionally, the market is classified into North America, Latin America, Western Europe, Eastern Europe, Balkan & Baltic Countries, Russia & Belarus, Central Asia, East Asia, South Asia & Pacific, and the Middle East & Africa.
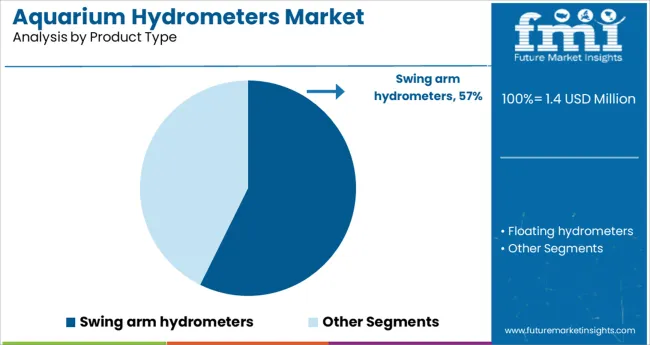
Swing arm hydrometers are projected to account for 57.3% of the product type segment revenue in 2025, establishing themselves as the most widely adopted design. This dominance is due to their simple operation, cost effectiveness, and sufficient accuracy for most marine aquarium setups.
Swing arm models are favored for their clear salinity indication, easy calibration, and compatibility with a wide range of tank sizes. Their lightweight plastic construction also ensures safety and durability, making them a preferred choice among entry-level users and budget-conscious hobbyists.
These hydrometers have seen consistent use in both home and commercial aquarium settings due to their balance of affordability and functional reliability. Continued innovation in visual readability and design enhancements has contributed to the sustained leadership of this segment in the aquarium hydrometers market.
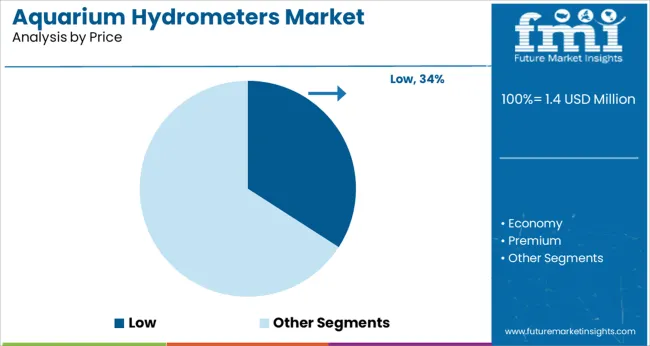
The low price segment is expected to contribute 34.1% of the overall market revenue in 2025, leading the price-based segmentation. This growth is being driven by the expanding entry-level aquarium user base and the increasing availability of affordable hydrometers through online and retail channels.
Budget-friendly products are gaining traction due to their accessibility and sufficient performance for basic salinity monitoring needs. Manufacturers are focusing on delivering functional, low-cost units that appeal to cost-sensitive consumers without compromising essential accuracy.
The rise of DIY aquarists and educational institutions adopting aquarium setups has further supported demand for low-priced instruments. Retail bundling with aquarium starter kits has also reinforced this segment’s dominance, particularly in regions witnessing first-time marine tank ownership.
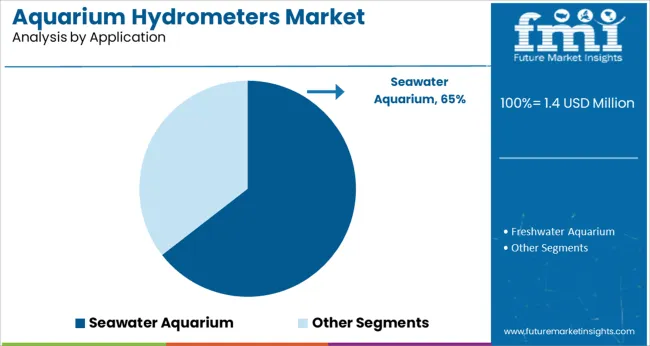
The seawater aquarium segment is anticipated to hold 64.5% of the market share in 2025, making it the most significant application category. This position is driven by the critical role salinity plays in the health of marine organisms and coral ecosystems.
The complexity of seawater tank maintenance, compared to freshwater systems, necessitates consistent monitoring, thus elevating demand for reliable hydrometers. The increasing adoption of reef tanks and marine fish species by hobbyists and aquaculture centers has amplified the need for precise salinity instruments.
As awareness of proper marine care grows, hydrometers are becoming standard tools in both commercial aquariums and household setups. Retailers and aquarium service providers also recommend regular hydrometer usage as part of tank maintenance routines, supporting the ongoing growth of the seawater aquarium application segment.
People keep fish, invertebrates, amphibians, aquatic reptiles including turtles, and aquatic plants in aquariums and use aquarium accessories. Aquarium fish and aquarium accessories are getting increasingly popular.
The global aquarium accessories market is primarily driven by high demand for ornamental fish, as well as the aesthetic benefits of having an aquarium at home. Consumers are becoming more interested in keeping fish in aquariums and decorating them with attractive plants and other invertebrate species because it provides therapeutic advantages and helps to alleviate stress among hospital patients.
Low margins in aquarium accessories items, on the other hand, are limiting sales in the market. Regular maintenance and adequate care are vital for maintaining a healthy environment for fishes. One of the most important aspects of aquarium maintenance is choosing the right type of fish and ensuring that the number of fish does not exceed the aquarium's complete capacity.
High Demand for Decorative Fish Aquariums Will Boost Sales
Due to their sensitivity to abrupt temperature changes in the environment in which they are housed, fish should be kept in the same water quality as their natural habitat. If the fish tank is too chilly, the fishes become stressed and sensitive to parasite infestations, and if the aquarium is too hot, the dissolved oxygen level drops rapidly, causing the fish to suffocate. As a result, adequate temperature control systems must be implemented, and aquarium accessories are essential.
Depending on the tank's residents, an aquarium usually includes filtration equipment, artificial lighting, and a heater or chiller. Aquarium filtration systems that combine biological and mechanical elements are prevalent. It has been estimated that 1.5 to 2 million people around the world have aquariums, with 600,000 households owning an aquarium to decorate their houses.
Rising Awareness Regarding Water Salinity and its Harmful Effects Will Boost Sales
 >
>
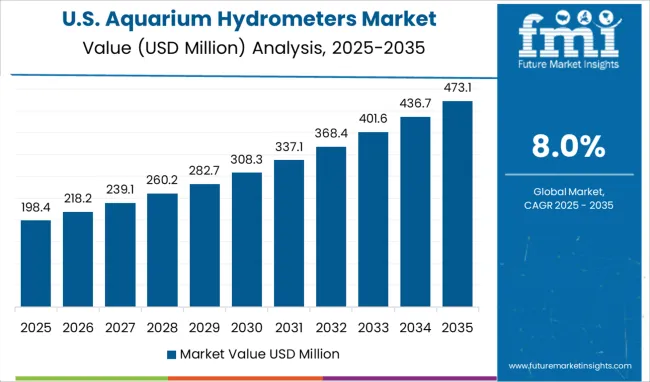
The USA is expected to emerge as one of the most lucrative markets for aquarium accessories due to high adoption of ornamental fish aquariums for decorative purposes. In terms of pet fish ownership, the USA accounted for the largest share. More than 11 million ornamental fishes are taken from the world’s reefs annually, to meet the demand of 700,000 aquarium hobbyists in the USA aquarium accessories market.
High Demand for Aquarium Accessories Across Fisheries in China Will Augment Growth
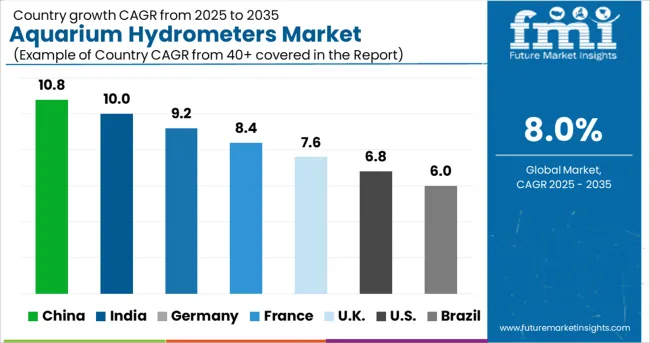
In China, individuals are preferring fishes as pets across many households. They are also constructing larger aquariums for aesthetic purposes in restaurants, cafes and spas. High adoption of ornamental fishes and is driving sales of aquarium accessories in China, which is expected to have a direct impact on sales of aquarium hydrometers.
Swing Arm Hydrometer is being Preferred by Consumers
The swing-arm hydrometer is very cheap and easy to operate, but it’s not without its limitations. In a swing arm hydrometer, the bubble can easily get stuck and it may cause inaccurate reading but still, the swing arm hydrometer is a widely used one. Most beginner aquarists are using swing-arm hydrometers.
Easy Availability and Wide Variety Will Drive Sales of Aquarium Hydrometers Online
Increasing penetration of e-commerce and online sales in the aquarium accessories market is another factor which is expected to fuel sales in the market. Online platforms enable consumers to access various new products at any given time. Online platforms also help in significantly reducing distribution costs.
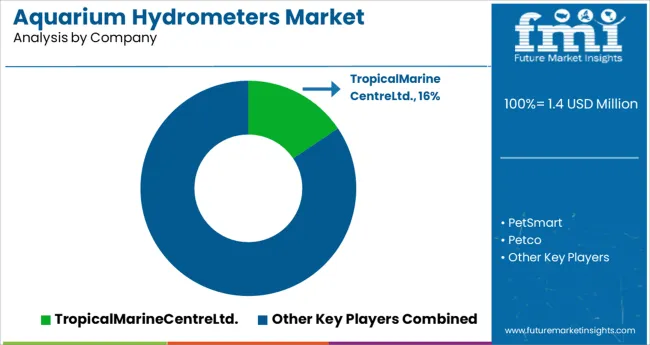
Leading players operating in the global aquarium hydrometer market are investing in research and development to improve the functionality of these hydrometers. They are also launching new products on online sales channels to improve sales. In addition to this, some players are investing in mergers, acquisitions, and collaborations with smaller brands to revamp their product portfolios. However, product launches will remain the most utilized strategy among key aquarium hydrometer market players. For instance:
| Attribute | Details |
|---|---|
| Estimated Market Size (2025) | USD 1.4 million |
| Projected Market Valuation (2035) | USD 3.0 million |
| Value-based CAGR (2025 to 2035) | 8.0% |
| Forecast Period | 2025 to 2035 |
| Historical Data Available for | 2020 to 2024 |
| Market Analysis | billion for Value |
| Key Regions Covered | North America; Latin America; Europe; East Asia; South Asia; Oceania; and the Middle East & Africa |
| Key Countries covered | The USA, Canada, Brazil, Mexico, Germany, the UK, France, Spain, Italy, Russia, Benelux, South Africa, Northern Africa, GCC Countries, China, Japan, South Korea, India, |
| Key Market Segments Covered | By Product Type, By Application, By end-use, By Price range, Sales Channels, By Region |
| Key Companies Profiled | Tropical Marine CentRE Ltd.; PetSmart; Petco; Petland; Juwel Aquarium; Tetra; Marina; FAGINEY; Eston; That pet place |
| Report Coverage | Market Forecast, Company Share Analysis, Competition Intelligence, DROT Analysis, Market Dynamics and Challenges, and Strategic Growth Initiatives |
The global aquarium hydrometers market is estimated to be valued at USD 1.4 million in 2025.
It is projected to reach USD 3.0 million by 2035.
The market is expected to grow at a 8.0% CAGR between 2025 and 2035.
The key product types are swing arm hydrometers and floating hydrometers.
low segment is expected to dominate with a 34.1% industry share in 2025.


Our Research Products

The "Full Research Suite" delivers actionable market intel, deep dives on markets or technologies, so clients act faster, cut risk, and unlock growth.

The Leaderboard benchmarks and ranks top vendors, classifying them as Established Leaders, Leading Challengers, or Disruptors & Challengers.

Locates where complements amplify value and substitutes erode it, forecasting net impact by horizon

We deliver granular, decision-grade intel: market sizing, 5-year forecasts, pricing, adoption, usage, revenue, and operational KPIs—plus competitor tracking, regulation, and value chains—across 60 countries broadly.

Spot the shifts before they hit your P&L. We track inflection points, adoption curves, pricing moves, and ecosystem plays to show where demand is heading, why it is changing, and what to do next across high-growth markets and disruptive tech

Real-time reads of user behavior. We track shifting priorities, perceptions of today’s and next-gen services, and provider experience, then pace how fast tech moves from trial to adoption, blending buyer, consumer, and channel inputs with social signals (#WhySwitch, #UX).

Partner with our analyst team to build a custom report designed around your business priorities. From analysing market trends to assessing competitors or crafting bespoke datasets, we tailor insights to your needs.
Supplier Intelligence
Discovery & Profiling
Capacity & Footprint
Performance & Risk
Compliance & Governance
Commercial Readiness
Who Supplies Whom
Scorecards & Shortlists
Playbooks & Docs
Category Intelligence
Definition & Scope
Demand & Use Cases
Cost Drivers
Market Structure
Supply Chain Map
Trade & Policy
Operating Norms
Deliverables
Buyer Intelligence
Account Basics
Spend & Scope
Procurement Model
Vendor Requirements
Terms & Policies
Entry Strategy
Pain Points & Triggers
Outputs
Pricing Analysis
Benchmarks
Trends
Should-Cost
Indexation
Landed Cost
Commercial Terms
Deliverables
Brand Analysis
Positioning & Value Prop
Share & Presence
Customer Evidence
Go-to-Market
Digital & Reputation
Compliance & Trust
KPIs & Gaps
Outputs
Full Research Suite comprises of:
Market outlook & trends analysis
Interviews & case studies
Strategic recommendations
Vendor profiles & capabilities analysis
5-year forecasts
8 regions and 60+ country-level data splits
Market segment data splits
12 months of continuous data updates
DELIVERED AS:
PDF EXCEL ONLINE
Aquarium Decor Market Size and Share Forecast Outlook 2025 to 2035
Aquarium Protein Skimmers Market Growth - Trends & Demand Forecast 2025 to 2035
Aquarium Heaters and Chillers Market - Growth & Forecast 2025 to 2035
Aquarium Water Treatment Market Growth - Trends & Forecast 2025 to 2035
Aquarium & Fish Bowls Market Growth - Trends & Forecast to 2035
Aquarium Pumps & Filters Market Demand 2024 to 2034

Thank you!
You will receive an email from our Business Development Manager. Please be sure to check your SPAM/JUNK folder too.
Chat With
MaRIA