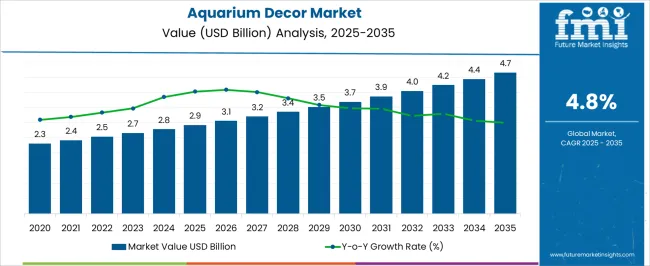
As per newly released data by Future Market Insights (FMI), the aquarium decor market is estimated at USD 2,648.2 million in 2023 and is projected to reach USD 4,313.6 million by 2033, at a CAGR of 5.0% from 2023 to 2033. The aquarium decor market share in its parent market is 2% to 6%.
Attribute | Details |
---|---|
Aquarium decor Market Estimated Size (2023) | USD 2,648.2 million |
Aquarium decor Market Projected Size (2033) | USD 4,313.6 million |
Aquarium decor Value-based CAGR (2023 to 2033) | 5.0% |
Aquarium decor Market Top players market share | 5% to 10% |
The global aquarium décor market is estimated to progress owing to an increase in the culture of fish adoption. The stability in consumers’ income and living standards is causing the rise in demand in the aquarium décor market. A well-maintained, well-planted aquarium is one of the most attractive living ornaments in most homes, hotels, and restaurants.
The key trend driving the aquarium decor market is the rise in pet adoption rate, including fish. Due to the growing fascination with the undersea world and its impact on the environment in houses and other residential and business spaces, the worldwide aquarium decor market has grown in popularity over the years.
Aquariums have become a vital interaction with nature for the younger generation and a source of information about aquatic animals. In recent years, keeping fish has been a popular pastime among people all over the world, causing the worldwide aquarium decor industry to develop at a rapid pace.
Nowadays, due to the rise of awareness among consumers about environmental sustainability, they prefer more environmentally friendly products. Consumers demand natural and live plants, toys made from stones, ornaments made from natural material, etc., as they are more durable and biodegradable. Not only has this changed the aquarium décor market outlook, but also impacted the other industries heavily.
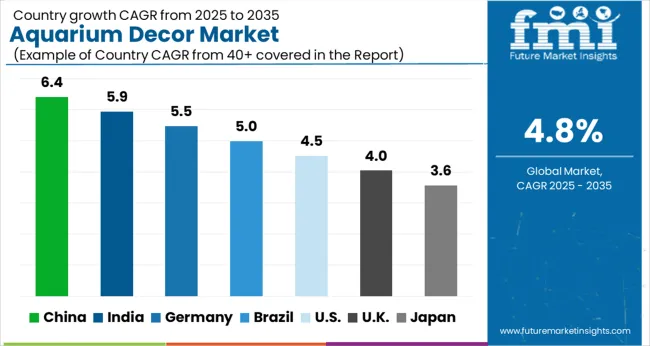
Country | 2022 Value Share in Global Market |
---|---|
United States | 5.5% |
Germany | 3.0% |
Japan | 4.6% |
Country | CAGR (2023 to 2033) |
---|---|
China | 6.0% |
India | 4.0% |
United Kingdom | 3.9% |
China is always leading in plastic toys manufacturing
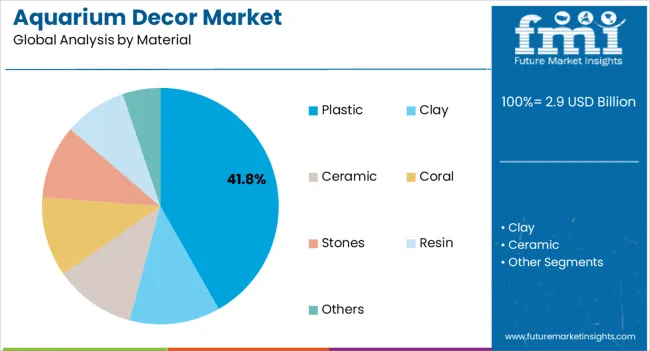
China has always led the plastic toy market globally. In recent years China has been investing more money in research and development. They are developing high-technology plastic toys as aquarium toys. Aquarium décor manufactured in China is found to be durable and sustainable for the environment.
Pet adoption is on a rise in the United Kingdom
The United Kingdom is one of the key markets catering to the growing demand for aquarium decor. During the forecast period 2023 to 2033, the United Kingdom aquarium décor market is likely to develop rapidly. In the United Kingdom, many people already have fish and aquariums. This leads to them buying aquarium accessories to make their fishes feel at home and in their natural habitat.
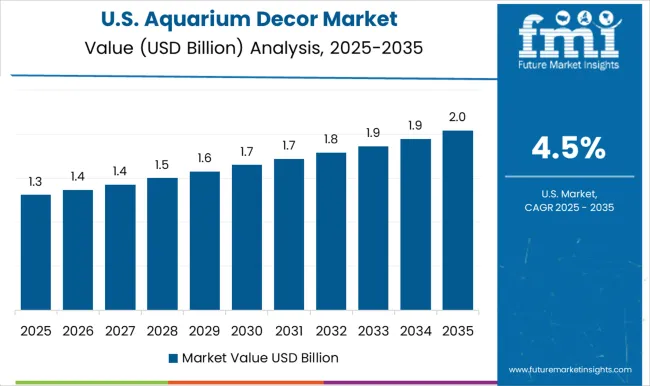
Giving back to the nature is driving the market in the United States
Various benefits supplied by fish attract diverse clients, such as adopting various fish species, connecting with nature, and talking to fish may help you relax. As per recent research, aquarium accessories can assist enhance the rate of survival of fishes in regions where they are present. Thus, in the next years, consumption in the global market sector is expected to increase as consumers become more aware.
Live plants are environment friendly aquarium décor
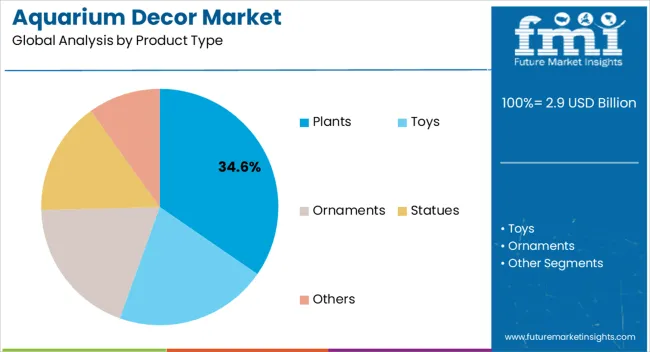
Various products can be used as aquarium accessories, for example, Plants, Toys, Ornaments, Statues, and Others. The most popular product used as aquarium décor has been planted in recent years. Plants are durable and very environmentally friendly. They help filtrate the aquarium, oxygenate the tank, help in breeding among fishes and provide natural food for the fishes in the aquarium.
Low price range products are preferred by consumers
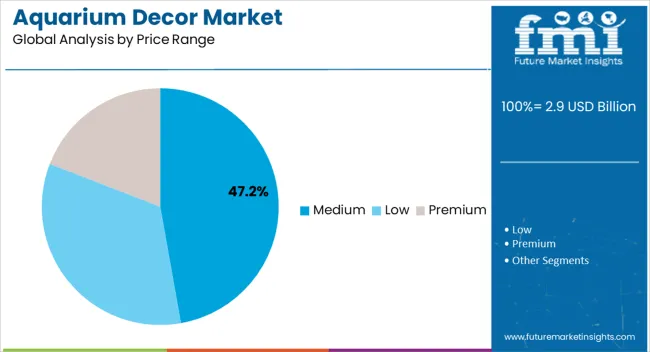
Aquarium décor comes in three different price ranges: low, medium, and premium. Consumers nowadays prefer the low-price range of aquarium accessories. Low-price range aquarium accessories include natural plants and plastic toys. Natural plant is available at low prices because of easy availability, and one does not need to take exceptional care of them.
E-commerce websites made the most sales in the aquarium décor market
Aquarium décors are sold at different stores like E-commerce Websites. Company Owned Websites, Hypermarkets and Supermarkets, Specialty Stores, and Other Retail Stores. E-commerce websites contributed majorly to the aquarium décor market in recent years. This was due to the travel bans, break in the supply chain during the covid-19 pandemic, and lockdown. E-commerce websites advertised and made sales of aquarium decor using social media platforms like YouTube, Instagram, etc.
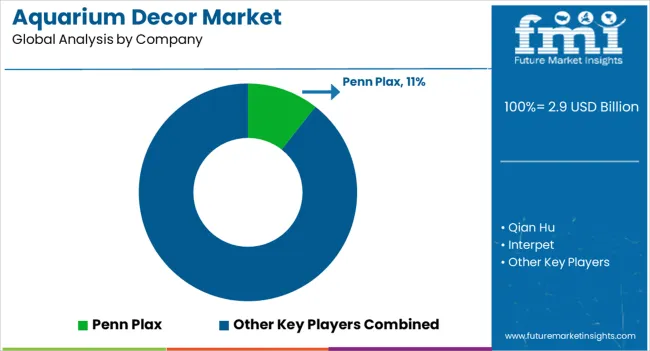
Leading industry players are revolutionizing their product lines by developing attractive aquarium accessories for adopters while offering optimal comfort and function for the fishes.
For instance:
Recent developments
Saving Money and Reducing Carbon Emissions
Several variables affect how much power an aquarium needs, but the biggest ones are the tank's volume and features. A tiny 10-gallon tank would only use around 150kWh per year, which, at an average of 12 cents per kWh, would amount to less than D20 annually. However, the price may grow dramatically if you go for a larger tank and include energy-intensive features like powerful lights and a sump system.
Aquarium lighting accounts for about 45% of total tank utilization, making it the greatest energy consumer among tank equipment. You will need a tank heater to keep the water at tropical temperatures, and a tank filter is essential for any aquarium.
Heating and filtration for most tanks are required around the clock, while illumination can be controlled as needed. However, it is important to remember that different tanks call for various illumination intensity levels. For instance, a planted aquarium may need powerful lighting, whereas a fish-only tank with a single fluorescent bulb for daytime illumination may suffice.
LED lighting has been the most important improvement in aquarium lighting. Compared to the 15-40 watts of a typical fluorescent bulb, the 75-160 watts of power used by VHO bulbs are quite noticeable. The power consumption of metal halides could reach 1,000 watts; adding in the cost of running an auxiliary fan or chiller is an additional consideration.
On the other hand, LED lights use significantly less energy and produce no heat. Additionally, they are available in a range of hues that make it possible to create both daytime and nighttime lighting systems.
Easily Transportable
It is well-known in the aquarium community that a larger tank size makes it easier to keep the tank's conditions consistent. Therefore, it makes sense that a tank with a volume of 10 gallons will be far more affected by a minor change in pH or chemistry than a tank with 100 gallons.
However, the gap is diminishing as modern technology makes tiny equipment and aquarium systems more accessible and user-friendly.
Currently, micro tanks are all the rage in aquarium accessories. When caring for a nano aquarium, even the smallest misstep might have catastrophic effects on the aquatic life inside.
The hood of many nano tanks already has necessary components like lighting and filtration, but you may also require some optional extras. However, compact aquarium equipment is a huge improvement for tanks where you do not want your equipment to detract from the aesthetics in any way, not just nano tanks.
Robotics and Smart Appliances
Once upon a time, the extent of flexibility to automate aquarium processes was limited to setting a timer for tank lights. The use of automatic timers allowed for the control of the on/off schedule of tank illumination and the integration of automatic feeds.
Today, aquariums are at the stage where they may be self-sufficient because of an automated technology.
Thanks to several innovative technologies and aquarium controllers, it is now possible to automate or operate various pieces of aquarium equipment with a single device. For instance, consider the following aquarium controllers.
Temperature Controller/Thermostat
This type of thermostat or temperature controller has a probe that may be placed within the tank. A thermometer and thermostat are connected to the probe. The device turns on or off automatically based on whether the tank's temperature is higher than or lower than the set point.
Automatic Water Addition
Evaporation is a widespread problem in reef aquariums and other tank layouts. Evaporation not only reduces the amount of water in your tank, but it can also disrupt the water's chemistry. Automatic top off (ATO) systems monitor tank levels and either add or remove water as needed.
PH Controller
A pH controller is useful for both freshwater and saltwater aquariums since it helps keep the pH level constant. The pH of your tank can be adjusted to your liking, and a carbon dioxide system can be added to maintain that range. The carbon dioxide system is activated to decrease pH when the probe detects a rise in pH outside the chosen range.
Oxygen Monitor
Dissolved oxygen levels in an aquarium can be tracked with an in-tank probe and portable programmable gadget, known as an oxygen monitor. Having a system that monitors the oxygen/carbon dioxide balance in an aquarium makes it much easier to keep the environment stable.
Aquarium Monitor
Water temperature, pH, and ammonia levels are only some of the water chemistries that may be monitored by aquarium monitors, which are now available alongside more specialized systems like pH controllers. Even though many of these gadgets log data on a PC, some newer models allow you to retrieve this data remotely.
Rapid Repair with a Single Touch
In today's aquariums, some of the most innovative systems are fully autonomous. You can keep an eye on your aquarium from afar and spot any changes or emerging problems with the help of smartphone apps and computer programmes that link with your aquarium equipment. A future possibility is to have all your tank equipment connected to each other and managed from a single device, such as a smartphone or tablet. With the push of a button, you can monitor your tank's vital signs, tweak the settings of your equipment, and even have your tank dosed with chemicals or medications automatically if necessary.
Aquaculture Techniques
Technically speaking, aquaponics is distinct from maintaining an aquarium in that it entails raising fish and using the water and the fish waste to nourish plants. The nitrogen-rich tank water created by the fish's digestion and excrement can then be poured into the plant and vegetable beds.
Plants thrive in the nutrient-rich water, and depending on the fish you maintain, you may be able to use some of the plants as food. A self-sustaining system, it still needs regular inspection and upkeep, but modern tools make that job much simpler.
Attribute | Details |
---|---|
Forecast Period | 2023 to 2033 |
Historical Data Available for | 2018 to 2022 |
Market Analysis | USD million for Value |
Key Regions Covered | North America; Latin America; Europe; South Asia; East Asia; Oceania; MEA |
Key Countries Covered | USA, Canada, Mexico, Brazil, Peru, Chile, Germany, UK, France, Spain, Italy, Russia, India, Thailand, Indonesia, Malaysia, China, Japan, South Korea, Australia, New Zealand, GCC, Southern Africa, and North Africa |
Key Segments Covered | Product type, Form, End-user Application, Distribution channel. |
Key Companies Profiled | Penn Plax; Qian Hu; Interpet; Jebao; Tropical Marine Centre Spectrum Brands Guangdong Boyu Group; API; Aquaria; AZOO; United Pet Group; ZooMed; Hagen; Blue Ribbon; Hailea Arcadia; Live Aquaria; Aqueon; Guangdong Boyu Group; Spectrum Brands |
Report Coverage | Market Forecast, Company Share Analysis, Competition Intelligence, DROT Analysis, Market Dynamics and Challenges, and Strategic Growth Initiatives |
Customization & Pricing | Available upon Request |
Table 1: Global Market Value (US$ Million) Forecast by Region, 2018 to 2033
Table 2: Global Market Volume (Units) Forecast by Region, 2018 to 2033
Table 3: Global Market Value (US$ Million) Forecast by Product Type, 2018 to 2033
Table 4: Global Market Volume (Units) Forecast by Product Type, 2018 to 2033
Table 5: Global Market Value (US$ Million) Forecast by Material, 2018 to 2033
Table 6: Global Market Volume (Units) Forecast by Material, 2018 to 2033
Table 7: Global Market Value (US$ Million) Forecast by Price Range, 2018 to 2033
Table 8: Global Market Volume (Units) Forecast by Price Range, 2018 to 2033
Table 9: Global Market Value (US$ Million) Forecast by Sales Channel, 2018 to 2033
Table 10: Global Market Volume (Units) Forecast by Sales Channel, 2018 to 2033
Table 11: North America Market Value (US$ Million) Forecast by Country, 2018 to 2033
Table 12: North America Market Volume (Units) Forecast by Country, 2018 to 2033
Table 13: North America Market Value (US$ Million) Forecast by Product Type, 2018 to 2033
Table 14: North America Market Volume (Units) Forecast by Product Type, 2018 to 2033
Table 15: North America Market Value (US$ Million) Forecast by Material, 2018 to 2033
Table 16: North America Market Volume (Units) Forecast by Material, 2018 to 2033
Table 17: North America Market Value (US$ Million) Forecast by Price Range, 2018 to 2033
Table 18: North America Market Volume (Units) Forecast by Price Range, 2018 to 2033
Table 19: North America Market Value (US$ Million) Forecast by Sales Channel, 2018 to 2033
Table 20: North America Market Volume (Units) Forecast by Sales Channel, 2018 to 2033
Table 21: Latin America Market Value (US$ Million) Forecast by Country, 2018 to 2033
Table 22: Latin America Market Volume (Units) Forecast by Country, 2018 to 2033
Table 23: Latin America Market Value (US$ Million) Forecast by Product Type, 2018 to 2033
Table 24: Latin America Market Volume (Units) Forecast by Product Type, 2018 to 2033
Table 25: Latin America Market Value (US$ Million) Forecast by Material, 2018 to 2033
Table 26: Latin America Market Volume (Units) Forecast by Material, 2018 to 2033
Table 27: Latin America Market Value (US$ Million) Forecast by Price Range, 2018 to 2033
Table 28: Latin America Market Volume (Units) Forecast by Price Range, 2018 to 2033
Table 29: Latin America Market Value (US$ Million) Forecast by Sales Channel, 2018 to 2033
Table 30: Latin America Market Volume (Units) Forecast by Sales Channel, 2018 to 2033
Table 31: Western Europe Market Value (US$ Million) Forecast by Country, 2018 to 2033
Table 32: Western Europe Market Volume (Units) Forecast by Country, 2018 to 2033
Table 33: Western Europe Market Value (US$ Million) Forecast by Product Type, 2018 to 2033
Table 34: Western Europe Market Volume (Units) Forecast by Product Type, 2018 to 2033
Table 35: Western Europe Market Value (US$ Million) Forecast by Material, 2018 to 2033
Table 36: Western Europe Market Volume (Units) Forecast by Material, 2018 to 2033
Table 37: Western Europe Market Value (US$ Million) Forecast by Price Range, 2018 to 2033
Table 38: Western Europe Market Volume (Units) Forecast by Price Range, 2018 to 2033
Table 39: Western Europe Market Value (US$ Million) Forecast by Sales Channel, 2018 to 2033
Table 40: Western Europe Market Volume (Units) Forecast by Sales Channel, 2018 to 2033
Table 41: Eastern Europe Market Value (US$ Million) Forecast by Country, 2018 to 2033
Table 42: Eastern Europe Market Volume (Units) Forecast by Country, 2018 to 2033
Table 43: Eastern Europe Market Value (US$ Million) Forecast by Product Type, 2018 to 2033
Table 44: Eastern Europe Market Volume (Units) Forecast by Product Type, 2018 to 2033
Table 45: Eastern Europe Market Value (US$ Million) Forecast by Material, 2018 to 2033
Table 46: Eastern Europe Market Volume (Units) Forecast by Material, 2018 to 2033
Table 47: Eastern Europe Market Value (US$ Million) Forecast by Price Range, 2018 to 2033
Table 48: Eastern Europe Market Volume (Units) Forecast by Price Range, 2018 to 2033
Table 49: Eastern Europe Market Value (US$ Million) Forecast by Sales Channel, 2018 to 2033
Table 50: Eastern Europe Market Volume (Units) Forecast by Sales Channel, 2018 to 2033
Table 51: South Asia and Pacific Market Value (US$ Million) Forecast by Country, 2018 to 2033
Table 52: South Asia and Pacific Market Volume (Units) Forecast by Country, 2018 to 2033
Table 53: South Asia and Pacific Market Value (US$ Million) Forecast by Product Type, 2018 to 2033
Table 54: South Asia and Pacific Market Volume (Units) Forecast by Product Type, 2018 to 2033
Table 55: South Asia and Pacific Market Value (US$ Million) Forecast by Material, 2018 to 2033
Table 56: South Asia and Pacific Market Volume (Units) Forecast by Material, 2018 to 2033
Table 57: South Asia and Pacific Market Value (US$ Million) Forecast by Price Range, 2018 to 2033
Table 58: South Asia and Pacific Market Volume (Units) Forecast by Price Range, 2018 to 2033
Table 59: South Asia and Pacific Market Value (US$ Million) Forecast by Sales Channel, 2018 to 2033
Table 60: South Asia and Pacific Market Volume (Units) Forecast by Sales Channel, 2018 to 2033
Table 61: East Asia Market Value (US$ Million) Forecast by Country, 2018 to 2033
Table 62: East Asia Market Volume (Units) Forecast by Country, 2018 to 2033
Table 63: East Asia Market Value (US$ Million) Forecast by Product Type, 2018 to 2033
Table 64: East Asia Market Volume (Units) Forecast by Product Type, 2018 to 2033
Table 65: East Asia Market Value (US$ Million) Forecast by Material, 2018 to 2033
Table 66: East Asia Market Volume (Units) Forecast by Material, 2018 to 2033
Table 67: East Asia Market Value (US$ Million) Forecast by Price Range, 2018 to 2033
Table 68: East Asia Market Volume (Units) Forecast by Price Range, 2018 to 2033
Table 69: East Asia Market Value (US$ Million) Forecast by Sales Channel, 2018 to 2033
Table 70: East Asia Market Volume (Units) Forecast by Sales Channel, 2018 to 2033
Table 71: Middle East and Africa Market Value (US$ Million) Forecast by Country, 2018 to 2033
Table 72: Middle East and Africa Market Volume (Units) Forecast by Country, 2018 to 2033
Table 73: Middle East and Africa Market Value (US$ Million) Forecast by Product Type, 2018 to 2033
Table 74: Middle East and Africa Market Volume (Units) Forecast by Product Type, 2018 to 2033
Table 75: Middle East and Africa Market Value (US$ Million) Forecast by Material, 2018 to 2033
Table 76: Middle East and Africa Market Volume (Units) Forecast by Material, 2018 to 2033
Table 77: Middle East and Africa Market Value (US$ Million) Forecast by Price Range, 2018 to 2033
Table 78: Middle East and Africa Market Volume (Units) Forecast by Price Range, 2018 to 2033
Table 79: Middle East and Africa Market Value (US$ Million) Forecast by Sales Channel, 2018 to 2033
Table 80: Middle East and Africa Market Volume (Units) Forecast by Sales Channel, 2018 to 2033
Figure 1: Global Market Value (US$ Million) by Product Type, 2023 to 2033
Figure 2: Global Market Value (US$ Million) by Material, 2023 to 2033
Figure 3: Global Market Value (US$ Million) by Price Range, 2023 to 2033
Figure 4: Global Market Value (US$ Million) by Sales Channel, 2023 to 2033
Figure 5: Global Market Value (US$ Million) by Region, 2023 to 2033
Figure 6: Global Market Value (US$ Million) Analysis by Region, 2018 to 2033
Figure 7: Global Market Volume (Units) Analysis by Region, 2018 to 2033
Figure 8: Global Market Value Share (%) and BPS Analysis by Region, 2023 to 2033
Figure 9: Global Market Y-o-Y Growth (%) Projections by Region, 2023 to 2033
Figure 10: Global Market Value (US$ Million) Analysis by Product Type, 2018 to 2033
Figure 11: Global Market Volume (Units) Analysis by Product Type, 2018 to 2033
Figure 12: Global Market Value Share (%) and BPS Analysis by Product Type, 2023 to 2033
Figure 13: Global Market Y-o-Y Growth (%) Projections by Product Type, 2023 to 2033
Figure 14: Global Market Value (US$ Million) Analysis by Material, 2018 to 2033
Figure 15: Global Market Volume (Units) Analysis by Material, 2018 to 2033
Figure 16: Global Market Value Share (%) and BPS Analysis by Material, 2023 to 2033
Figure 17: Global Market Y-o-Y Growth (%) Projections by Material, 2023 to 2033
Figure 18: Global Market Value (US$ Million) Analysis by Price Range, 2018 to 2033
Figure 19: Global Market Volume (Units) Analysis by Price Range, 2018 to 2033
Figure 20: Global Market Value Share (%) and BPS Analysis by Price Range, 2023 to 2033
Figure 21: Global Market Y-o-Y Growth (%) Projections by Price Range, 2023 to 2033
Figure 22: Global Market Value (US$ Million) Analysis by Sales Channel, 2018 to 2033
Figure 23: Global Market Volume (Units) Analysis by Sales Channel, 2018 to 2033
Figure 24: Global Market Value Share (%) and BPS Analysis by Sales Channel, 2023 to 2033
Figure 25: Global Market Y-o-Y Growth (%) Projections by Sales Channel, 2023 to 2033
Figure 26: Global Market Attractiveness by Product Type, 2023 to 2033
Figure 27: Global Market Attractiveness by Material, 2023 to 2033
Figure 28: Global Market Attractiveness by Price Range, 2023 to 2033
Figure 29: Global Market Attractiveness by Sales Channel, 2023 to 2033
Figure 30: Global Market Attractiveness by Region, 2023 to 2033
Figure 31: North America Market Value (US$ Million) by Product Type, 2023 to 2033
Figure 32: North America Market Value (US$ Million) by Material, 2023 to 2033
Figure 33: North America Market Value (US$ Million) by Price Range, 2023 to 2033
Figure 34: North America Market Value (US$ Million) by Sales Channel, 2023 to 2033
Figure 35: North America Market Value (US$ Million) by Country, 2023 to 2033
Figure 36: North America Market Value (US$ Million) Analysis by Country, 2018 to 2033
Figure 37: North America Market Volume (Units) Analysis by Country, 2018 to 2033
Figure 38: North America Market Value Share (%) and BPS Analysis by Country, 2023 to 2033
Figure 39: North America Market Y-o-Y Growth (%) Projections by Country, 2023 to 2033
Figure 40: North America Market Value (US$ Million) Analysis by Product Type, 2018 to 2033
Figure 41: North America Market Volume (Units) Analysis by Product Type, 2018 to 2033
Figure 42: North America Market Value Share (%) and BPS Analysis by Product Type, 2023 to 2033
Figure 43: North America Market Y-o-Y Growth (%) Projections by Product Type, 2023 to 2033
Figure 44: North America Market Value (US$ Million) Analysis by Material, 2018 to 2033
Figure 45: North America Market Volume (Units) Analysis by Material, 2018 to 2033
Figure 46: North America Market Value Share (%) and BPS Analysis by Material, 2023 to 2033
Figure 47: North America Market Y-o-Y Growth (%) Projections by Material, 2023 to 2033
Figure 48: North America Market Value (US$ Million) Analysis by Price Range, 2018 to 2033
Figure 49: North America Market Volume (Units) Analysis by Price Range, 2018 to 2033
Figure 50: North America Market Value Share (%) and BPS Analysis by Price Range, 2023 to 2033
Figure 51: North America Market Y-o-Y Growth (%) Projections by Price Range, 2023 to 2033
Figure 52: North America Market Value (US$ Million) Analysis by Sales Channel, 2018 to 2033
Figure 53: North America Market Volume (Units) Analysis by Sales Channel, 2018 to 2033
Figure 54: North America Market Value Share (%) and BPS Analysis by Sales Channel, 2023 to 2033
Figure 55: North America Market Y-o-Y Growth (%) Projections by Sales Channel, 2023 to 2033
Figure 56: North America Market Attractiveness by Product Type, 2023 to 2033
Figure 57: North America Market Attractiveness by Material, 2023 to 2033
Figure 58: North America Market Attractiveness by Price Range, 2023 to 2033
Figure 59: North America Market Attractiveness by Sales Channel, 2023 to 2033
Figure 60: North America Market Attractiveness by Country, 2023 to 2033
Figure 61: Latin America Market Value (US$ Million) by Product Type, 2023 to 2033
Figure 62: Latin America Market Value (US$ Million) by Material, 2023 to 2033
Figure 63: Latin America Market Value (US$ Million) by Price Range, 2023 to 2033
Figure 64: Latin America Market Value (US$ Million) by Sales Channel, 2023 to 2033
Figure 65: Latin America Market Value (US$ Million) by Country, 2023 to 2033
Figure 66: Latin America Market Value (US$ Million) Analysis by Country, 2018 to 2033
Figure 67: Latin America Market Volume (Units) Analysis by Country, 2018 to 2033
Figure 68: Latin America Market Value Share (%) and BPS Analysis by Country, 2023 to 2033
Figure 69: Latin America Market Y-o-Y Growth (%) Projections by Country, 2023 to 2033
Figure 70: Latin America Market Value (US$ Million) Analysis by Product Type, 2018 to 2033
Figure 71: Latin America Market Volume (Units) Analysis by Product Type, 2018 to 2033
Figure 72: Latin America Market Value Share (%) and BPS Analysis by Product Type, 2023 to 2033
Figure 73: Latin America Market Y-o-Y Growth (%) Projections by Product Type, 2023 to 2033
Figure 74: Latin America Market Value (US$ Million) Analysis by Material, 2018 to 2033
Figure 75: Latin America Market Volume (Units) Analysis by Material, 2018 to 2033
Figure 76: Latin America Market Value Share (%) and BPS Analysis by Material, 2023 to 2033
Figure 77: Latin America Market Y-o-Y Growth (%) Projections by Material, 2023 to 2033
Figure 78: Latin America Market Value (US$ Million) Analysis by Price Range, 2018 to 2033
Figure 79: Latin America Market Volume (Units) Analysis by Price Range, 2018 to 2033
Figure 80: Latin America Market Value Share (%) and BPS Analysis by Price Range, 2023 to 2033
Figure 81: Latin America Market Y-o-Y Growth (%) Projections by Price Range, 2023 to 2033
Figure 82: Latin America Market Value (US$ Million) Analysis by Sales Channel, 2018 to 2033
Figure 83: Latin America Market Volume (Units) Analysis by Sales Channel, 2018 to 2033
Figure 84: Latin America Market Value Share (%) and BPS Analysis by Sales Channel, 2023 to 2033
Figure 85: Latin America Market Y-o-Y Growth (%) Projections by Sales Channel, 2023 to 2033
Figure 86: Latin America Market Attractiveness by Product Type, 2023 to 2033
Figure 87: Latin America Market Attractiveness by Material, 2023 to 2033
Figure 88: Latin America Market Attractiveness by Price Range, 2023 to 2033
Figure 89: Latin America Market Attractiveness by Sales Channel, 2023 to 2033
Figure 90: Latin America Market Attractiveness by Country, 2023 to 2033
Figure 91: Western Europe Market Value (US$ Million) by Product Type, 2023 to 2033
Figure 92: Western Europe Market Value (US$ Million) by Material, 2023 to 2033
Figure 93: Western Europe Market Value (US$ Million) by Price Range, 2023 to 2033
Figure 94: Western Europe Market Value (US$ Million) by Sales Channel, 2023 to 2033
Figure 95: Western Europe Market Value (US$ Million) by Country, 2023 to 2033
Figure 96: Western Europe Market Value (US$ Million) Analysis by Country, 2018 to 2033
Figure 97: Western Europe Market Volume (Units) Analysis by Country, 2018 to 2033
Figure 98: Western Europe Market Value Share (%) and BPS Analysis by Country, 2023 to 2033
Figure 99: Western Europe Market Y-o-Y Growth (%) Projections by Country, 2023 to 2033
Figure 100: Western Europe Market Value (US$ Million) Analysis by Product Type, 2018 to 2033
Figure 101: Western Europe Market Volume (Units) Analysis by Product Type, 2018 to 2033
Figure 102: Western Europe Market Value Share (%) and BPS Analysis by Product Type, 2023 to 2033
Figure 103: Western Europe Market Y-o-Y Growth (%) Projections by Product Type, 2023 to 2033
Figure 104: Western Europe Market Value (US$ Million) Analysis by Material, 2018 to 2033
Figure 105: Western Europe Market Volume (Units) Analysis by Material, 2018 to 2033
Figure 106: Western Europe Market Value Share (%) and BPS Analysis by Material, 2023 to 2033
Figure 107: Western Europe Market Y-o-Y Growth (%) Projections by Material, 2023 to 2033
Figure 108: Western Europe Market Value (US$ Million) Analysis by Price Range, 2018 to 2033
Figure 109: Western Europe Market Volume (Units) Analysis by Price Range, 2018 to 2033
Figure 110: Western Europe Market Value Share (%) and BPS Analysis by Price Range, 2023 to 2033
Figure 111: Western Europe Market Y-o-Y Growth (%) Projections by Price Range, 2023 to 2033
Figure 112: Western Europe Market Value (US$ Million) Analysis by Sales Channel, 2018 to 2033
Figure 113: Western Europe Market Volume (Units) Analysis by Sales Channel, 2018 to 2033
Figure 114: Western Europe Market Value Share (%) and BPS Analysis by Sales Channel, 2023 to 2033
Figure 115: Western Europe Market Y-o-Y Growth (%) Projections by Sales Channel, 2023 to 2033
Figure 116: Western Europe Market Attractiveness by Product Type, 2023 to 2033
Figure 117: Western Europe Market Attractiveness by Material, 2023 to 2033
Figure 118: Western Europe Market Attractiveness by Price Range, 2023 to 2033
Figure 119: Western Europe Market Attractiveness by Sales Channel, 2023 to 2033
Figure 120: Western Europe Market Attractiveness by Country, 2023 to 2033
Figure 121: Eastern Europe Market Value (US$ Million) by Product Type, 2023 to 2033
Figure 122: Eastern Europe Market Value (US$ Million) by Material, 2023 to 2033
Figure 123: Eastern Europe Market Value (US$ Million) by Price Range, 2023 to 2033
Figure 124: Eastern Europe Market Value (US$ Million) by Sales Channel, 2023 to 2033
Figure 125: Eastern Europe Market Value (US$ Million) by Country, 2023 to 2033
Figure 126: Eastern Europe Market Value (US$ Million) Analysis by Country, 2018 to 2033
Figure 127: Eastern Europe Market Volume (Units) Analysis by Country, 2018 to 2033
Figure 128: Eastern Europe Market Value Share (%) and BPS Analysis by Country, 2023 to 2033
Figure 129: Eastern Europe Market Y-o-Y Growth (%) Projections by Country, 2023 to 2033
Figure 130: Eastern Europe Market Value (US$ Million) Analysis by Product Type, 2018 to 2033
Figure 131: Eastern Europe Market Volume (Units) Analysis by Product Type, 2018 to 2033
Figure 132: Eastern Europe Market Value Share (%) and BPS Analysis by Product Type, 2023 to 2033
Figure 133: Eastern Europe Market Y-o-Y Growth (%) Projections by Product Type, 2023 to 2033
Figure 134: Eastern Europe Market Value (US$ Million) Analysis by Material, 2018 to 2033
Figure 135: Eastern Europe Market Volume (Units) Analysis by Material, 2018 to 2033
Figure 136: Eastern Europe Market Value Share (%) and BPS Analysis by Material, 2023 to 2033
Figure 137: Eastern Europe Market Y-o-Y Growth (%) Projections by Material, 2023 to 2033
Figure 138: Eastern Europe Market Value (US$ Million) Analysis by Price Range, 2018 to 2033
Figure 139: Eastern Europe Market Volume (Units) Analysis by Price Range, 2018 to 2033
Figure 140: Eastern Europe Market Value Share (%) and BPS Analysis by Price Range, 2023 to 2033
Figure 141: Eastern Europe Market Y-o-Y Growth (%) Projections by Price Range, 2023 to 2033
Figure 142: Eastern Europe Market Value (US$ Million) Analysis by Sales Channel, 2018 to 2033
Figure 143: Eastern Europe Market Volume (Units) Analysis by Sales Channel, 2018 to 2033
Figure 144: Eastern Europe Market Value Share (%) and BPS Analysis by Sales Channel, 2023 to 2033
Figure 145: Eastern Europe Market Y-o-Y Growth (%) Projections by Sales Channel, 2023 to 2033
Figure 146: Eastern Europe Market Attractiveness by Product Type, 2023 to 2033
Figure 147: Eastern Europe Market Attractiveness by Material, 2023 to 2033
Figure 148: Eastern Europe Market Attractiveness by Price Range, 2023 to 2033
Figure 149: Eastern Europe Market Attractiveness by Sales Channel, 2023 to 2033
Figure 150: Eastern Europe Market Attractiveness by Country, 2023 to 2033
Figure 151: South Asia and Pacific Market Value (US$ Million) by Product Type, 2023 to 2033
Figure 152: South Asia and Pacific Market Value (US$ Million) by Material, 2023 to 2033
Figure 153: South Asia and Pacific Market Value (US$ Million) by Price Range, 2023 to 2033
Figure 154: South Asia and Pacific Market Value (US$ Million) by Sales Channel, 2023 to 2033
Figure 155: South Asia and Pacific Market Value (US$ Million) by Country, 2023 to 2033
Figure 156: South Asia and Pacific Market Value (US$ Million) Analysis by Country, 2018 to 2033
Figure 157: South Asia and Pacific Market Volume (Units) Analysis by Country, 2018 to 2033
Figure 158: South Asia and Pacific Market Value Share (%) and BPS Analysis by Country, 2023 to 2033
Figure 159: South Asia and Pacific Market Y-o-Y Growth (%) Projections by Country, 2023 to 2033
Figure 160: South Asia and Pacific Market Value (US$ Million) Analysis by Product Type, 2018 to 2033
Figure 161: South Asia and Pacific Market Volume (Units) Analysis by Product Type, 2018 to 2033
Figure 162: South Asia and Pacific Market Value Share (%) and BPS Analysis by Product Type, 2023 to 2033
Figure 163: South Asia and Pacific Market Y-o-Y Growth (%) Projections by Product Type, 2023 to 2033
Figure 164: South Asia and Pacific Market Value (US$ Million) Analysis by Material, 2018 to 2033
Figure 165: South Asia and Pacific Market Volume (Units) Analysis by Material, 2018 to 2033
Figure 166: South Asia and Pacific Market Value Share (%) and BPS Analysis by Material, 2023 to 2033
Figure 167: South Asia and Pacific Market Y-o-Y Growth (%) Projections by Material, 2023 to 2033
Figure 168: South Asia and Pacific Market Value (US$ Million) Analysis by Price Range, 2018 to 2033
Figure 169: South Asia and Pacific Market Volume (Units) Analysis by Price Range, 2018 to 2033
Figure 170: South Asia and Pacific Market Value Share (%) and BPS Analysis by Price Range, 2023 to 2033
Figure 171: South Asia and Pacific Market Y-o-Y Growth (%) Projections by Price Range, 2023 to 2033
Figure 172: South Asia and Pacific Market Value (US$ Million) Analysis by Sales Channel, 2018 to 2033
Figure 173: South Asia and Pacific Market Volume (Units) Analysis by Sales Channel, 2018 to 2033
Figure 174: South Asia and Pacific Market Value Share (%) and BPS Analysis by Sales Channel, 2023 to 2033
Figure 175: South Asia and Pacific Market Y-o-Y Growth (%) Projections by Sales Channel, 2023 to 2033
Figure 176: South Asia and Pacific Market Attractiveness by Product Type, 2023 to 2033
Figure 177: South Asia and Pacific Market Attractiveness by Material, 2023 to 2033
Figure 178: South Asia and Pacific Market Attractiveness by Price Range, 2023 to 2033
Figure 179: South Asia and Pacific Market Attractiveness by Sales Channel, 2023 to 2033
Figure 180: South Asia and Pacific Market Attractiveness by Country, 2023 to 2033
Figure 181: East Asia Market Value (US$ Million) by Product Type, 2023 to 2033
Figure 182: East Asia Market Value (US$ Million) by Material, 2023 to 2033
Figure 183: East Asia Market Value (US$ Million) by Price Range, 2023 to 2033
Figure 184: East Asia Market Value (US$ Million) by Sales Channel, 2023 to 2033
Figure 185: East Asia Market Value (US$ Million) by Country, 2023 to 2033
Figure 186: East Asia Market Value (US$ Million) Analysis by Country, 2018 to 2033
Figure 187: East Asia Market Volume (Units) Analysis by Country, 2018 to 2033
Figure 188: East Asia Market Value Share (%) and BPS Analysis by Country, 2023 to 2033
Figure 189: East Asia Market Y-o-Y Growth (%) Projections by Country, 2023 to 2033
Figure 190: East Asia Market Value (US$ Million) Analysis by Product Type, 2018 to 2033
Figure 191: East Asia Market Volume (Units) Analysis by Product Type, 2018 to 2033
Figure 192: East Asia Market Value Share (%) and BPS Analysis by Product Type, 2023 to 2033
Figure 193: East Asia Market Y-o-Y Growth (%) Projections by Product Type, 2023 to 2033
Figure 194: East Asia Market Value (US$ Million) Analysis by Material, 2018 to 2033
Figure 195: East Asia Market Volume (Units) Analysis by Material, 2018 to 2033
Figure 196: East Asia Market Value Share (%) and BPS Analysis by Material, 2023 to 2033
Figure 197: East Asia Market Y-o-Y Growth (%) Projections by Material, 2023 to 2033
Figure 198: East Asia Market Value (US$ Million) Analysis by Price Range, 2018 to 2033
Figure 199: East Asia Market Volume (Units) Analysis by Price Range, 2018 to 2033
Figure 200: East Asia Market Value Share (%) and BPS Analysis by Price Range, 2023 to 2033
Figure 201: East Asia Market Y-o-Y Growth (%) Projections by Price Range, 2023 to 2033
Figure 202: East Asia Market Value (US$ Million) Analysis by Sales Channel, 2018 to 2033
Figure 203: East Asia Market Volume (Units) Analysis by Sales Channel, 2018 to 2033
Figure 204: East Asia Market Value Share (%) and BPS Analysis by Sales Channel, 2023 to 2033
Figure 205: East Asia Market Y-o-Y Growth (%) Projections by Sales Channel, 2023 to 2033
Figure 206: East Asia Market Attractiveness by Product Type, 2023 to 2033
Figure 207: East Asia Market Attractiveness by Material, 2023 to 2033
Figure 208: East Asia Market Attractiveness by Price Range, 2023 to 2033
Figure 209: East Asia Market Attractiveness by Sales Channel, 2023 to 2033
Figure 210: East Asia Market Attractiveness by Country, 2023 to 2033
Figure 211: Middle East and Africa Market Value (US$ Million) by Product Type, 2023 to 2033
Figure 212: Middle East and Africa Market Value (US$ Million) by Material, 2023 to 2033
Figure 213: Middle East and Africa Market Value (US$ Million) by Price Range, 2023 to 2033
Figure 214: Middle East and Africa Market Value (US$ Million) by Sales Channel, 2023 to 2033
Figure 215: Middle East and Africa Market Value (US$ Million) by Country, 2023 to 2033
Figure 216: Middle East and Africa Market Value (US$ Million) Analysis by Country, 2018 to 2033
Figure 217: Middle East and Africa Market Volume (Units) Analysis by Country, 2018 to 2033
Figure 218: Middle East and Africa Market Value Share (%) and BPS Analysis by Country, 2023 to 2033
Figure 219: Middle East and Africa Market Y-o-Y Growth (%) Projections by Country, 2023 to 2033
Figure 220: Middle East and Africa Market Value (US$ Million) Analysis by Product Type, 2018 to 2033
Figure 221: Middle East and Africa Market Volume (Units) Analysis by Product Type, 2018 to 2033
Figure 222: Middle East and Africa Market Value Share (%) and BPS Analysis by Product Type, 2023 to 2033
Figure 223: Middle East and Africa Market Y-o-Y Growth (%) Projections by Product Type, 2023 to 2033
Figure 224: Middle East and Africa Market Value (US$ Million) Analysis by Material, 2018 to 2033
Figure 225: Middle East and Africa Market Volume (Units) Analysis by Material, 2018 to 2033
Figure 226: Middle East and Africa Market Value Share (%) and BPS Analysis by Material, 2023 to 2033
Figure 227: Middle East and Africa Market Y-o-Y Growth (%) Projections by Material, 2023 to 2033
Figure 228: Middle East and Africa Market Value (US$ Million) Analysis by Price Range, 2018 to 2033
Figure 229: Middle East and Africa Market Volume (Units) Analysis by Price Range, 2018 to 2033
Figure 230: Middle East and Africa Market Value Share (%) and BPS Analysis by Price Range, 2023 to 2033
Figure 231: Middle East and Africa Market Y-o-Y Growth (%) Projections by Price Range, 2023 to 2033
Figure 232: Middle East and Africa Market Value (US$ Million) Analysis by Sales Channel, 2018 to 2033
Figure 233: Middle East and Africa Market Volume (Units) Analysis by Sales Channel, 2018 to 2033
Figure 234: Middle East and Africa Market Value Share (%) and BPS Analysis by Sales Channel, 2023 to 2033
Figure 235: Middle East and Africa Market Y-o-Y Growth (%) Projections by Sales Channel, 2023 to 2033
Figure 236: Middle East and Africa Market Attractiveness by Product Type, 2023 to 2033
Figure 237: Middle East and Africa Market Attractiveness by Material, 2023 to 2033
Figure 238: Middle East and Africa Market Attractiveness by Price Range, 2023 to 2033
Figure 239: Middle East and Africa Market Attractiveness by Sales Channel, 2023 to 2033
Figure 240: Middle East and Africa Market Attractiveness by Country, 2023 to 2033
This market is estimated to reach USD 4,313.6 million by 2033.
Penn Plax, Qian Hu, and Interpet are the key market players.
China is always leading in plastic toy manufacturing.
Live plants are the popular product type in the market.
Low-price range products are preferred by consumers.
Explore Similar Insights
Thank you!
You will receive an email from our Business Development Manager. Please be sure to check your SPAM/JUNK folder too.