Decorations and Inclusions Market Outlook and Forecast 2025 to 2035

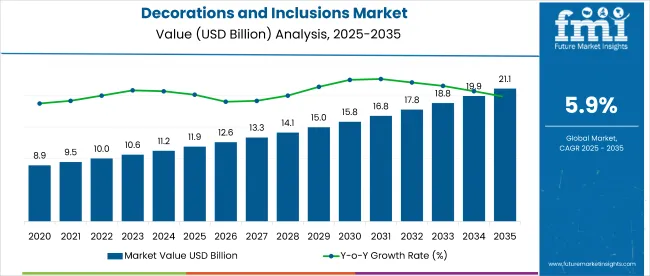
The global decorations and inclusions market is projected to grow from USD 11.9 billion in 2025 to USD 21.1 billion by 2035, registering a CAGR of 5.9%.

Quick Stats Of Decorations and Inclusions Market

  • Market Value (2025): USD 11.9 billion
  • Forecast Value (2035): USD 21.1 billion
  • Forecast CAGR: 5.9%
  • End Use Leader in 2025: Industrial Food & Beverage Processing (48% market share)
  • Top Sales Channel Segment: Indirect Sales (68% share)
  • Key Growth Region: East Asia (Japan is the fastest-growing market with a 7.1% CAGR)

Decorations And Inclusions Market

Metric Value
Industry Size (2025E) USD 11.9 billion
Industry Value (2035F) USD 21.1 billion
CAGR (2025 to 2035) 5.9%

The market expansion is being driven by increasing demand for premium and customized bakery and confectionery products. Innovations in food decoration techniques and the rise of artisanal baking trends are contributing to broader market adoption across retail, HoReCa, and industrial applications.

The market holds 48% of the global food and beverage decoration segment, reflecting its central role in visual enhancement and flavor enrichment. Within the bakery ingredients market, it accounts for nearly 27%, driven by demand for decorative toppings in pastries, cakes, and baked goods.

It contributes about 15% to the confectionery ingredients market due to widespread use in chocolates and candies. In the specialty food ingredients segment, it represents around 5%, while in the broader processed food additives market, its share is modest at nearly 1.3%, highlighting its niche yet essential function across categories.

Government regulations impacting the market focus on food safety, colorant usage, and allergen declarations. The Food Safety and Standards (Food Products Standards and Food Additives) Regulations, 2011 and the Food Safety and Standards (Labeling and Display) Regulations, 2020 in India mandate the use of approved additives and transparent labeling.

Global standards such as Codex Alimentarius and EFSA regulations also guide permissible decoration components. These frameworks are driving the adoption of clean-label and natural decorations, encouraging manufacturers to innovate with fruit- and nut-based inclusions, edible colors, and allergen-free options to ensure compliance and enhance consumer trust.

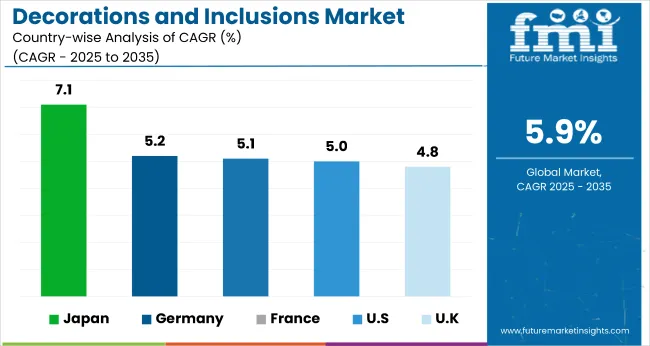
Japan is projected to be the fastest-growing market, expected to expand at a CAGR of 7.1% from 2025 to 2035. Industrial food & beverage processing will lead the end use segment with a 48% share, while indirect sales will dominate the sales channel segment with a 68% share. The USA and Germany markets are also expected to grow steadily at CAGRs of 5% and 5.2%, respectively. The UK and France are projected to expand at 4.8% and 5.1% CAGRs, respectively.

2025: Cocoa Volatility Disrupts Decorations and Inclusions Market Balance

The decorations and inclusions market in 2025 is navigating volatility due to sharp cocoa price fluctuations. A dramatic swing from late 2024 highs to mid-2025 corrections has disrupted procurement cycles and increased complexity in production planning. In response, brands are reevaluating sourcing contracts and reformulating products to stabilize cost exposure.

While cocoa remains unstable, sugar pricing is more predictable, supported by steady global output. In the USA, evolving dietary regulations and healthier eating trends are reshaping demand for conventional sweeteners and decorations.

Ingredient Volatility Reshapes Regional Demand Patterns

Fluctuations in the availability of nuts, fruits, and chocolate-based elements are creating uneven sourcing conditions across geographies. Still, the industry is adapting, and sales continue to hold strong in key product types and regions. USA bakeries and confectionery brands remain leaders, while Sweden maintains steady consumer interest in candy and decorative formats. Regional players are using agile sourcing and rapid innovation to navigate rising input costs.

Current product-level demand trends include:

  • Molded chocolate chips remaining essential to bakery and dessert production
  • Sprinkles and icing elements driving value in high-end confectionery launches
  • Fruit and nut inclusions gaining attention in health-positioned snack lines

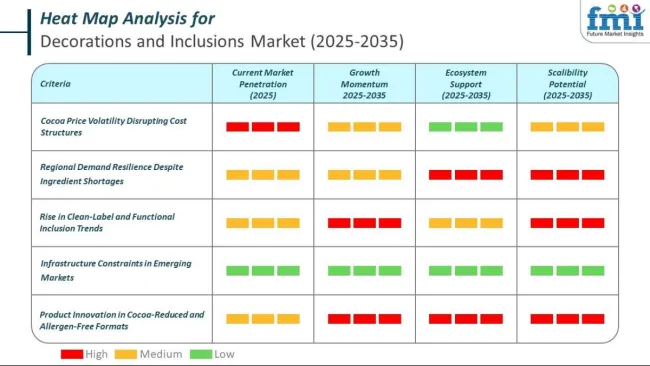
Clean-Label Innovation and Functional Ingredients Lead 2025 Product Strategy

The shift toward clean-label ingredients continues to shape product design in the decorations and inclusions market. Manufacturers are removing artificial additives, emphasizing plant-based and fortified options, and enhancing visual clarity through natural colorants. Functional coating systems are also being introduced to improve shelf life and preserve texture across storage and distribution conditions.

Innovation themes include:
  • Plant-forward and protein-rich inclusions that meet performance and wellness expectations
  • Use of natural pigments to satisfy regulatory and consumer transparency goals
  • Coating technologies that retain crispness and reduce moisture migration

Heat Map For Decorations And Inclusions Market

Decorations and Inclusions Market Analysis by Top Investment Segments

The global market is segmented by product, end use, sales channel, and region. By product, the market includes chocolate sprinkles and inclusions, chocolate shapes, chocolate cups and shells, sugar sprinkles and inclusions, sugar shapes, preserved/dried fruit pieces, sweetened/caramelised nuts, roasted nuts, baked pieces, and sugar pastes & icings.

By end use, the market covers industrial food & beverage processing (cakes, pastries, sweet biscuits, breakfast cereals, chocolate confectionery, sugar confectionery, ice cream & frozen desserts, snack bars, beverages), bakery & pastry shops, confectionery shops, restaurants & hotels, and household.

By sales channel, the market is bifurcated into direct sales and indirect sales (intermediate/bulk distributors, brick & mortar retailers, and online retailers). Regionally, the market spans North America, Latin America, Western Europe, Eastern Europe, Asia Pacific, and the Middle East & Africa.
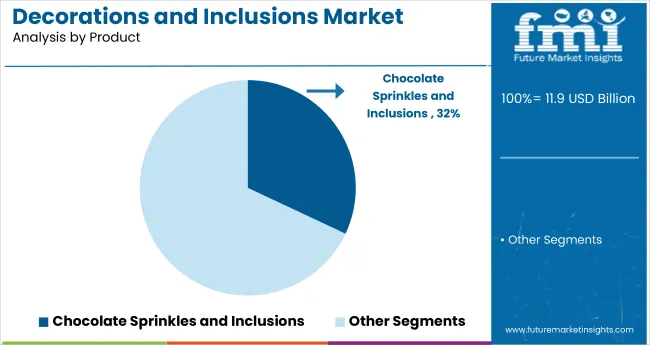
Chocolate Sprinkles and Inclusions to Lead the Product Segment with 32% Market Share

Decorations And Inclusions Market Analysis By Product

Chocolate sprinkles and inclusions are projected to lead the product type segment, capturing 32% of the global market share by 2025. They are widely used in cakes, pastries, and frozen desserts.
  • Their versatility and wide appeal across age groups make them popular among manufacturers and consumers.
  • Rising demand for premium chocolate-based toppings in both retail and foodservice drives this segment forward.

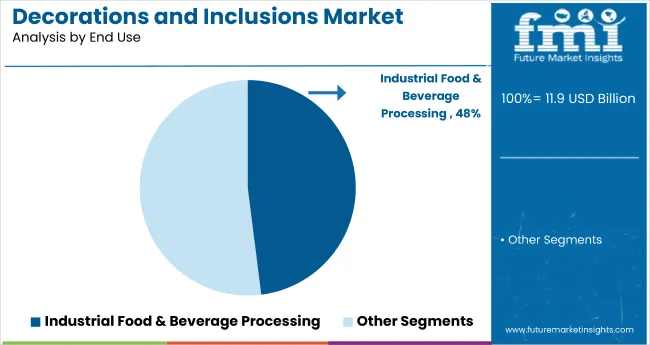
Industrial Food & Beverage Processing to Capture 48% of the End Use Segment in 2025

Decorations And Inclusions Market Analysis By End Use

Industrial food and beverage processing is projected to hold 48% of the market share by 2025, fueled by the increasing use of decorative ingredients in packaged foods, bakery products, and confectionery applications.

  • Growing demand for decorative elements in packaged food products supports this segment.
  • Innovations in texture, shape, and shelf stability of inclusions are attracting large-scale processors.

Indirect Sales to Lead the Sales Channel Segment with 68% Market Share

Indirect sales are projected to dominate the market with a 68% share in 2025, driven by the extensive reach of retailers and distributors across both consumer and industrial markets.

  • Brick-and-mortar stores and online platforms offer better product visibility and accessibility.
  • Bulk distributors enable efficient B2B transactions for large-scale food processors.

Top Decorations and Inclusions Market Dynamics

The global decorations and inclusions market is witnessing consistent growth, fueled by rising demand for visually appealing and premium-quality food products. These components enhance the texture, flavor, and visual appeal of baked goods, desserts, and confectionery, making them essential in food product innovation and consumer appeal.

Recent Trends in the Decorations and Inclusions Market
  • Growing preference for natural and clean-label inclusions, such as dried fruits and nuts, is reshaping product development in response to increasing health-conscious consumer behavior.
  • Customizable and artisanal decoration elements are gaining traction, particularly in bakery and specialty dessert segments, catering to personalization trends and premiumization.

Challenges in the Decorations and Inclusions Market

  • Volatile prices and limited availability of high-quality raw materials, such as nuts, cocoa, and specialty sugars, pose cost-related challenges for manufacturers.
  • Strict food safety and labeling regulations, especially around artificial colors, allergens, and additives, require constant innovation and compliance, increasing operational complexities.

Top Countries Manufacturing, Using, Regulating, and Generating Demand for Decorations and Inclusions

Decorations And Inclusions Market Cagr Analysis By Country

Japan decorations and inclusions market growth is propelled by a strong focus on visual presentation in confectionery, clean-label product development, and integration of traditional flavors into modern applications.

Germany and France maintain steady demand, supported by consumer interest in organic, non-artificial decorations and EU mandates promoting clean-label, allergen-free ingredients. Developed economies such as the USA (5.0% CAGR), UK (4.8%), and Japan (7.1%) are expected to expand at 0.85-1.20x of the global growth rate.

Germany follows with strong demand for organic, gluten-free, and functional inclusions supported by EU food standards. France maintains steady momentum through its artisanal bakery sector and preference for fruit- and nut-based decorations.

The United States sees rising demand for seasonal sprinkles, decorative chocolates, and in-store customization, particularly in private-label bakery items. The UK shows the slowest growth, with stable demand in hospitality and foodservice segments, despite post-Brexit challenges affecting ingredient imports and regulatory adjustments.

The report includes detailed analysis of 40+ countries; five top-performing OECD countries are highlighted below.

In-depth Analysis of Decorations and Inclusions Demand in Japan

The Japan decorations and inclusions market is projected to grow at a CAGR of 7.1% from 2025 to 2035. Growth is driven by traditional-meets-modern dessert trends and consumer preference for detailed, minimalist product presentation.

  • High demand in bakery, ice cream, and seasonal desserts.
  • Preference for natural colorants and low-sugar toppings.

Growth Outlook for Decorations and Inclusions in Germany

The decorations and inclusions revenue in Germany is expected to expand at a CAGR of 5.2% through 2035, slightly below the global average but supported by health-conscious consumer behavior and EU-wide food ingredient policies. German bakeries and confectioners emphasize functional inclusions, such as high-protein nuts and reduced-sugar coatings.

  • High market penetration in organic and natural product lines.
  • Strong compliance with EU allergen and additive standards.

Industrial Demand for Decorations and Inclusions in France

The French decorations and inclusions market is projected to grow at a CAGR of 5.1% from 2025 to 2035, closely mirroring Germany in regulatory-driven expansion. Demand is primarily from the bakery and artisanal pastry sectors, with growing use of fruit-based decorations and inclusions.

  • Fruit and nut inclusions preferred for clean-label products.
  • Growth in patisserie and premium bakery segments.

Demand Trajectory for Decorations and Inclusions in the USA

The decorations and inclusions market in the USA is forecasted to grow at a CAGR of 5% between 2025 and 2035, equivalent to 0.85x the global rate. The market is characterized by strong demand for decorative chocolate, seasonal sprinkles, and ready-to-use icing and toppings.

  • Rising demand for premium chocolate and icing decorations.
  • Innovation in decorative inclusions for snacks and frozen desserts.

Decorations and Inclusions Trends in the UK

The UK decorations and inclusions market is expected to grow at a CAGR of 4.8% from 2025 to 2035, the slowest among the leading OECD countries, at 0.81x the global pace. Post-Brexit adjustments have slowed import of certain decorative ingredients, although domestic production of sugar sprinkles, dried fruit toppings, and allergen-free decorations is growing.
  • Increased use of vegan and allergen-free toppings.
  • Steady demand from bakeries, cafés, and foodservice sectors.

Leading Decorations and Inclusions Suppliers and Manufacturers

Decorations And Inclusions Market Analysis By Company

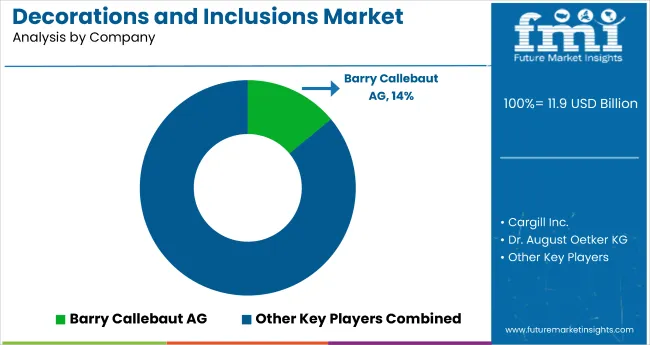
The global market is moderately competitive, with leading players such as Barry Callebaut AG, Dobla B.V., Cargill Inc., Carroll Industries NZ Limited, and Dawn Foods, Inc. dominating global production and supply. Barry Callebaut AG is renowned for its premium chocolate inclusions and sprinkles, while Dobla B.V. specializes in decorative chocolate shapes for patisserie and desserts. Cargill Inc. offers a wide range of natural ingredients and decorative solutions tailored for industrial food processing.

Carroll Industries NZ Limited focuses on fruit-based inclusions and caramelized toppings. Dawn Foods, Inc. and Delicia B.V. provide ready-to-use icings, baked decorations, and sugar shapes for bakery applications. Other key players such as Dr. August Oetker KG, HLR Praliné, ICAM S.p.a., Kanegrade Ltd, Orchard Valley Foods Ltd, Mavalerio USA Inc, Pecan Deluxe Candy Company, Ulmer Schokoladen GmbH & Co. KG, and Kerry Inc. contribute to the market by offering specialized, high-performance inclusions across bakery, confectionery, and frozen dessert applications.

Recent Decorations and Inclusions Industry News

  • In April 2025, Dawn Foods introduced a turnkey seasonal cake program in the USA, featuring three new cake mixes and two buttercreme-style icings. The program helps bakeries meet consumer demand for seasonal flavors through easy, ready-to-use, limited-time dessert offerings.

Decorations and Inclusions Market Report Scope

Report Attributes Details
Market Size (2025) USD 11.9 billion
Projected Market Size (2035) USD 21.1 billion
CAGR (2025 to 2035) 5.9%
Base Year for Estimation 2024
Historical Period 2020 to 2024
Projections Period 2025 to 2035
Report Parameter USD billion for value / volume in metric tons
Product Analyzed Chocolate Sprinkles and Inclusions, Chocolate Shapes, Chocolate Cups and Shells, Sugar Sprinkles and Inclusions, Sugar Shapes, Preserved/Dried Fruit Pieces, Sweetened/Caramelised Nuts, Roasted Nuts, Baked Pieces, Sugar Pastes & Icings
End Use Analyzed Industrial Food & Beverage Processing (Cakes, Pastries, Sweet Biscuits, Breakfast Cereals, Chocolate Confectionery, Sugar Confectionery, Ice Cream & Frozen Desserts, Snack Bars, Beverages), Bakery & Pastry Shops, Confectionery Shops, Restaurants & Hotels, Household
Sales Channel Analyzed Direct Sales, Indirect Sales (Intermediate/Bulk Distributors, Brick & Mortar Retailers, Online Retailers)
Regions Covered North America, Latin America, Western Europe, South Asia, East Asia, Eastern Europe, Middle East & Africa
Countries Covered United States, United Kingdom, Germany, France, Japan, China, India, Brazil, South Korea, Australia and 40+ countries
Key Players Influencing the Market Barry Callebaut AG, Dobla B.V., Cargill Inc., Carroll Industries NZ Limited, Dawn Foods, Inc., Delicia B.V., Dr. August Oetker KG, HLR Praliné, ICAM S.p.a., Kanegrade Ltd, Orchard Valley Foods Ltd, Mavalerio USA Inc, Pecan Deluxe Candy Company, Ulmer Schokoladen GmbH & Co. KG, Kerry Inc.
Additional Attributes Dollar sales by product type, share by end use, regional demand trends, labeling regulations, clean-label influence, competitive benchmarking

Key Segment

By Product Type:

  • Chocolate Sprinkles and Inclusions
  • Chocolate Shapes
  • Chocolate Cups and Shells
  • Sugar Sprinkles and Inclusions
  • Sugar Shapes
  • Preserved/Dried Fruit Pieces
  • Sweetened/Caramelized Nuts
  • Roasted Nuts
  • Baked Pieces
  • Sugar Pastes & Icings

By End Use:

  • Industrial/Food and Beverage Processing
    • Baked Goods
  • Cakes
  • Pastries
  • Sweet Biscuits
  • Breakfast Cereals
  • Confectioneries
  • Chocolate Confectioneries
  • Sugar Confectioneries
    • Ice Cream and Frozen Desserts
    • Snack Bars
  • Bakeries and Pastry Shops
  • Confectionery Shops
  • Restaurants and Hotels
  • Household (Retail)

By Sales Channel:

  • Direct Sales/Business-to-business
  • Indirect Sales/Business-to-consumers
  • Intermediate/Bulk Distributors
  • Brick & Mortar Retailers
  • Online Retailers

By Region:

  • North America
  • Latin America
  • Europe
  • East Asia
  • South Asia
  • Oceania
  • The Middle East and Africa

Table of Content

  1. Executive Summary
    • Global Market Outlook
    • Demand-side Trends
    • Supply-side Trends
    • Technology Roadmap Analysis
    • Analysis and Recommendations
  2. Market Overview
    • Market Coverage / Taxonomy
    • Market Definition / Scope / Limitations
  3. Market Background
    • Market Dynamics
      • Drivers
      • Restraints
      • Opportunity
      • Trends
    • Scenario Forecast
      • Demand in Optimistic Scenario
      • Demand in Likely Scenario
      • Demand in Conservative Scenario
    • Opportunity Map Analysis
    • Product Life Cycle Analysis
    • Supply Chain Analysis
      • Supply Side Participants and their Roles
        • Producers
        • Mid-Level Participants (Traders/ Agents/ Brokers)
        • Wholesalers and Distributors
      • Value Added and Value Created at Node in the Supply Chain
      • List of Raw Material Suppliers
      • List of Existing and Potential Buyer’s
    • Investment Feasibility Matrix
    • Value Chain Analysis
      • Profit Margin Analysis
      • Wholesalers and Distributors
      • Retailers
    • PESTLE and Porter’s Analysis
    • Regulatory Landscape
      • By Key Regions
      • By Key Countries
    • Regional Parent Market Outlook
    • Production and Consumption Statistics
    • Import and Export Statistics
  4. Global Market Analysis 2020 to 2024 and Forecast, 2025 to 2035
    • Historical Market Size Value (USD Billion) & Volume (Metric Tons) Analysis, 2020 to 2024
    • Current and Future Market Size Value (USD Billion) & Volume (Metric Tons) Projections, 2025 to 2035
      • Y-o-Y Growth Trend Analysis
      • Absolute $ Opportunity Analysis
  5. Global Market Pricing Analysis 2020 to 2024 and Forecast 2025 to 2035
  6. Global Market Analysis 2020 to 2024 and Forecast 2025 to 2035, By Product
    • Introduction / Key Findings
    • Historical Market Size Value (USD Billion) & Volume (Metric Tons) Analysis By Product, 2020 to 2024
    • Current and Future Market Size Value (USD Billion) & Volume (Metric Tons) Analysis and Forecast By Product, 2025 to 2035
      • Chocolate Sprinkles and Inclusions
      • Chocolate Shapes
      • Chocolate Cups and Shells
      • Sugar Sprinkles and Inclusions
      • Sugar Shapes
      • Preserved/Dried Fruit Pieces
      • Sweetened/Caramelised Nuts
      • Roasted Nuts
      • Baked Pieces
      • Sugar Pastes & Icings
    • Y-o-Y Growth Trend Analysis By Product, 2020 to 2024
    • Absolute $ Opportunity Analysis By Product, 2025 to 2035
  7. Global Market Analysis 2020 to 2024 and Forecast 2025 to 2035, By End Use
    • Introduction / Key Findings
    • Historical Market Size Value (USD Billion) & Volume (Metric Tons) Analysis By End Use, 2020 to 2024
    • Current and Future Market Size Value (USD Billion) & Volume (Metric Tons) Analysis and Forecast By End Use, 2025 to 2035
      • Industrial Food & Beverage Processing
        • Cakes
        • Pastries
        • Sweet Biscuits
        • Breakfast Cereals
        • Chocolate Confectionery
        • Sugar Confectionery
        • Ice Cream & Frozen Desserts
        • Snack Bars
        • Beverages
      • Bakery & Pastry Shops
      • Confectionery Shops
      • Restaurants & Hotels
      • Household
    • Y-o-Y Growth Trend Analysis By End Use, 2020 to 2024
    • Absolute $ Opportunity Analysis By End Use, 2025 to 2035
  8. Global Market Analysis 2020 to 2024 and Forecast 2025 to 2035, By Sales Channel
    • Introduction / Key Findings
    • Historical Market Size Value (USD Billion) & Volume (Metric Tons) Analysis By Sales Channel, 2020 to 2024
    • Current and Future Market Size Value (USD Billion) & Volume (Metric Tons) Analysis and Forecast By Sales Channel, 2025 to 2035
      • Direct Sales
      • Indirect Sales
        • Intermediate/Bulk Distributors
        • Brick & Mortar Retailers
        • Online Retailers
    • Y-o-Y Growth Trend Analysis By Sales Channel, 2020 to 2024
    • Absolute $ Opportunity Analysis By Sales Channel, 2025 to 2035
  9. Global Market Analysis 2020 to 2024 and Forecast 2025 to 2035, By Region
    • Introduction
    • Historical Market Size Value (USD Billion) & Volume (Metric Tons) Analysis By Region, 2020 to 2024
    • Current Market Size Value (USD Billion) & Volume (Metric Tons) Analysis and Forecast By Region, 2025 to 2035
      • North America
      • Latin America
      • Western Europe
      • Eastern Europe
      • East Asia
      • South Asia & Pacific
      • Middle East and Africa
    • Market Attractiveness Analysis By Region
  10. North America Market Analysis 2020 to 2024 and Forecast 2025 to 2035, By Country
    • Historical Market Size Value (USD Billion) & Volume (Metric Tons) Trend Analysis By Market Taxonomy, 2020 to 2024
    • Market Size Value (USD Billion) & Volume (Metric Tons) Forecast By Market Taxonomy, 2025 to 2035
      • By Country
        • USA
        • Canada
        • Mexico
      • By Product
      • By End Use
      • By Sales Channel
    • Market Attractiveness Analysis
      • By Country
      • By Product
      • By End Use
      • By Sales Channel
    • Key Takeaways
  11. Latin America Market Analysis 2020 to 2024 and Forecast 2025 to 2035, By Country
    • Historical Market Size Value (USD Billion) & Volume (Metric Tons) Trend Analysis By Market Taxonomy, 2020 to 2024
    • Market Size Value (USD Billion) & Volume (Metric Tons) Forecast By Market Taxonomy, 2025 to 2035
      • By Country
        • Brazil
        • Argentina
        • Rest of LATAM
      • By Product
      • By End Use
      • By Sales Channel
    • Market Attractiveness Analysis
      • By Country
      • By Product
      • By End Use
      • By Sales Channel
    • Key Takeaways
  12. Western Europe Market Analysis 2020 to 2024 and Forecast 2025 to 2035, By Country
    • Historical Market Size Value (USD Billion) & Volume (Metric Tons) Trend Analysis By Market Taxonomy, 2020 to 2024
    • Market Size Value (USD Billion) & Volume (Metric Tons) Forecast By Market Taxonomy, 2025 to 2035
      • By Country
        • Germany
        • Italy
        • France
        • UK
        • Spain
        • BENELUX
        • Nordic
        • Rest of W.Europe
      • By Product
      • By End Use
      • By Sales Channel
    • Market Attractiveness Analysis
      • By Country
      • By Product
      • By End Use
      • By Sales Channel
    • Key Takeaways
  13. Eastern Europe Market Analysis 2020 to 2024 and Forecast 2025 to 2035, By Country
    • Historical Market Size Value (USD Billion) & Volume (Metric Tons) Trend Analysis By Market Taxonomy, 2020 to 2024
    • Market Size Value (USD Billion) & Volume (Metric Tons) Forecast By Market Taxonomy, 2025 to 2035
      • By Country
        • Russia
        • Hungary
        • Poland
        • Balkan & Baltics
        • Rest of E. Europe
      • By Product
      • By End Use
      • By Sales Channel
    • Market Attractiveness Analysis
      • By Country
      • By Product
      • By End Use
      • By Sales Channel
    • Key Takeaways
  14. East Asia Market Analysis 2020 to 2024 and Forecast 2025 to 2035, By Country
    • Historical Market Size Value (USD Billion) & Volume (Metric Tons) Trend Analysis By Market Taxonomy, 2020 to 2024
    • Market Size Value (USD Billion) & Volume (Metric Tons) Forecast By Market Taxonomy, 2025 to 2035
      • By Country
        • China
        • Japan
        • South Korea
      • By Product
      • By End Use
      • By Sales Channel
    • Market Attractiveness Analysis
      • By Country
      • By Product
      • By End Use
      • By Sales Channel
    • Key Takeaways
  15. South Asia & Pacific Market Analysis 2020 to 2024 and Forecast 2025 to 2035, By Country
    • Historical Market Size Value (USD Billion) & Volume (Metric Tons) Trend Analysis By Market Taxonomy, 2020 to 2024
    • Market Size Value (USD Billion) & Volume (Metric Tons) Forecast By Market Taxonomy, 2025 to 2035
      • By Country
        • India
        • Australia & New Zealand
        • ASEAN
        • Rest of SAP
      • By Product
      • By End Use
      • By Sales Channel
    • Market Attractiveness Analysis
      • By Country
      • By Product
      • By End Use
      • By Sales Channel
    • Key Takeaways
  16. Middle East and Africa Market Analysis 2020 to 2024 and Forecast 2025 to 2035, By Country
    • Historical Market Size Value (USD Billion) & Volume (Metric Tons) Trend Analysis By Market Taxonomy, 2020 to 2024
    • Market Size Value (USD Billion) & Volume (Metric Tons) Forecast By Market Taxonomy, 2025 to 2035
      • By Country
        • GCC Countries
        • Northern Africa
        • South Africa
        • Turkiye
        • Rest of MEA
      • By Product
      • By End Use
      • By Sales Channel
    • Market Attractiveness Analysis
      • By Country
      • By Product
      • By End Use
      • By Sales Channel
    • Key Takeaways
  17. Key Countries Market Analysis
    • USA
      • Pricing Analysis
      • Market Share Analysis, 2024
        • By Product
        • By End Use
        • By Sales Channel
    • Canada
      • Pricing Analysis
      • Market Share Analysis, 2024
        • By Product
        • By End Use
        • By Sales Channel
    • Brazil
      • Pricing Analysis
      • Market Share Analysis, 2024
        • By Product
        • By End Use
        • By Sales Channel
    • Mexico
      • Pricing Analysis
      • Market Share Analysis, 2024
        • By Product
        • By End Use
        • By Sales Channel
    • Argentina
      • Pricing Analysis
      • Market Share Analysis, 2024
        • By Product
        • By End Use
        • By Sales Channel
  18. Market Structure Analysis
    • Competition Dashboard
    • Competition Benchmarking
    • Market Share Analysis of Top Players
      • By Regional
      • By Product
      • By End Use
      • By Sales Channel
  19. Competition Analysis
    • Competition Deep Dive
      • Barry Callebaut AG
        • Overview
        • Product Portfolio
        • Profitability by Market Segments (Product/Age /Sales Channel/Region)
        • Sales Footprint
        • Strategy Overview
          • Marketing Strategy
          • Product Strategy
          • Channel Strategy
      • Dobla B.V.
        • Overview
        • Product Portfolio
        • Profitability by Market Segments (Product/Age /Sales Channel/Region)
        • Sales Footprint
        • Strategy Overview
          • Marketing Strategy
          • Product Strategy
          • Channel Strategy
      • Cargill Inc.
        • Overview
        • Product Portfolio
        • Profitability by Market Segments (Product/Age /Sales Channel/Region)
        • Sales Footprint
        • Strategy Overview
          • Marketing Strategy
          • Product Strategy
          • Channel Strategy
      • Carroll Industries NZ Limited
        • Overview
        • Product Portfolio
        • Profitability by Market Segments (Product/Age /Sales Channel/Region)
        • Sales Footprint
        • Strategy Overview
          • Marketing Strategy
          • Product Strategy
          • Channel Strategy
      • Dawn Foods, Inc.
        • Overview
        • Product Portfolio
        • Profitability by Market Segments (Product/Age /Sales Channel/Region)
        • Sales Footprint
        • Strategy Overview
          • Marketing Strategy
          • Product Strategy
          • Channel Strategy
      • Delicia B.V.
        • Overview
        • Product Portfolio
        • Profitability by Market Segments (Product/Age /Sales Channel/Region)
        • Sales Footprint
        • Strategy Overview
          • Marketing Strategy
          • Product Strategy
          • Channel Strategy
      • Dr. August Oetker KG
        • Overview
        • Product Portfolio
        • Profitability by Market Segments (Product/Age /Sales Channel/Region)
        • Sales Footprint
        • Strategy Overview
          • Marketing Strategy
          • Product Strategy
          • Channel Strategy
      • HLR Praliné
        • Overview
        • Product Portfolio
        • Profitability by Market Segments (Product/Age /Sales Channel/Region)
        • Sales Footprint
        • Strategy Overview
          • Marketing Strategy
          • Product Strategy
          • Channel Strategy
      • ICAM S.p.a.
        • Overview
        • Product Portfolio
        • Profitability by Market Segments (Product/Age /Sales Channel/Region)
        • Sales Footprint
        • Strategy Overview
          • Marketing Strategy
          • Product Strategy
          • Channel Strategy
      • Kanegrade Ltd
        • Overview
        • Product Portfolio
        • Profitability by Market Segments (Product/Age /Sales Channel/Region)
        • Sales Footprint
        • Strategy Overview
          • Marketing Strategy
          • Product Strategy
          • Channel Strategy
      • Orchard Valley Foods Ltd
        • Overview
        • Product Portfolio
        • Profitability by Market Segments (Product/Age /Sales Channel/Region)
        • Sales Footprint
        • Strategy Overview
          • Marketing Strategy
          • Product Strategy
          • Channel Strategy
      • Mavalerio USA Inc
        • Overview
        • Product Portfolio
        • Profitability by Market Segments (Product/Age /Sales Channel/Region)
        • Sales Footprint
        • Strategy Overview
          • Marketing Strategy
          • Product Strategy
          • Channel Strategy
      • Pecan Deluxe Candy Company
        • Overview
        • Product Portfolio
        • Profitability by Market Segments (Product/Age /Sales Channel/Region)
        • Sales Footprint
        • Strategy Overview
          • Marketing Strategy
          • Product Strategy
          • Channel Strategy
      • Ulmer Schokoladen GmbH & Co. KG
        • Overview
        • Product Portfolio
        • Profitability by Market Segments (Product/Age /Sales Channel/Region)
        • Sales Footprint
        • Strategy Overview
          • Marketing Strategy
          • Product Strategy
          • Channel Strategy
      • Kerry Inc.
        • Overview
        • Product Portfolio
        • Profitability by Market Segments (Product/Age /Sales Channel/Region)
        • Sales Footprint
        • Strategy Overview
          • Marketing Strategy
          • Product Strategy
          • Channel Strategy
  20. Assumptions & Acronyms Used
  21. Research Methodology

List of Tables

  • Table 1: Global Market Value (USD Billion) Forecast by Region, 2020 to 2035
  • Table 2: Global Market Volume (Metric Tons) Forecast by Region, 2020 to 2035
  • Table 3: Global Market Value (USD Billion) Forecast by Product, 2020 to 2035
  • Table 4: Global Market Volume (Metric Tons) Forecast by Product, 2020 to 2035
  • Table 5: Global Market Value (USD Billion) Forecast by End Use, 2020 to 2035
  • Table 6: Global Market Volume (Metric Tons) Forecast by End Use, 2020 to 2035
  • Table 7: Global Market Value (USD Billion) Forecast by Sales Channel, 2020 to 2035
  • Table 8: Global Market Volume (Metric Tons) Forecast by Sales Channel, 2020 to 2035
  • Table 9: North America Market Value (USD Billion) Forecast by Country, 2020 to 2035
  • Table 10: North America Market Volume (Metric Tons) Forecast by Country, 2020 to 2035
  • Table 11: North America Market Value (USD Billion) Forecast by Product, 2020 to 2035
  • Table 12: North America Market Volume (Metric Tons) Forecast by Product, 2020 to 2035
  • Table 13: North America Market Value (USD Billion) Forecast by End Use, 2020 to 2035
  • Table 14: North America Market Volume (Metric Tons) Forecast by End Use, 2020 to 2035
  • Table 15: North America Market Value (USD Billion) Forecast by Sales Channel, 2020 to 2035
  • Table 16: North America Market Volume (Metric Tons) Forecast by Sales Channel, 2020 to 2035
  • Table 17: Latin America Market Value (USD Billion) Forecast by Country, 2020 to 2035
  • Table 18: Latin America Market Volume (Metric Tons) Forecast by Country, 2020 to 2035
  • Table 19: Latin America Market Value (USD Billion) Forecast by Product, 2020 to 2035
  • Table 20: Latin America Market Volume (Metric Tons) Forecast by Product, 2020 to 2035
  • Table 21: Latin America Market Value (USD Billion) Forecast by End Use, 2020 to 2035
  • Table 22: Latin America Market Volume (Metric Tons) Forecast by End Use, 2020 to 2035
  • Table 23: Latin America Market Value (USD Billion) Forecast by Sales Channel, 2020 to 2035
  • Table 24: Latin America Market Volume (Metric Tons) Forecast by Sales Channel, 2020 to 2035
  • Table 25: Western Europe Market Value (USD Billion) Forecast by Country, 2020 to 2035
  • Table 26: Western Europe Market Volume (Metric Tons) Forecast by Country, 2020 to 2035
  • Table 27: Western Europe Market Value (USD Billion) Forecast by Product, 2020 to 2035
  • Table 28: Western Europe Market Volume (Metric Tons) Forecast by Product, 2020 to 2035
  • Table 29: Western Europe Market Value (USD Billion) Forecast by End Use, 2020 to 2035
  • Table 30: Western Europe Market Volume (Metric Tons) Forecast by End Use, 2020 to 2035
  • Table 31: Western Europe Market Value (USD Billion) Forecast by Sales Channel, 2020 to 2035
  • Table 32: Western Europe Market Volume (Metric Tons) Forecast by Sales Channel, 2020 to 2035
  • Table 33: Eastern Europe Market Value (USD Billion) Forecast by Country, 2020 to 2035
  • Table 34: Eastern Europe Market Volume (Metric Tons) Forecast by Country, 2020 to 2035
  • Table 35: Eastern Europe Market Value (USD Billion) Forecast by Product, 2020 to 2035
  • Table 36: Eastern Europe Market Volume (Metric Tons) Forecast by Product, 2020 to 2035
  • Table 37: Eastern Europe Market Value (USD Billion) Forecast by End Use, 2020 to 2035
  • Table 38: Eastern Europe Market Volume (Metric Tons) Forecast by End Use, 2020 to 2035
  • Table 39: Eastern Europe Market Value (USD Billion) Forecast by Sales Channel, 2020 to 2035
  • Table 40: Eastern Europe Market Volume (Metric Tons) Forecast by Sales Channel, 2020 to 2035
  • Table 41: East Asia Market Value (USD Billion) Forecast by Country, 2020 to 2035
  • Table 42: East Asia Market Volume (Metric Tons) Forecast by Country, 2020 to 2035
  • Table 43: East Asia Market Value (USD Billion) Forecast by Product, 2020 to 2035
  • Table 44: East Asia Market Volume (Metric Tons) Forecast by Product, 2020 to 2035
  • Table 45: East Asia Market Value (USD Billion) Forecast by End Use, 2020 to 2035
  • Table 46: East Asia Market Volume (Metric Tons) Forecast by End Use, 2020 to 2035
  • Table 47: East Asia Market Value (USD Billion) Forecast by Sales Channel, 2020 to 2035
  • Table 48: East Asia Market Volume (Metric Tons) Forecast by Sales Channel, 2020 to 2035
  • Table 49: South Asia & Pacific Market Value (USD Billion) Forecast by Country, 2020 to 2035
  • Table 50: South Asia & Pacific Market Volume (Metric Tons) Forecast by Country, 2020 to 2035
  • Table 51: South Asia & Pacific Market Value (USD Billion) Forecast by Product, 2020 to 2035
  • Table 52: South Asia & Pacific Market Volume (Metric Tons) Forecast by Product, 2020 to 2035
  • Table 53: South Asia & Pacific Market Value (USD Billion) Forecast by End Use, 2020 to 2035
  • Table 54: South Asia & Pacific Market Volume (Metric Tons) Forecast by End Use, 2020 to 2035
  • Table 55: South Asia & Pacific Market Value (USD Billion) Forecast by Sales Channel, 2020 to 2035
  • Table 56: South Asia & Pacific Market Volume (Metric Tons) Forecast by Sales Channel, 2020 to 2035
  • Table 57: Middle East and Africa Market Value (USD Billion) Forecast by Country, 2020 to 2035
  • Table 58: Middle East and Africa Market Volume (Metric Tons) Forecast by Country, 2020 to 2035
  • Table 59: Middle East and Africa Market Value (USD Billion) Forecast by Product, 2020 to 2035
  • Table 60: Middle East and Africa Market Volume (Metric Tons) Forecast by Product, 2020 to 2035
  • Table 61: Middle East and Africa Market Value (USD Billion) Forecast by End Use, 2020 to 2035
  • Table 62: Middle East and Africa Market Volume (Metric Tons) Forecast by End Use, 2020 to 2035
  • Table 63: Middle East and Africa Market Value (USD Billion) Forecast by Sales Channel, 2020 to 2035
  • Table 64: Middle East and Africa Market Volume (Metric Tons) Forecast by Sales Channel, 2020 to 2035

List of Figures

  • Figure 1: Global Market Volume (Metric Tons) Forecast 2020 to 2035
  • Figure 2: Global Market Pricing Analysis
  • Figure 3: Global Market Value (USD Billion) Forecast 2020 to 2035
  • Figure 4: Global Market Value Share and BPS Analysis by Product, 2025 and 2035
  • Figure 5: Global Market Y-o-Y Growth Comparison by Product, 2025 to 2035
  • Figure 6: Global Market Attractiveness Analysis by Product
  • Figure 7: Global Market Value Share and BPS Analysis by End Use, 2025 and 2035
  • Figure 8: Global Market Y-o-Y Growth Comparison by End Use, 2025 to 2035
  • Figure 9: Global Market Attractiveness Analysis by End Use
  • Figure 10: Global Market Value Share and BPS Analysis by Sales Channel, 2025 and 2035
  • Figure 11: Global Market Y-o-Y Growth Comparison by Sales Channel, 2025 to 2035
  • Figure 12: Global Market Attractiveness Analysis by Sales Channel
  • Figure 13: Global Market Value (USD Billion) Share and BPS Analysis by Region, 2025 and 2035
  • Figure 14: Global Market Y-o-Y Growth Comparison by Region, 2025 to 2035
  • Figure 15: Global Market Attractiveness Analysis by Region
  • Figure 16: North America Market Incremental $ Opportunity, 2025 to 2035
  • Figure 17: Latin America Market Incremental $ Opportunity, 2025 to 2035
  • Figure 18: Western Europe Market Incremental $ Opportunity, 2025 to 2035
  • Figure 19: Eastern Europe Market Incremental $ Opportunity, 2025 to 2035
  • Figure 20: East Asia Market Incremental $ Opportunity, 2025 to 2035
  • Figure 21: South Asia & Pacific Market Incremental $ Opportunity, 2025 to 2035
  • Figure 22: Middle East and Africa Market Incremental $ Opportunity, 2025 to 2035
  • Figure 23: North America Market Value Share and BPS Analysis by Country, 2025 and 2035
  • Figure 24: North America Market Value Share and BPS Analysis by Product, 2025 and 2035
  • Figure 25: North America Market Y-o-Y Growth Comparison by Product, 2025 to 2035
  • Figure 26: North America Market Attractiveness Analysis by Product
  • Figure 27: North America Market Value Share and BPS Analysis by End Use, 2025 and 2035
  • Figure 28: North America Market Y-o-Y Growth Comparison by End Use, 2025 to 2035
  • Figure 29: North America Market Attractiveness Analysis by End Use
  • Figure 30: North America Market Value Share and BPS Analysis by Sales Channel, 2025 and 2035
  • Figure 31: North America Market Y-o-Y Growth Comparison by Sales Channel, 2025 to 2035
  • Figure 32: North America Market Attractiveness Analysis by Sales Channel
  • Figure 33: Latin America Market Value Share and BPS Analysis by Country, 2025 and 2035
  • Figure 34: Latin America Market Value Share and BPS Analysis by Product, 2025 and 2035
  • Figure 35: Latin America Market Y-o-Y Growth Comparison by Product, 2025 to 2035
  • Figure 36: Latin America Market Attractiveness Analysis by Product
  • Figure 37: Latin America Market Value Share and BPS Analysis by End Use, 2025 and 2035
  • Figure 38: Latin America Market Y-o-Y Growth Comparison by End Use, 2025 to 2035
  • Figure 39: Latin America Market Attractiveness Analysis by End Use
  • Figure 40: Latin America Market Value Share and BPS Analysis by Sales Channel, 2025 and 2035
  • Figure 41: Latin America Market Y-o-Y Growth Comparison by Sales Channel, 2025 to 2035
  • Figure 42: Latin America Market Attractiveness Analysis by Sales Channel
  • Figure 43: Western Europe Market Value Share and BPS Analysis by Country, 2025 and 2035
  • Figure 44: Western Europe Market Value Share and BPS Analysis by Product, 2025 and 2035
  • Figure 45: Western Europe Market Y-o-Y Growth Comparison by Product, 2025 to 2035
  • Figure 46: Western Europe Market Attractiveness Analysis by Product
  • Figure 47: Western Europe Market Value Share and BPS Analysis by End Use, 2025 and 2035
  • Figure 48: Western Europe Market Y-o-Y Growth Comparison by End Use, 2025 to 2035
  • Figure 49: Western Europe Market Attractiveness Analysis by End Use
  • Figure 50: Western Europe Market Value Share and BPS Analysis by Sales Channel, 2025 and 2035
  • Figure 51: Western Europe Market Y-o-Y Growth Comparison by Sales Channel, 2025 to 2035
  • Figure 52: Western Europe Market Attractiveness Analysis by Sales Channel
  • Figure 53: Eastern Europe Market Value Share and BPS Analysis by Country, 2025 and 2035
  • Figure 54: Eastern Europe Market Value Share and BPS Analysis by Product, 2025 and 2035
  • Figure 55: Eastern Europe Market Y-o-Y Growth Comparison by Product, 2025 to 2035
  • Figure 56: Eastern Europe Market Attractiveness Analysis by Product
  • Figure 57: Eastern Europe Market Value Share and BPS Analysis by End Use, 2025 and 2035
  • Figure 58: Eastern Europe Market Y-o-Y Growth Comparison by End Use, 2025 to 2035
  • Figure 59: Eastern Europe Market Attractiveness Analysis by End Use
  • Figure 60: Eastern Europe Market Value Share and BPS Analysis by Sales Channel, 2025 and 2035
  • Figure 61: Eastern Europe Market Y-o-Y Growth Comparison by Sales Channel, 2025 to 2035
  • Figure 62: Eastern Europe Market Attractiveness Analysis by Sales Channel
  • Figure 63: East Asia Market Value Share and BPS Analysis by Country, 2025 and 2035
  • Figure 64: East Asia Market Value Share and BPS Analysis by Product, 2025 and 2035
  • Figure 65: East Asia Market Y-o-Y Growth Comparison by Product, 2025 to 2035
  • Figure 66: East Asia Market Attractiveness Analysis by Product
  • Figure 67: East Asia Market Value Share and BPS Analysis by End Use, 2025 and 2035
  • Figure 68: East Asia Market Y-o-Y Growth Comparison by End Use, 2025 to 2035
  • Figure 69: East Asia Market Attractiveness Analysis by End Use
  • Figure 70: East Asia Market Value Share and BPS Analysis by Sales Channel, 2025 and 2035
  • Figure 71: East Asia Market Y-o-Y Growth Comparison by Sales Channel, 2025 to 2035
  • Figure 72: East Asia Market Attractiveness Analysis by Sales Channel
  • Figure 73: South Asia & Pacific Market Value Share and BPS Analysis by Country, 2025 and 2035
  • Figure 74: South Asia & Pacific Market Value Share and BPS Analysis by Product, 2025 and 2035
  • Figure 75: South Asia & Pacific Market Y-o-Y Growth Comparison by Product, 2025 to 2035
  • Figure 76: South Asia & Pacific Market Attractiveness Analysis by Product
  • Figure 77: South Asia & Pacific Market Value Share and BPS Analysis by End Use, 2025 and 2035
  • Figure 78: South Asia & Pacific Market Y-o-Y Growth Comparison by End Use, 2025 to 2035
  • Figure 79: South Asia & Pacific Market Attractiveness Analysis by End Use
  • Figure 80: South Asia & Pacific Market Value Share and BPS Analysis by Sales Channel, 2025 and 2035
  • Figure 81: South Asia & Pacific Market Y-o-Y Growth Comparison by Sales Channel, 2025 to 2035
  • Figure 82: South Asia & Pacific Market Attractiveness Analysis by Sales Channel
  • Figure 83: Middle East and Africa Market Value Share and BPS Analysis by Country, 2025 and 2035
  • Figure 84: Middle East and Africa Market Value Share and BPS Analysis by Product, 2025 and 2035
  • Figure 85: Middle East and Africa Market Y-o-Y Growth Comparison by Product, 2025 to 2035
  • Figure 86: Middle East and Africa Market Attractiveness Analysis by Product
  • Figure 87: Middle East and Africa Market Value Share and BPS Analysis by End Use, 2025 and 2035
  • Figure 88: Middle East and Africa Market Y-o-Y Growth Comparison by End Use, 2025 to 2035
  • Figure 89: Middle East and Africa Market Attractiveness Analysis by End Use
  • Figure 90: Middle East and Africa Market Value Share and BPS Analysis by Sales Channel, 2025 and 2035
  • Figure 91: Middle East and Africa Market Y-o-Y Growth Comparison by Sales Channel, 2025 to 2035
  • Figure 92: Middle East and Africa Market Attractiveness Analysis by Sales Channel
  • Figure 93: Global Market - Tier Structure Analysis
  • Figure 94: Global Market - Company Share Analysis

Frequently Asked Questions

What is the projected size of the decorations and inclusions market in 2025?

The market is valued at USD 11.9 billion in 2025.

What is the outlook on decorations and inclusions demand by 2035?

The market is forecasted to reach USD 21.1 billion by 2035, reflecting a CAGR of 5.9%.

Which segment leads the decorations and inclusions market by end use in 2025?

Industrial food & beverage processing will lead the end use segment, accounting for 48% of the global market share in 2025.

What is the top sales channel for the decorations and inclusions market in 2025?

Indirect sales will dominate the sales channel segment with a 68% share in 2025.

Which country is projected to have the fastest-growing decorations and inclusions market?

Japan is projected to grow at the fastest rate, with a CAGR of 7.1% from 2025 to 2035.

Explore Similar Insights

Future Market Insights

Decorations and Inclusions Market