Reports

- Global Locations -

Headquarters

Future Market Insights, Inc.

Christiana Corporate, 200
Continental Drive, Suite 401,
Newark, Delaware - 19713,
United States

T: +1-845-579-5705

Americas

Future Market Insights, Inc.

616 Corporate Way, Suite 2-9018,
Valley Cottage, NY 10989, United States

T: +1-347-918-3531

MEA

Future Market Insights

1602-6 Jumeirah Bay X2 Tower, Plot No: JLT-PH2-X2A,
Jumeirah Lakes Towers, Dubai,
United Arab Emirates

Europe

Future Market Insights

3rd Floor, 207 Regent Street,
W1B 3HH London
United Kingdom

T: + 44 (0) 20 8123 9659
D: +44 (0) 20 3287 4268

Asia Pacific

Future Market Insights

IndiaLand Global Tech Park, Unit UG-1, Behind Grand HighStreet, Phase 1, Hinjawadi, MH, Pune – 411057, India

Lubricant Testing Machine Market Snapshot (2022 to 2032)

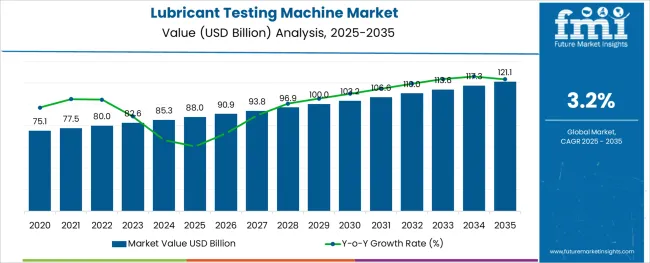
Global lubricant testing machine demand is anticipated to be valued at US$ 80 Billion in 2022, forecast to grow at a CAGR of 3.24% to be valued at US$ 110 Billion from 2022 to 2032. Growth is attributed to increased demand for lubricant testing machines from the automotive industry

Report Attribute Details
Estimated Base Year Value (2021) US$ 77.49 Billion
Expected Market Value (2022) US$ 80 Billion
Anticipated Forecast Value (2032) US$ 110 Billion
Projected Growth Rate (2022 to 2032) 3.24% CAGR

A lubricant testing machine monitors the quality of oils or lubricants used in combustion engines and other expensive machinery and systems. Lubricating oil is the lifeblood of oil-wetted machinery and is necessary for the well-being of the equipment. Lubricants are mainly used in the industrial sector for the seamless operation of machines.

They are also used in the automotive industry for smooth working and durability of engines and other components, abrasion, and lowering of heat generated through friction while maintaining the locomotion of the engine. Lubricants are available in the semi-fluid, solid states, and possess numerous features, such as low freezing point, high level of thermal stability, high viscosity index, and high boiling point all of which help to lessen friction among surfaces of machine parts and the rate of wear & tear, without negotiating operational efficiency.

To check the aforementioned properties, lubricant testing machines are used to measure these properties and indicate the actual findings. The findings from the lubricant testing machine can help the lubricant manufacturer in rectifying the lubricant quality. Lubricant testing machines are generally employed by product-grade certification and testing agencies as well as by the lubricant manufacturer’s internal product development unit.

Don't pay for what you don't need

Customize your report by selecting specific countries or regions and save 30%!

Which Factors are Contributing Towards the Growth of Lubricant Testing Machine?

The frequent technological developments in the production of automobiles and industrial machinery have intensified the need for environment-friendly lubricants, high-performance, and additives. This in turn has enabled the lubricant manufacturers to maintain product conformance standards and develop new prototypes in meeting the updated product characteristics.

The lubricant testing machine market is thus said to benefit from sales of units to the product manufacturers who have otherwise previously never endorsed regular quality tests. The lubricant testing machine is also slated to be used by end users of lubricants such as automotive, marine, aerospace, etc. which will aid their product performance.

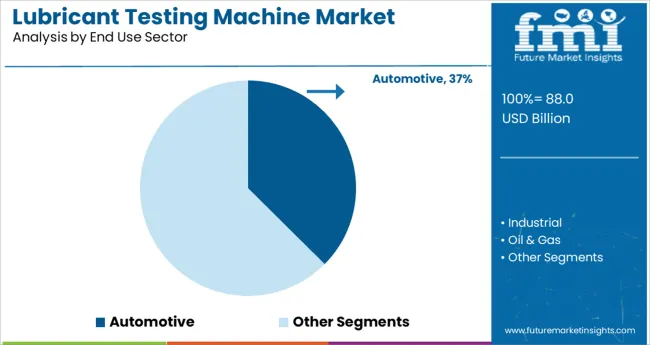
Increase in demand from end-use sectors such as automotive, oil & gas, industrial machinery, and others will spur demand for the lubricant testing machine market. Moreover, stringent regulations and guidelines related to the lubricant market will also support the demand for the lubricant testing machine market for the forecast period.

Which Factors are Restraining the Growth of Lubricant Testing Machine?

The lubricant testing machines function well for longer durations. In addition, they do not require maintenance and constant changes. This, in turn, does not contribute to more sales of the machine. These factors are restraining the growth of lubricant testing machines.

Nikhil Kaitwade
Nikhil Kaitwade

Principal Consultant

Talk to Analyst

Find your sweet spots for generating winning opportunities in this market.

Lubricant Testing Machine Market: Lubrication Quality Regulations

There are various standards and guidelines related to monitoring oil condition & lubricant testing, and assessment of the lubricants used in your machinery, engines, and other similar systems. For instance,

  • SAE (Society of Automotive Engineers): The SAE grade regulates the lubricant’s fluidity at low and high temperatures. It classifies lubricants for engines and transmissions on the basis of their thickness at a reference temperature
  • ACEA: The European Automobile Manufacturers’ Association categorizes lubricants based on their requirements and the technical specifications of each engine type. Numerous tests are performed in order to categorize lubricants into uniform categories, mainly using European driving and engines conditions
  • API: The American Petroleum Institute is an organization that signifies the natural gas and petroleum industry
  • ILSAC: The International Lubricants Standardization and Approval Committee is accountable for creating lubricant specifications for commercial cars
  • JASO: The Japanese Automotive Standards Organization (JASO) has its own standards in terms of quality and performance for Japanese engines
  • EURO Standards: The European Community standards specify maximum restricts for heavy-duty vehicle emissions

Multigrade Oils Positively Inflcuening the Demand for Lubricant Testing Machine in North America?

There has been increasing usage of multigrade lubricants in USA and Canada. Multigrade oils are ideal in this region due to their better performance in extremely cold climates. Consequently, the engine start-up process is often stuck. To check the antifreeze / anti-knocking properties, the lubricating testing machine market has witnessed significant growth in its use for the same.

Get the data you need at a Fraction of the cost

Personalize your report by choosing insights you need
and save 40%!

Automotive Industry Accelerating Sales of Lubricant Testing Machine in Europe?

The automotive industry present in Germany is a huge contributor to the sales of lubricant testing machines. The government regulations for using lubricants are escalating the use of lubricant testing machines. Thus, these factors are escalating the demand for the same. Thus, Europe is expected to register a CAGR of around 8% in the forecast period 2022 to 2032.

Market Competition

Examples of some of the market participants/vendors identified in the Lubricant Testing Machine market across the globe are Integrated Scientific Ltd, Intertek Group Plc, Amtek Spectro Scientific, Koehler Instrument Company, Inc., Wadegati Labequip Pvt. Ltd, Gianni Scavini di R. Scavini & C. snc, Bimal S.p.A, Geresco among others.

Report Scope

Report Attribute Details
Growth Rate CAGR of 3.24% from 2022 to 2032
Base Year for Estimation 2021
Historical Data 2015 to 2020
Forecast Period 2022 to 2032
Quantitative Units Revenue in USD Million and CAGR from 2022 to 2032
Report Coverage Revenue Forecast, Volume Forecast, Company Ranking, Competitive Landscape, Growth Factors, Trends, and Pricing Analysis
Segments Covered
  • End Use Sector
  • Machine
  • Region
Regions Covered
  • North America
  • Latin America
  • Western Europe
  • Eastern Europe
  • Asia-Pacific excluding Japan
  • Japan
  • Middle East and Africa
Key Countries Profiled
  • United States of America
  • Canada
  • Brazil
  • Argentina
  • Germany
  • United Kingdom
  • France
  • Spain
  • Italy
  • Nordics
  • BENELUX
  • Australia & New Zealand
  • China
  • India
  • ASEAN
  • GCC Countries
  • South Africa
Key Companies Profiled
  • Integrated Scientific Ltd.
  • Intertek Group Plc
  • Amtek Spectro Scientific
  • Koehler Instrument Company, Inc.
  • Wadegati Labequip Pvt. Ltd.
  • Gianni Scavini di R. Scavini & C. snc
  • Bimal S.p.A
  • Geresco
Customization Available Upon Request

Key Segments Profiled in the Lubricant Testing Machine Industry Survey

By End Use Sector:

  • Automotive
  • Marine
  • Industrial
  • Oil & Gas
  • Others

By Machine Type:

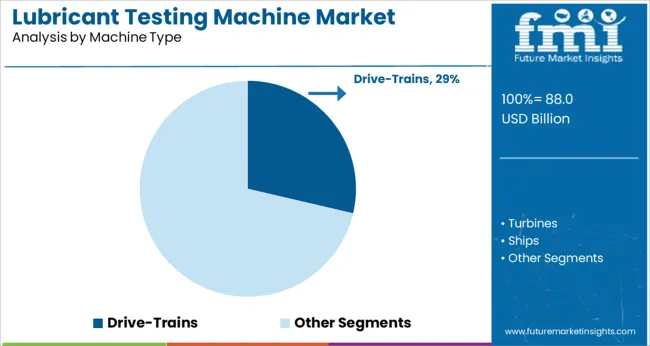
  • Drive-Trains
  • Turbines
  • Ships
  • Trains
  • Generators
  • Offshore Platforms
  • Others

By Region:

  • North America
  • Latin America
  • Western Europe
  • Eastern Europe
  • Asia-Pacific excluding Japan
  • Japan
  • Middle East and Africa


Frequently Asked Questions

What is the anticipated growth of the lubricant testing machine market until 2032?

FMI projects the global lubricant testing machine market to expand at a 3.24% value CAGR by 2032

Which region is forecast to be the most lucrative for lubricant testing machine market growth?

Asia Pacific is expected to be the most opportunistic lubricant testing machine market, expanding at an 8% CAGR

Which are some prominent lubricant testing machine manufacturers?

Integrated Scientific Ltd, Intertek Group Plc, Amtek Spectro Scientific, Koehler Instrument Company, Inc., Wadegati Labequip Pvt. Ltd, Gianni Scavini di R. Scavini & C. snc, Bimal S.p.A, and Geresco are some prominent lubricant testing machine manufacturers

Table of Content

1. Executive Summary | Lubricant Testing Machine Market

    1.1. Global Market Outlook

    1.2. Demand-side Trends

    1.3. Supply-side Trends

    1.4. Technology Roadmap Analysis

    1.5. Analysis and Recommendations

2. Market Overview

    2.1. Market Coverage / Taxonomy

    2.2. Market Definition / Scope / Limitations

3. Market Background

    3.1. Market Dynamics

        3.1.1. Drivers

        3.1.2. Restraints

        3.1.3. Opportunity

        3.1.4. Trends

    3.2. Scenario Forecast

        3.2.1. Demand in Optimistic Scenario

        3.2.2. Demand in Likely Scenario

        3.2.3. Demand in Conservative Scenario

    3.3. Opportunity Map Analysis

    3.4. Product Life Cycle Analysis

    3.5. Supply Chain Analysis

        3.5.1. Supply Side Participants and Their Roles

            3.5.1.1. Producers

            3.5.1.2. Mid-Level Participants (Traders/ Agents/ Brokers)

            3.5.1.3. Wholesalers and Distributors

        3.5.2. Value Added and Value Created at Node in the Supply Chain

        3.5.3. List of Raw Material Suppliers

        3.5.4. List of Existing and Potential Buyers

    3.6. Investment Feasibility Matrix

    3.7. Value Chain Analysis

        3.7.1. Profit Margin Analysis

        3.7.2. Wholesalers and Distributors

        3.7.3. Retailers

    3.8. PESTLE and Porter’s Analysis

    3.9. Regulatory Landscape

        3.9.1. By Key Regions

        3.9.2. By Key Countries

    3.10. Regional Parent Market Outlook

    3.11. Production and Consumption Statistics

    3.12. Import and Export Statistics

4. Global Market Analysis 2017 to 2021 and Forecast, 2022 to 2032

    4.1. Historical Market Size Value (US$ Million) & Volume (Units) Analysis, 2017 to 2021

    4.2. Current and Future Market Size Value (US$ Million) & Volume (Units) Projections, 2022 to 2032

        4.2.1. Y-o-Y Growth Trend Analysis

        4.2.2. Absolute $ Opportunity Analysis

5. Global Market Analysis 2017 to 2021 and Forecast 2022 to 2032, By Product Type

    5.1. Introduction / Key Findings

    5.2. Historical Market Size Value (US$ Million) & Volume (Units) Analysis By Product Type, 2017 to 2021

    5.3. Current and Future Market Size Value (US$ Million) & Volume (Units) Analysis and Forecast By Product Type, 2022 to 2032

        5.3.1. Flash Point Tester

        5.3.2. Viscometer

        5.3.3. Spectro Meter

        5.3.4. Particle Counter

    5.4. Y-o-Y Growth Trend Analysis By Product Type, 2017 to 2021

    5.5. Absolute $ Opportunity Analysis By Product Type, 2022 to 2032

   Deep-dive segmentation will be available in the sample on request

6. Global Market Analysis 2017 to 2021 and Forecast 2022 to 2032, By Portability

    6.1. Introduction / Key Findings

    6.2. Historical Market Size Value (US$ Million) & Volume (Units) Analysis By Portability, 2017 to 2021

    6.3. Current and Future Market Size Value (US$ Million) & Volume (Units) Analysis and Forecast By Portability, 2022 to 2032

        6.3.1. Portable

        6.3.2. Benchtop

    6.4. Y-o-Y Growth Trend Analysis By Portability, 2017 to 2021

    6.5. Absolute $ Opportunity Analysis By Portability, 2022 to 2032

   Deep-dive segmentation will be available in the sample on request

7. Global Market Analysis 2017 to 2021 and Forecast 2022 to 2032, By End Use Industry

    7.1. Introduction / Key Findings

    7.2. Historical Market Size Value (US$ Million) & Volume (Units) Analysis By End Use Industry, 2017 to 2021

    7.3. Current and Future Market Size Value (US$ Million) & Volume (Units) Analysis and Forecast By End Use Industry, 2022 to 2032

        7.3.1. Marine

        7.3.2. Railway

        7.3.3. Mining

        7.3.4. Oil & Gas

        7.3.5. Construction

        7.3.6. Manufacturing

        7.3.7. Automotive

        7.3.8. Aerospace & Aviation

        7.3.9. Research & Academics

        7.3.10. Other

    7.4. Y-o-Y Growth Trend Analysis By End Use Industry, 2017 to 2021

    7.5. Absolute $ Opportunity Analysis By End Use Industry, 2022 to 2032

   Deep-dive segmentation will be available in the sample on request

8. Global Market Analysis 2017 to 2021 and Forecast 2022 to 2032, By Region

    8.1. Introduction

    8.2. Historical Market Size Value (US$ Million) & Volume (Units) Analysis By Region, 2017 to 2021

    8.3. Current Market Size Value (US$ Million) & Volume (Units) Analysis and Forecast By Region, 2022 to 2032

        8.3.1. North America

        8.3.2. Latin America

        8.3.3. Europe

        8.3.4. East Asia

        8.3.5. South Asia & Pacific

        8.3.6. Middle East and Africa

    8.4. Market Attractiveness Analysis By Region

9. North America Market Analysis 2017 to 2021 and Forecast 2022 to 2032, By Country

    9.1. Historical Market Size Value (US$ Million) & Volume (Units) Trend Analysis By Market Taxonomy, 2017 to 2021

    9.2. Market Size Value (US$ Million) & Volume (Units) Forecast By Market Taxonomy, 2022 to 2032

        9.2.1. By Country

            9.2.1.1. United States of America

            9.2.1.2. Canada

        9.2.2. By Product Type

        9.2.3. By Portability

        9.2.4. By End Use Industry

    9.3. Market Attractiveness Analysis

        9.3.1. By Country

        9.3.2. By Product Type

        9.3.3. By Portability

        9.3.4. By End Use Industry

    9.4. Key Takeaways

10. Latin America Market Analysis 2017 to 2021 and Forecast 2022 to 2032, By Country

    10.1. Historical Market Size Value (US$ Million) & Volume (Units) Trend Analysis By Market Taxonomy, 2017 to 2021

    10.2. Market Size Value (US$ Million) & Volume (Units) Forecast By Market Taxonomy, 2022 to 2032

        10.2.1. By Country

            10.2.1.1. Brazil

            10.2.1.2. Mexico

            10.2.1.3. Rest of Latin America

        10.2.2. By Product Type

        10.2.3. By Portability

        10.2.4. By End Use Industry

    10.3. Market Attractiveness Analysis

        10.3.1. By Country

        10.3.2. By Product Type

        10.3.3. By Portability

        10.3.4. By End Use Industry

    10.4. Key Takeaways

11. Europe Market Analysis 2017 to 2021 and Forecast 2022 to 2032, By Country

    11.1. Historical Market Size Value (US$ Million) & Volume (Units) Trend Analysis By Market Taxonomy, 2017 to 2021

    11.2. Market Size Value (US$ Million) & Volume (Units) Forecast By Market Taxonomy, 2022 to 2032

        11.2.1. By Country

            11.2.1.1. Germany

            11.2.1.2. United Kingdom

            11.2.1.3. France

            11.2.1.4. Spain

            11.2.1.5. Italy

            11.2.1.6. Rest of Europe

        11.2.2. By Product Type

        11.2.3. By Portability

        11.2.4. By End Use Industry

    11.3. Market Attractiveness Analysis

        11.3.1. By Country

        11.3.2. By Product Type

        11.3.3. By Portability

        11.3.4. By End Use Industry

    11.4. Key Takeaways

12. East Asia Market Analysis 2017 to 2021 and Forecast 2022 to 2032, By Country

    12.1. Historical Market Size Value (US$ Million) & Volume (Units) Trend Analysis By Market Taxonomy, 2017 to 2021

    12.2. Market Size Value (US$ Million) & Volume (Units) Forecast By Market Taxonomy, 2022 to 2032

        12.2.1. By Country

            12.2.1.1. China

            12.2.1.2. Japan

            12.2.1.3. South Korea

        12.2.2. By Product Type

        12.2.3. By Portability

        12.2.4. By End Use Industry

    12.3. Market Attractiveness Analysis

        12.3.1. By Country

        12.3.2. By Product Type

        12.3.3. By Portability

        12.3.4. By End Use Industry

    12.4. Key Takeaways

13. South Asia & Pacific Market Analysis 2017 to 2021 and Forecast 2022 to 2032, By Country

    13.1. Historical Market Size Value (US$ Million) & Volume (Units) Trend Analysis By Market Taxonomy, 2017 to 2021

    13.2. Market Size Value (US$ Million) & Volume (Units) Forecast By Market Taxonomy, 2022 to 2032

        13.2.1. By Country

            13.2.1.1. India

            13.2.1.2. Thailand

            13.2.1.3. Indonesia

            13.2.1.4. Malaysia

            13.2.1.5. Singapore

            13.2.1.6. Australia

            13.2.1.7. New Zealand

            13.2.1.8. Rest of South Asia & Pacific

        13.2.2. By Product Type

        13.2.3. By Portability

        13.2.4. By End Use Industry

    13.3. Market Attractiveness Analysis

        13.3.1. By Country

        13.3.2. By Product Type

        13.3.3. By Portability

        13.3.4. By End Use Industry

    13.4. Key Takeaways

14. Middle East and Africa Market Analysis 2017 to 2021 and Forecast 2022 to 2032, By Country

    14.1. Historical Market Size Value (US$ Million) & Volume (Units) Trend Analysis By Market Taxonomy, 2017 to 2021

    14.2. Market Size Value (US$ Million) & Volume (Units) Forecast By Market Taxonomy, 2022 to 2032

        14.2.1. By Country

            14.2.1.1. GCC Countries

            14.2.1.2. South Africa

            14.2.1.3. Israel

            14.2.1.4. Rest of Middle East and Africa

        14.2.2. By Product Type

        14.2.3. By Portability

        14.2.4. By End Use Industry

    14.3. Market Attractiveness Analysis

        14.3.1. By Country

        14.3.2. By Product Type

        14.3.3. By Portability

        14.3.4. By End Use Industry

    14.4. Key Takeaways

15. Key Countries Market Analysis

    15.1. United States of America

        15.1.1. Pricing Analysis

        15.1.2. Market Share Analysis, 2021

            15.1.2.1. By Product Type

            15.1.2.2. By Portability

            15.1.2.3. By End Use Industry

    15.2. Canada

        15.2.1. Pricing Analysis

        15.2.2. Market Share Analysis, 2021

            15.2.2.1. By Product Type

            15.2.2.2. By Portability

            15.2.2.3. By End Use Industry

    15.3. Brazil

        15.3.1. Pricing Analysis

        15.3.2. Market Share Analysis, 2021

            15.3.2.1. By Product Type

            15.3.2.2. By Portability

            15.3.2.3. By End Use Industry

    15.4. Mexico

        15.4.1. Pricing Analysis

        15.4.2. Market Share Analysis, 2021

            15.4.2.1. By Product Type

            15.4.2.2. By Portability

            15.4.2.3. By End Use Industry

    15.5. Germany

        15.5.1. Pricing Analysis

        15.5.2. Market Share Analysis, 2021

            15.5.2.1. By Product Type

            15.5.2.2. By Portability

            15.5.2.3. By End Use Industry

    15.6. United Kingdom

        15.6.1. Pricing Analysis

        15.6.2. Market Share Analysis, 2021

            15.6.2.1. By Product Type

            15.6.2.2. By Portability

            15.6.2.3. By End Use Industry

    15.7. France

        15.7.1. Pricing Analysis

        15.7.2. Market Share Analysis, 2021

            15.7.2.1. By Product Type

            15.7.2.2. By Portability

            15.7.2.3. By End Use Industry

    15.8. Spain

        15.8.1. Pricing Analysis

        15.8.2. Market Share Analysis, 2021

            15.8.2.1. By Product Type

            15.8.2.2. By Portability

            15.8.2.3. By End Use Industry

    15.9. Italy

        15.9.1. Pricing Analysis

        15.9.2. Market Share Analysis, 2021

            15.9.2.1. By Product Type

            15.9.2.2. By Portability

            15.9.2.3. By End Use Industry

    15.10. China

        15.10.1. Pricing Analysis

        15.10.2. Market Share Analysis, 2021

            15.10.2.1. By Product Type

            15.10.2.2. By Portability

            15.10.2.3. By End Use Industry

    15.11. Japan

        15.11.1. Pricing Analysis

        15.11.2. Market Share Analysis, 2021

            15.11.2.1. By Product Type

            15.11.2.2. By Portability

            15.11.2.3. By End Use Industry

    15.12. South Korea

        15.12.1. Pricing Analysis

        15.12.2. Market Share Analysis, 2021

            15.12.2.1. By Product Type

            15.12.2.2. By Portability

            15.12.2.3. By End Use Industry

    15.13. India

        15.13.1. Pricing Analysis

        15.13.2. Market Share Analysis, 2021

            15.13.2.1. By Product Type

            15.13.2.2. By Portability

            15.13.2.3. By End Use Industry

    15.14. Thailand

        15.14.1. Pricing Analysis

        15.14.2. Market Share Analysis, 2021

            15.14.2.1. By Product Type

            15.14.2.2. By Portability

            15.14.2.3. By End Use Industry

    15.15. Indonesia

        15.15.1. Pricing Analysis

        15.15.2. Market Share Analysis, 2021

            15.15.2.1. By Product Type

            15.15.2.2. By Portability

            15.15.2.3. By End Use Industry

    15.16. Malaysia

        15.16.1. Pricing Analysis

        15.16.2. Market Share Analysis, 2021

            15.16.2.1. By Product Type

            15.16.2.2. By Portability

            15.16.2.3. By End Use Industry

    15.17. Singapore

        15.17.1. Pricing Analysis

        15.17.2. Market Share Analysis, 2021

            15.17.2.1. By Product Type

            15.17.2.2. By Portability

            15.17.2.3. By End Use Industry

    15.18. Australia

        15.18.1. Pricing Analysis

        15.18.2. Market Share Analysis, 2021

            15.18.2.1. By Product Type

            15.18.2.2. By Portability

            15.18.2.3. By End Use Industry

    15.19. New Zealand

        15.19.1. Pricing Analysis

        15.19.2. Market Share Analysis, 2021

            15.19.2.1. By Product Type

            15.19.2.2. By Portability

            15.19.2.3. By End Use Industry

    15.20. GCC Countries

        15.20.1. Pricing Analysis

        15.20.2. Market Share Analysis, 2021

            15.20.2.1. By Product Type

            15.20.2.2. By Portability

            15.20.2.3. By End Use Industry

    15.21. South Africa

        15.21.1. Pricing Analysis

        15.21.2. Market Share Analysis, 2021

            15.21.2.1. By Product Type

            15.21.2.2. By Portability

            15.21.2.3. By End Use Industry

    15.22. Israel

        15.22.1. Pricing Analysis

        15.22.2. Market Share Analysis, 2021

            15.22.2.1. By Product Type

            15.22.2.2. By Portability

            15.22.2.3. By End Use Industry

16. Market Structure Analysis

    16.1. Competition Dashboard

    16.2. Competition Benchmarking

    16.3. Market Share Analysis of Top Players

        16.3.1. By Regional

        16.3.2. By Product Type

        16.3.3. By Portability

        16.3.4. By End Use Industry

17. Competition Analysis

    17.1. Competition Deep Dive

        17.1.1. Thermo Fisher Scientific Inc.

            17.1.1.1. Overview

            17.1.1.2. Product Portfolio

            17.1.1.3. Profitability by Market Segments

            17.1.1.4. Sales Footprint

            17.1.1.5. Strategy Overview

                17.1.1.5.1. Marketing Strategy

                17.1.1.5.2. Product Strategy

                17.1.1.5.3. Channel Strategy

        17.1.2. AMETEK Spectro Scientific

            17.1.2.1. Overview

            17.1.2.2. Product Portfolio

            17.1.2.3. Profitability by Market Segments

            17.1.2.4. Sales Footprint

            17.1.2.5. Strategy Overview

                17.1.2.5.1. Marketing Strategy

                17.1.2.5.2. Product Strategy

                17.1.2.5.3. Channel Strategy

        17.1.3. Integrated Scientific Ltd

            17.1.3.1. Overview

            17.1.3.2. Product Portfolio

            17.1.3.3. Profitability by Market Segments

            17.1.3.4. Sales Footprint

            17.1.3.5. Strategy Overview

                17.1.3.5.1. Marketing Strategy

                17.1.3.5.2. Product Strategy

                17.1.3.5.3. Channel Strategy

        17.1.4. Anton Paar

            17.1.4.1. Overview

            17.1.4.2. Product Portfolio

            17.1.4.3. Profitability by Market Segments

            17.1.4.4. Sales Footprint

            17.1.4.5. Strategy Overview

                17.1.4.5.1. Marketing Strategy

                17.1.4.5.2. Product Strategy

                17.1.4.5.3. Channel Strategy

        17.1.5. eralytics

            17.1.5.1. Overview

            17.1.5.2. Product Portfolio

            17.1.5.3. Profitability by Market Segments

            17.1.5.4. Sales Footprint

            17.1.5.5. Strategy Overview

                17.1.5.5.1. Marketing Strategy

                17.1.5.5.2. Product Strategy

                17.1.5.5.3. Channel Strategy

        17.1.6. Koehler Instrument Company, INC.

            17.1.6.1. Overview

            17.1.6.2. Product Portfolio

            17.1.6.3. Profitability by Market Segments

            17.1.6.4. Sales Footprint

            17.1.6.5. Strategy Overview

                17.1.6.5.1. Marketing Strategy

                17.1.6.5.2. Product Strategy

                17.1.6.5.3. Channel Strategy

        17.1.7. Lazar Scientific, Inc.

            17.1.7.1. Overview

            17.1.7.2. Product Portfolio

            17.1.7.3. Profitability by Market Segments

            17.1.7.4. Sales Footprint

            17.1.7.5. Strategy Overview

                17.1.7.5.1. Marketing Strategy

                17.1.7.5.2. Product Strategy

                17.1.7.5.3. Channel Strategy

        17.1.8. CANNON Instrument Company

            17.1.8.1. Overview

            17.1.8.2. Product Portfolio

            17.1.8.3. Profitability by Market Segments

            17.1.8.4. Sales Footprint

            17.1.8.5. Strategy Overview

                17.1.8.5.1. Marketing Strategy

                17.1.8.5.2. Product Strategy

                17.1.8.5.3. Channel Strategy

        17.1.9. Cole-Parmer Instrument Company, LLC.

            17.1.9.1. Overview

            17.1.9.2. Product Portfolio

            17.1.9.3. Profitability by Market Segments

            17.1.9.4. Sales Footprint

            17.1.9.5. Strategy Overview

                17.1.9.5.1. Marketing Strategy

                17.1.9.5.2. Product Strategy

                17.1.9.5.3. Channel Strategy

        17.1.10. PAMAS

            17.1.10.1. Overview

            17.1.10.2. Product Portfolio

            17.1.10.3. Profitability by Market Segments

            17.1.10.4. Sales Footprint

            17.1.10.5. Strategy Overview

                17.1.10.5.1. Marketing Strategy

                17.1.10.5.2. Product Strategy

                17.1.10.5.3. Channel Strategy

        17.1.11. Beckman Coulter

            17.1.11.1. Overview

            17.1.11.2. Product Portfolio

            17.1.11.3. Profitability by Market Segments

            17.1.11.4. Sales Footprint

            17.1.11.5. Strategy Overview

                17.1.11.5.1. Marketing Strategy

                17.1.11.5.2. Product Strategy

                17.1.11.5.3. Channel Strategy

        17.1.12. Parker Hannifin Manufacturing Ltd

            17.1.12.1. Overview

            17.1.12.2. Product Portfolio

            17.1.12.3. Profitability by Market Segments

            17.1.12.4. Sales Footprint

            17.1.12.5. Strategy Overview

                17.1.12.5.1. Marketing Strategy

                17.1.12.5.2. Product Strategy

                17.1.12.5.3. Channel Strategy

        17.1.13. Dott. Gianni Scavini di R. Scavini & C. snc

            17.1.13.1. Overview

            17.1.13.2. Product Portfolio

            17.1.13.3. Profitability by Market Segments

            17.1.13.4. Sales Footprint

            17.1.13.5. Strategy Overview

                17.1.13.5.1. Marketing Strategy

                17.1.13.5.2. Product Strategy

                17.1.13.5.3. Channel Strategy

        17.1.14. Wadegati Labequip Pvt. Ltd.

            17.1.14.1. Overview

            17.1.14.2. Product Portfolio

            17.1.14.3. Profitability by Market Segments

            17.1.14.4. Sales Footprint

            17.1.14.5. Strategy Overview

                17.1.14.5.1. Marketing Strategy

                17.1.14.5.2. Product Strategy

                17.1.14.5.3. Channel Strategy

18. Assumptions & Acronyms Used

19. Research Methodology

Don't pay for what you don't need

Customize your report by selecting specific countries or regions and save 30%!

List of Tables

Table 1: Global Market Value (US$ Million) Forecast by Region, 2017 to 2032

Table 2: Global Market Volume (Units) Forecast by Region, 2017 to 2032

Table 3: Global Market Value (US$ Million) Forecast by Product Type, 2017 to 2032

Table 4: Global Market Volume (Units) Forecast by Product Type, 2017 to 2032

Table 5: Global Market Value (US$ Million) Forecast by Portability, 2017 to 2032

Table 6: Global Market Volume (Units) Forecast by Portability, 2017 to 2032

Table 7: Global Market Value (US$ Million) Forecast by End Use Industry, 2017 to 2032

Table 8: Global Market Volume (Units) Forecast by End Use Industry, 2017 to 2032

Table 9: North America Market Value (US$ Million) Forecast by Country, 2017 to 2032

Table 10: North America Market Volume (Units) Forecast by Country, 2017 to 2032

Table 11: North America Market Value (US$ Million) Forecast by Product Type, 2017 to 2032

Table 12: North America Market Volume (Units) Forecast by Product Type, 2017 to 2032

Table 13: North America Market Value (US$ Million) Forecast by Portability, 2017 to 2032

Table 14: North America Market Volume (Units) Forecast by Portability, 2017 to 2032

Table 15: North America Market Value (US$ Million) Forecast by End Use Industry, 2017 to 2032

Table 16: North America Market Volume (Units) Forecast by End Use Industry, 2017 to 2032

Table 17: Latin America Market Value (US$ Million) Forecast by Country, 2017 to 2032

Table 18: Latin America Market Volume (Units) Forecast by Country, 2017 to 2032

Table 19: Latin America Market Value (US$ Million) Forecast by Product Type, 2017 to 2032

Table 20: Latin America Market Volume (Units) Forecast by Product Type, 2017 to 2032

Table 21: Latin America Market Value (US$ Million) Forecast by Portability, 2017 to 2032

Table 22: Latin America Market Volume (Units) Forecast by Portability, 2017 to 2032

Table 23: Latin America Market Value (US$ Million) Forecast by End Use Industry, 2017 to 2032

Table 24: Latin America Market Volume (Units) Forecast by End Use Industry, 2017 to 2032

Table 25: Europe Market Value (US$ Million) Forecast by Country, 2017 to 2032

Table 26: Europe Market Volume (Units) Forecast by Country, 2017 to 2032

Table 27: Europe Market Value (US$ Million) Forecast by Product Type, 2017 to 2032

Table 28: Europe Market Volume (Units) Forecast by Product Type, 2017 to 2032

Table 29: Europe Market Value (US$ Million) Forecast by Portability, 2017 to 2032

Table 30: Europe Market Volume (Units) Forecast by Portability, 2017 to 2032

Table 31: Europe Market Value (US$ Million) Forecast by End Use Industry, 2017 to 2032

Table 32: Europe Market Volume (Units) Forecast by End Use Industry, 2017 to 2032

Table 33: East Asia Market Value (US$ Million) Forecast by Country, 2017 to 2032

Table 34: East Asia Market Volume (Units) Forecast by Country, 2017 to 2032

Table 35: East Asia Market Value (US$ Million) Forecast by Product Type, 2017 to 2032

Table 36: East Asia Market Volume (Units) Forecast by Product Type, 2017 to 2032

Table 37: East Asia Market Value (US$ Million) Forecast by Portability, 2017 to 2032

Table 38: East Asia Market Volume (Units) Forecast by Portability, 2017 to 2032

Table 39: East Asia Market Value (US$ Million) Forecast by End Use Industry, 2017 to 2032

Table 40: East Asia Market Volume (Units) Forecast by End Use Industry, 2017 to 2032

Table 41: South Asia & Pacific Market Value (US$ Million) Forecast by Country, 2017 to 2032

Table 42: South Asia & Pacific Market Volume (Units) Forecast by Country, 2017 to 2032

Table 43: South Asia & Pacific Market Value (US$ Million) Forecast by Product Type, 2017 to 2032

Table 44: South Asia & Pacific Market Volume (Units) Forecast by Product Type, 2017 to 2032

Table 45: South Asia & Pacific Market Value (US$ Million) Forecast by Portability, 2017 to 2032

Table 46: South Asia & Pacific Market Volume (Units) Forecast by Portability, 2017 to 2032

Table 47: South Asia & Pacific Market Value (US$ Million) Forecast by End Use Industry, 2017 to 2032

Table 48: South Asia & Pacific Market Volume (Units) Forecast by End Use Industry, 2017 to 2032

Table 49: Middle East and Africa Market Value (US$ Million) Forecast by Country, 2017 to 2032

Table 50: Middle East and Africa Market Volume (Units) Forecast by Country, 2017 to 2032

Table 51: Middle East and Africa Market Value (US$ Million) Forecast by Product Type, 2017 to 2032

Table 52: Middle East and Africa Market Volume (Units) Forecast by Product Type, 2017 to 2032

Table 53: Middle East and Africa Market Value (US$ Million) Forecast by Portability, 2017 to 2032

Table 54: Middle East and Africa Market Volume (Units) Forecast by Portability, 2017 to 2032

Table 55: Middle East and Africa Market Value (US$ Million) Forecast by End Use Industry, 2017 to 2032

Table 56: Middle East and Africa Market Volume (Units) Forecast by End Use Industry, 2017 to 2032
Nikhil Kaitwade
Nikhil Kaitwade

Principal Consultant

Talk to Analyst

Find your sweet spots for generating winning opportunities in this market.

List of Charts

Figure 1: Global Market Value (US$ Million) by Product Type, 2022 to 2032

Figure 2: Global Market Value (US$ Million) by Portability, 2022 to 2032

Figure 3: Global Market Value (US$ Million) by End Use Industry, 2022 to 2032

Figure 4: Global Market Value (US$ Million) by Region, 2022 to 2032

Figure 5: Global Market Value (US$ Million) Analysis by Region, 2017 to 2032

Figure 6: Global Market Volume (Units) Analysis by Region, 2017 to 2032

Figure 7: Global Market Value Share (%) and BPS Analysis by Region, 2022 to 2032

Figure 8: Global Market Y-o-Y Growth (%) Projections by Region, 2022 to 2032

Figure 9: Global Market Value (US$ Million) Analysis by Product Type, 2017 to 2032

Figure 10: Global Market Volume (Units) Analysis by Product Type, 2017 to 2032

Figure 11: Global Market Value Share (%) and BPS Analysis by Product Type, 2022 to 2032

Figure 12: Global Market Y-o-Y Growth (%) Projections by Product Type, 2022 to 2032

Figure 13: Global Market Value (US$ Million) Analysis by Portability, 2017 to 2032

Figure 14: Global Market Volume (Units) Analysis by Portability, 2017 to 2032

Figure 15: Global Market Value Share (%) and BPS Analysis by Portability, 2022 to 2032

Figure 16: Global Market Y-o-Y Growth (%) Projections by Portability, 2022 to 2032

Figure 17: Global Market Value (US$ Million) Analysis by End Use Industry, 2017 to 2032

Figure 18: Global Market Volume (Units) Analysis by End Use Industry, 2017 to 2032

Figure 19: Global Market Value Share (%) and BPS Analysis by End Use Industry, 2022 to 2032

Figure 20: Global Market Y-o-Y Growth (%) Projections by End Use Industry, 2022 to 2032

Figure 21: Global Market Attractiveness by Product Type, 2022 to 2032

Figure 22: Global Market Attractiveness by Portability, 2022 to 2032

Figure 23: Global Market Attractiveness by End Use Industry, 2022 to 2032

Figure 24: Global Market Attractiveness by Region, 2022 to 2032

Figure 25: North America Market Value (US$ Million) by Product Type, 2022 to 2032

Figure 26: North America Market Value (US$ Million) by Portability, 2022 to 2032

Figure 27: North America Market Value (US$ Million) by End Use Industry, 2022 to 2032

Figure 28: North America Market Value (US$ Million) by Country, 2022 to 2032

Figure 29: North America Market Value (US$ Million) Analysis by Country, 2017 to 2032

Figure 30: North America Market Volume (Units) Analysis by Country, 2017 to 2032

Figure 31: North America Market Value Share (%) and BPS Analysis by Country, 2022 to 2032

Figure 32: North America Market Y-o-Y Growth (%) Projections by Country, 2022 to 2032

Figure 33: North America Market Value (US$ Million) Analysis by Product Type, 2017 to 2032

Figure 34: North America Market Volume (Units) Analysis by Product Type, 2017 to 2032

Figure 35: North America Market Value Share (%) and BPS Analysis by Product Type, 2022 to 2032

Figure 36: North America Market Y-o-Y Growth (%) Projections by Product Type, 2022 to 2032

Figure 37: North America Market Value (US$ Million) Analysis by Portability, 2017 to 2032

Figure 38: North America Market Volume (Units) Analysis by Portability, 2017 to 2032

Figure 39: North America Market Value Share (%) and BPS Analysis by Portability, 2022 to 2032

Figure 40: North America Market Y-o-Y Growth (%) Projections by Portability, 2022 to 2032

Figure 41: North America Market Value (US$ Million) Analysis by End Use Industry, 2017 to 2032

Figure 42: North America Market Volume (Units) Analysis by End Use Industry, 2017 to 2032

Figure 43: North America Market Value Share (%) and BPS Analysis by End Use Industry, 2022 to 2032

Figure 44: North America Market Y-o-Y Growth (%) Projections by End Use Industry, 2022 to 2032

Figure 45: North America Market Attractiveness by Product Type, 2022 to 2032

Figure 46: North America Market Attractiveness by Portability, 2022 to 2032

Figure 47: North America Market Attractiveness by End Use Industry, 2022 to 2032

Figure 48: North America Market Attractiveness by Country, 2022 to 2032

Figure 49: Latin America Market Value (US$ Million) by Product Type, 2022 to 2032

Figure 50: Latin America Market Value (US$ Million) by Portability, 2022 to 2032

Figure 51: Latin America Market Value (US$ Million) by End Use Industry, 2022 to 2032

Figure 52: Latin America Market Value (US$ Million) by Country, 2022 to 2032

Figure 53: Latin America Market Value (US$ Million) Analysis by Country, 2017 to 2032

Figure 54: Latin America Market Volume (Units) Analysis by Country, 2017 to 2032

Figure 55: Latin America Market Value Share (%) and BPS Analysis by Country, 2022 to 2032

Figure 56: Latin America Market Y-o-Y Growth (%) Projections by Country, 2022 to 2032

Figure 57: Latin America Market Value (US$ Million) Analysis by Product Type, 2017 to 2032

Figure 58: Latin America Market Volume (Units) Analysis by Product Type, 2017 to 2032

Figure 59: Latin America Market Value Share (%) and BPS Analysis by Product Type, 2022 to 2032

Figure 60: Latin America Market Y-o-Y Growth (%) Projections by Product Type, 2022 to 2032

Figure 61: Latin America Market Value (US$ Million) Analysis by Portability, 2017 to 2032

Figure 62: Latin America Market Volume (Units) Analysis by Portability, 2017 to 2032

Figure 63: Latin America Market Value Share (%) and BPS Analysis by Portability, 2022 to 2032

Figure 64: Latin America Market Y-o-Y Growth (%) Projections by Portability, 2022 to 2032

Figure 65: Latin America Market Value (US$ Million) Analysis by End Use Industry, 2017 to 2032

Figure 66: Latin America Market Volume (Units) Analysis by End Use Industry, 2017 to 2032

Figure 67: Latin America Market Value Share (%) and BPS Analysis by End Use Industry, 2022 to 2032

Figure 68: Latin America Market Y-o-Y Growth (%) Projections by End Use Industry, 2022 to 2032

Figure 69: Latin America Market Attractiveness by Product Type, 2022 to 2032

Figure 70: Latin America Market Attractiveness by Portability, 2022 to 2032

Figure 71: Latin America Market Attractiveness by End Use Industry, 2022 to 2032

Figure 72: Latin America Market Attractiveness by Country, 2022 to 2032

Figure 73: Europe Market Value (US$ Million) by Product Type, 2022 to 2032

Figure 74: Europe Market Value (US$ Million) by Portability, 2022 to 2032

Figure 75: Europe Market Value (US$ Million) by End Use Industry, 2022 to 2032

Figure 76: Europe Market Value (US$ Million) by Country, 2022 to 2032

Figure 77: Europe Market Value (US$ Million) Analysis by Country, 2017 to 2032

Figure 78: Europe Market Volume (Units) Analysis by Country, 2017 to 2032

Figure 79: Europe Market Value Share (%) and BPS Analysis by Country, 2022 to 2032

Figure 80: Europe Market Y-o-Y Growth (%) Projections by Country, 2022 to 2032

Figure 81: Europe Market Value (US$ Million) Analysis by Product Type, 2017 to 2032

Figure 82: Europe Market Volume (Units) Analysis by Product Type, 2017 to 2032

Figure 83: Europe Market Value Share (%) and BPS Analysis by Product Type, 2022 to 2032

Figure 84: Europe Market Y-o-Y Growth (%) Projections by Product Type, 2022 to 2032

Figure 85: Europe Market Value (US$ Million) Analysis by Portability, 2017 to 2032

Figure 86: Europe Market Volume (Units) Analysis by Portability, 2017 to 2032

Figure 87: Europe Market Value Share (%) and BPS Analysis by Portability, 2022 to 2032

Figure 88: Europe Market Y-o-Y Growth (%) Projections by Portability, 2022 to 2032

Figure 89: Europe Market Value (US$ Million) Analysis by End Use Industry, 2017 to 2032

Figure 90: Europe Market Volume (Units) Analysis by End Use Industry, 2017 to 2032

Figure 91: Europe Market Value Share (%) and BPS Analysis by End Use Industry, 2022 to 2032

Figure 92: Europe Market Y-o-Y Growth (%) Projections by End Use Industry, 2022 to 2032

Figure 93: Europe Market Attractiveness by Product Type, 2022 to 2032

Figure 94: Europe Market Attractiveness by Portability, 2022 to 2032

Figure 95: Europe Market Attractiveness by End Use Industry, 2022 to 2032

Figure 96: Europe Market Attractiveness by Country, 2022 to 2032

Figure 97: East Asia Market Value (US$ Million) by Product Type, 2022 to 2032

Figure 98: East Asia Market Value (US$ Million) by Portability, 2022 to 2032

Figure 99: East Asia Market Value (US$ Million) by End Use Industry, 2022 to 2032

Figure 100: East Asia Market Value (US$ Million) by Country, 2022 to 2032

Figure 101: East Asia Market Value (US$ Million) Analysis by Country, 2017 to 2032

Figure 102: East Asia Market Volume (Units) Analysis by Country, 2017 to 2032

Figure 103: East Asia Market Value Share (%) and BPS Analysis by Country, 2022 to 2032

Figure 104: East Asia Market Y-o-Y Growth (%) Projections by Country, 2022 to 2032

Figure 105: East Asia Market Value (US$ Million) Analysis by Product Type, 2017 to 2032

Figure 106: East Asia Market Volume (Units) Analysis by Product Type, 2017 to 2032

Figure 107: East Asia Market Value Share (%) and BPS Analysis by Product Type, 2022 to 2032

Figure 108: East Asia Market Y-o-Y Growth (%) Projections by Product Type, 2022 to 2032

Figure 109: East Asia Market Value (US$ Million) Analysis by Portability, 2017 to 2032

Figure 110: East Asia Market Volume (Units) Analysis by Portability, 2017 to 2032

Figure 111: East Asia Market Value Share (%) and BPS Analysis by Portability, 2022 to 2032

Figure 112: East Asia Market Y-o-Y Growth (%) Projections by Portability, 2022 to 2032

Figure 113: East Asia Market Value (US$ Million) Analysis by End Use Industry, 2017 to 2032

Figure 114: East Asia Market Volume (Units) Analysis by End Use Industry, 2017 to 2032

Figure 115: East Asia Market Value Share (%) and BPS Analysis by End Use Industry, 2022 to 2032

Figure 116: East Asia Market Y-o-Y Growth (%) Projections by End Use Industry, 2022 to 2032

Figure 117: East Asia Market Attractiveness by Product Type, 2022 to 2032

Figure 118: East Asia Market Attractiveness by Portability, 2022 to 2032

Figure 119: East Asia Market Attractiveness by End Use Industry, 2022 to 2032

Figure 120: East Asia Market Attractiveness by Country, 2022 to 2032

Figure 121: South Asia & Pacific Market Value (US$ Million) by Product Type, 2022 to 2032

Figure 122: South Asia & Pacific Market Value (US$ Million) by Portability, 2022 to 2032

Figure 123: South Asia & Pacific Market Value (US$ Million) by End Use Industry, 2022 to 2032

Figure 124: South Asia & Pacific Market Value (US$ Million) by Country, 2022 to 2032

Figure 125: South Asia & Pacific Market Value (US$ Million) Analysis by Country, 2017 to 2032

Figure 126: South Asia & Pacific Market Volume (Units) Analysis by Country, 2017 to 2032

Figure 127: South Asia & Pacific Market Value Share (%) and BPS Analysis by Country, 2022 to 2032

Figure 128: South Asia & Pacific Market Y-o-Y Growth (%) Projections by Country, 2022 to 2032

Figure 129: South Asia & Pacific Market Value (US$ Million) Analysis by Product Type, 2017 to 2032

Figure 130: South Asia & Pacific Market Volume (Units) Analysis by Product Type, 2017 to 2032

Figure 131: South Asia & Pacific Market Value Share (%) and BPS Analysis by Product Type, 2022 to 2032

Figure 132: South Asia & Pacific Market Y-o-Y Growth (%) Projections by Product Type, 2022 to 2032

Figure 133: South Asia & Pacific Market Value (US$ Million) Analysis by Portability, 2017 to 2032

Figure 134: South Asia & Pacific Market Volume (Units) Analysis by Portability, 2017 to 2032

Figure 135: South Asia & Pacific Market Value Share (%) and BPS Analysis by Portability, 2022 to 2032

Figure 136: South Asia & Pacific Market Y-o-Y Growth (%) Projections by Portability, 2022 to 2032

Figure 137: South Asia & Pacific Market Value (US$ Million) Analysis by End Use Industry, 2017 to 2032

Figure 138: South Asia & Pacific Market Volume (Units) Analysis by End Use Industry, 2017 to 2032

Figure 139: South Asia & Pacific Market Value Share (%) and BPS Analysis by End Use Industry, 2022 to 2032

Figure 140: South Asia & Pacific Market Y-o-Y Growth (%) Projections by End Use Industry, 2022 to 2032

Figure 141: South Asia & Pacific Market Attractiveness by Product Type, 2022 to 2032

Figure 142: South Asia & Pacific Market Attractiveness by Portability, 2022 to 2032

Figure 143: South Asia & Pacific Market Attractiveness by End Use Industry, 2022 to 2032

Figure 144: South Asia & Pacific Market Attractiveness by Country, 2022 to 2032

Figure 145: Middle East and Africa Market Value (US$ Million) by Product Type, 2022 to 2032

Figure 146: Middle East and Africa Market Value (US$ Million) by Portability, 2022 to 2032

Figure 147: Middle East and Africa Market Value (US$ Million) by End Use Industry, 2022 to 2032

Figure 148: Middle East and Africa Market Value (US$ Million) by Country, 2022 to 2032

Figure 149: Middle East and Africa Market Value (US$ Million) Analysis by Country, 2017 to 2032

Figure 150: Middle East and Africa Market Volume (Units) Analysis by Country, 2017 to 2032

Figure 151: Middle East and Africa Market Value Share (%) and BPS Analysis by Country, 2022 to 2032

Figure 152: Middle East and Africa Market Y-o-Y Growth (%) Projections by Country, 2022 to 2032

Figure 153: Middle East and Africa Market Value (US$ Million) Analysis by Product Type, 2017 to 2032

Figure 154: Middle East and Africa Market Volume (Units) Analysis by Product Type, 2017 to 2032

Figure 155: Middle East and Africa Market Value Share (%) and BPS Analysis by Product Type, 2022 to 2032

Figure 156: Middle East and Africa Market Y-o-Y Growth (%) Projections by Product Type, 2022 to 2032

Figure 157: Middle East and Africa Market Value (US$ Million) Analysis by Portability, 2017 to 2032

Figure 158: Middle East and Africa Market Volume (Units) Analysis by Portability, 2017 to 2032

Figure 159: Middle East and Africa Market Value Share (%) and BPS Analysis by Portability, 2022 to 2032

Figure 160: Middle East and Africa Market Y-o-Y Growth (%) Projections by Portability, 2022 to 2032

Figure 161: Middle East and Africa Market Value (US$ Million) Analysis by End Use Industry, 2017 to 2032

Figure 162: Middle East and Africa Market Volume (Units) Analysis by End Use Industry, 2017 to 2032

Figure 163: Middle East and Africa Market Value Share (%) and BPS Analysis by End Use Industry, 2022 to 2032

Figure 164: Middle East and Africa Market Y-o-Y Growth (%) Projections by End Use Industry, 2022 to 2032

Figure 165: Middle East and Africa Market Attractiveness by Product Type, 2022 to 2032

Figure 166: Middle East and Africa Market Attractiveness by Portability, 2022 to 2032

Figure 167: Middle East and Africa Market Attractiveness by End Use Industry, 2022 to 2032

Figure 168: Middle East and Africa Market Attractiveness by Country, 2022 to 2032

Recommendations

Testing Equipment

Tire Testing Machine Market

Published : April 2021

Explore Testing Equipment Insights

View Reports

Lubricant Testing Machine Market