Lubricants / Slip Agents Market Size and Share Forecast Outlook 2025 to 2035

The Global Lubricants / Slip Agents Market is expected to record a valuation of USD 2,207.4 million in 2025 and USD 4,702.6 million in 2035, reflecting an absolute increase of USD 2,495.2 million, which equals a 2.1X growth over the decade. The overall expansion represents a CAGR of 7.9%, signaling consistent acceleration in the demand for slip-enhancing ingredients across skincare, color cosmetics, hair care, and sunscreen formulations.
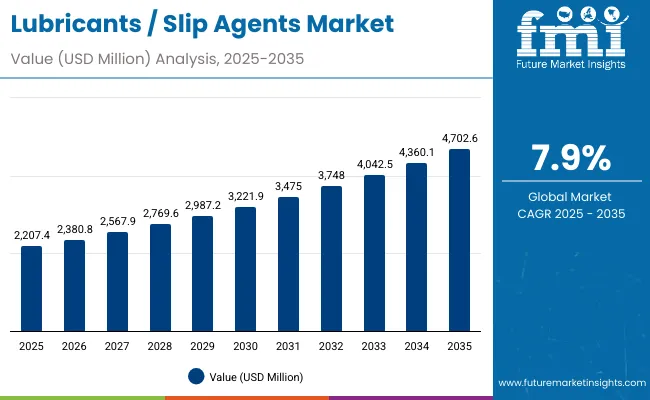
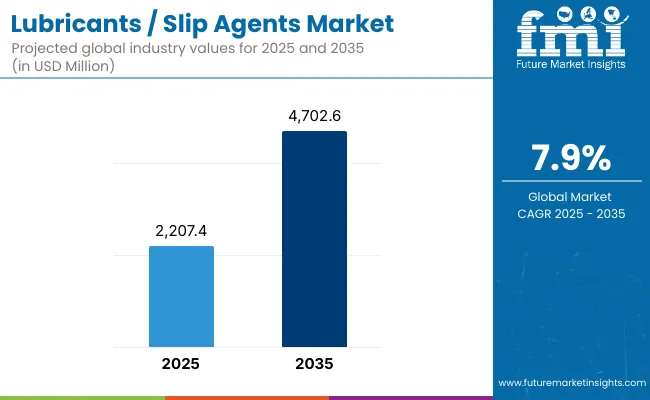
Lubricants Slip Agents Market Value Analysis

Quick Stats for Global Lubricants / Slip Agents Market

  • Global Lubricants / Slip Agents Market Value (2025): USD 2,207.4 million
  • Global Lubricants / Slip Agents Market Forecast Value (2035): USD 4,702.6 million
  • Global Lubricants / Slip Agents Market Forecast CAGR: 7.9%
  • Leading Segment in 2025: Silicone-based Chemistry (46.2%)
  • Key Growth Regions: East Asia, South Asia & Pacific, Europe, North America
  • Top Key Players: Dow, Momentive, Shin-Etsu, Wacker Chemie, Evonik, BASF, Croda, Clariant, KCC Beauty, Innospec

Lubricants Slip Agents Market

Global Lubricants / Slip Agents Market Key Takeaways

Metric Value
Global Lubricants / Slip Agents Market Estimated Value (2025E) USD 2,207.4 million
Global Lubricants / Slip Agents Market Forecast Value (2035F) USD 4,702.6 million
Forecast CAGR (2025 to 2035) 7.90%

During the first five-year period from 2025 to 2030, the market increases from USD 2,207.4 million to USD 3,221.9 million, adding USD 1,014.5 million, which accounts for 40.6% of total decade growth. This initial phase records steady adoption of silicone-based and ester-modified slip agents, driven by the growing integration of sensorial and functional additives in mass personal care and dermocosmetic formulations.

The demand for spreadability enhancers dominates during this period, supported by global brands emphasizing smooth texture, hydration balance, and light sensory feel in creams, serums, and foundations.

The second half from 2030 to 2035 contributes USD 1,480.7 million, equal to 59.4% of the total decade growth, as the market expands from USD 3,221.9 million to USD 4,702.6 million. This acceleration is powered by premium skincare and hybrid cosmetic formulations that utilize multi-functional slip agents combining film-forming, friction-reduction, and sensorial balance properties. Rapid product innovation in polyether-modified silicones and natural ester derivatives reinforces market advancement, particularly in Asia-Pacific and Europe.

Evolving consumer preferences toward lightweight, eco-conscious, and touch-optimized formulations add depth to this growth phase. Software-like customization in formulation blending and ingredient compatibility platforms are enabling manufacturers to develop tailored slip agents, enhancing recurring demand from formulators and brand R&D units.

From 2020 to 2024, the Global Lubricants / Slip Agents Market expanded from approximately USD 1,740 million to USD 2,207.4 million, largely driven by the rising penetration of silicone and hydrocarbon-based slip additives in personal care emulsions and cosmetic bases.

During this period, the competitive landscape was dominated by chemical manufacturers controlling nearly 70% of the market revenue, with leaders such as Dow, Wacker Chemie, and Shin-Etsu focusing on purity, rheological stability, and high compatibility with emulsifiers and active agents. Differentiation primarily centered around viscosity profiles, sensorial enhancement, and durability in diverse formulations, while natural ester blends began gaining acceptance in clean-label and sustainable beauty formulations. Service-linked partnerships between ingredient suppliers and beauty R&D labs remained limited, contributing less than 10% of the total market value.

By 2025, the market value for lubricants and slip agents will reach USD 2,207.4 million, and the revenue mix will begin shifting toward high-performance and multifunctional chemistries. Traditional silicone suppliers face competition from innovators focusing on renewable, polyether-modified, and bio-based systems that enhance spreadability and sensory properties without compromising sustainability.

Key suppliers such as Evonik, Croda, and Clariant are developing next-generation slip modifiers that merge hydration, film formation, and friction reduction, aligning with premium skincare and dermocosmetic trends. The competitive advantage is progressively moving away from simple silicone chemistry toward integrated sensorial engineering, environmental compliance, and hybrid formulation adaptability.

Emerging entrants, especially in East Asia, are leveraging local production and cost optimization to serve regional brands with tailored silicone-ester hybrid blends. These localized supply models, combined with global distribution networks, are reshaping pricing, availability, and formulation standards. Meanwhile, premium markets such as Japan, the U.S., and Germany are adopting multi-layer sensorial agents that improve texture transition and tactile quality, making slip agents integral to product differentiation in luxury skincare.

Why the Global Lubricants / Slip Agents Market is Growing

The market is expanding due to the increasing formulation complexity and consumer preference for superior tactile experiences in personal care and cosmetic applications. Advances in silicone-based chemistry have enabled consistent film formation, uniform pigment dispersion, and longer wear-time for color cosmetics. Moreover, improvements in polyether-modified silicones and ester blends have improved compatibility with natural oils, bioactives, and emulsifiers, resulting in enhanced product stability and feel.

The demand for spreadability enhancers and film-forming slip agents is accelerating across skincare and sun care products as manufacturers emphasize lightweight application, non-greasy texture, and smoother finish. In hair care and styling, slip agents improve combability, shine, and static control, strengthening their role in conditioner and serum formulations.

Innovation in emulsion concentrate forms and powder dispersions has expanded product versatility, while the growing adoption of biodegradable and non-volatile silicone alternatives is aligning the market with clean beauty standards. With increased focus on multi-functionality and sensorial performance, lubricants and slip agents are transitioning from supporting ingredients to core sensory-engineering components in product development pipelines.

The segment growth is strongly led by silicone-based chemistries, liquid physical forms, and spreadability enhancer functions due to their widespread use in premium skincare and dermocosmetic products. The integration of natural ester and hybrid silicone systems into formulations is expected to strengthen during 2030 to 2035, as global brands adopt eco-optimized ingredient sourcing and sustainable formulation design.

Segmental Analysis

The Global Lubricants / Slip Agents Market demonstrates a balanced yet clearly defined segmentation structure across chemistry, function, physical form, application, and end use, reflecting the evolving sensorial and formulation demands of the personal care industry. Silicone-based agents dominate with a 46.2% share in 2025, driven by their superior spreading, film-forming, and tactile enhancement properties, making them indispensable in skincare and color cosmetic formulations.

Within the function segment, spreadability enhancers lead with 42.7% share, owing to their role in improving texture uniformity, application smoothness, and product stability. The liquid form segment accounts for 55.2% of the market, benefiting from its high compatibility with emulsions, oils, and actives, which ensures efficient formulation performance and sensory refinement.

In terms of application, skin creams, lotions, and color cosmetics collectively generate the majority of consumption, supported by the growing premiumization of beauty and dermocosmetic products. End-use segmentation further highlights that while mass personal care continues to anchor volume, premium skincare and dermocosmetic categories are gaining rapid momentum as consumers seek multi-functional, non-greasy, and texture-optimized formulations.

Regionally, East Asia and South Asia & Pacific are emerging as the fastest-growing markets, led by robust manufacturing ecosystems and surging local brand innovation, while Europe and North America remain strongholds for high-performance, regulatory-compliant, and sensorially differentiated slip agents.
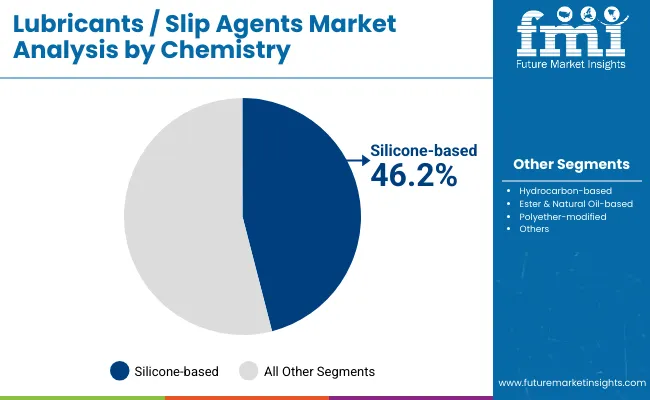
Insights into the Chemistry Segment with Silicone-Based Agents Leading in Market Share

Lubricants Slip Agents Market By Chemistry

Chemistry Value Share % 2025
Silicone-based 46.2%
Others 53.8%

The silicone-based segment is projected to contribute 46.2% of the Global Lubricants / Slip Agents Market revenue in 2025, maintaining its position as the dominant chemistry category throughout the forecast period. This dominance is driven by the superior spreading efficiency, smooth texture, and compatibility that silicone-based slip agents offer across personal care and cosmetic formulations. These chemistries enhance tactile properties and film formation, improving the application feel and finish of skincare, color cosmetic, and sunscreen products.

Silicone-based slip agents continue to be preferred due to their low surface tension, volatility control, and durable sensory attributes, which allow formulators to create lightweight and long-lasting products. The segment’s growth is also supported by the ongoing innovation in polyether-modified silicones, which provide the dual benefits of hydrophilicity and enhanced dispersion of actives in emulsions. As sustainable beauty trends evolve, manufacturers are developing biodegradable and low-cyclic silicone variants, ensuring regulatory compliance and broadening end-user adoption.

The silicone-based chemistry segment is expected to retain its leadership in the global market as the core functional backbone of next-generation slip systems. While ester and natural oil-based agents are gaining traction, silicone-based chemistries will remain indispensable for premium sensorial performance and formulation stability across both mass and dermocosmetic categories.
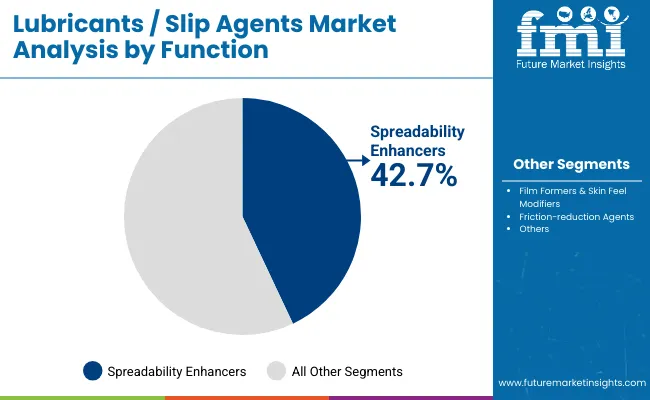
Insights into the Function Segment with Spreadability Enhancers Dominating the Demand

Lubricants Slip Agents Market By Function

Function Value Share % 2025
Spreadability enhancers 42.7%
Others 57.3%

The spreadability enhancer segment is forecasted to hold 42.7% of the Global Lubricants / Slip Agents Market in 2025, driven by its vital role in ensuring uniform application, even coverage, and superior sensory finish across cosmetic and skincare formulations. These agents facilitate effortless glide and uniform product layering, improving the user experience while optimizing the delivery of active ingredients.

Their adoption is particularly high in skin creams, color cosmetics, and sunscreen formulations, where the demand for light and silky touch textures continues to rise. The ability of spreadability enhancers to balance viscosity, oil phase compatibility, and non-greasy sensory effects has made them essential in high-performance formulations. Rapid innovation in silicone-ester hybrids and polyether-modified agents has further enhanced spreading efficiency while meeting regulatory and clean-beauty standards.

The segment’s expansion is reinforced by the growing use of multifunctional slip systems that combine spreading, film formation, and sensory enhancement in a single ingredient. With premium beauty brands prioritizing texture differentiation as a key marketing driver, spreadability enhancers will continue to dominate as the functional cornerstone of the global market, particularly in Asia-Pacific and Europe where sensorial appeal is a major purchase factor.
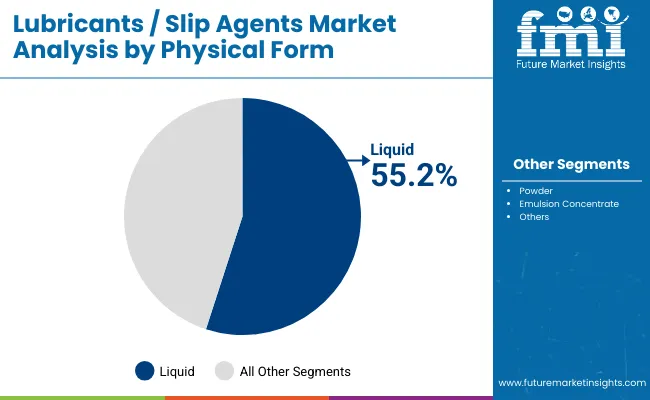
Insights into the Physical Form Segment with Liquid Agents Leading in Market Share

Lubricants Slip Agents Market By Physical Form

Physical Form Value Share % 2025
Liquid 55.2%
Others 44.8%

The liquid form segment is projected to contribute 55.2% of the Global Lubricants / Slip Agents Market revenue in 2025, maintaining its lead as the most widely adopted form across both skincare and haircare applications. This dominance is attributed to the ease of formulation, homogeneous blending, and high solubility of liquid slip agents in diverse oil and emulsion systems.

Liquid slip agents are favored for their consistency and process adaptability, making them suitable for large-scale manufacturing and small-batch formulations alike. They enhance compatibility with other actives, pigments, and emulsifiers, enabling smoother, stable end products. As brands increasingly focus on texture refinement and feel optimization, liquid slip agents have become indispensable in premium skincare serums, conditioning formulations, and high-spread foundation systems.

The growth of this segment is also fueled by technological advances in liquid silicone derivatives and bio-based ester blends, which improve viscosity control and provide enhanced skin conditioning effects. As the market transitions toward eco-responsible and multifunctional liquid systems, their role in formulation design and performance consistency will remain central. The liquid form segment will continue to act as the foundation of sensorial engineering, ensuring stable emulsions, soft-touch feel, and prolonged wearability in both mass and luxury personal care markets.

What are the Drivers, Restraints, and Key Trends of the Global Lubricants / Slip Agents Market?

Drivers

Shift Toward Sensorial Optimization and Multi-Functional Formulation Design

A key driver for the Global Lubricants / Slip Agents Market is the accelerating shift among personal care and cosmetic formulators toward sensorial optimization and multi-functional product design. Slip agents are no longer viewed as secondary ingredients but as core sensorial engineering components that define product touch, glide, and finish. Brands are investing in slip systems that combine spreadability, friction reduction, and film-forming performance in a single solution.

This is particularly evident in premium skincare and hybrid makeup products, where consumers expect seamless absorption, matte yet soft finishes, and compatibility with bioactive complexes. The demand for polyether-modified and silicone-ester hybrid chemistries is rising as formulators look for greater formulation flexibility and active delivery efficiency. By enabling smoother sensory transitions and stable emulsification, these multi-role slip agents are now essential to texture differentiation strategies across both mass and dermocosmetic lines.

Expansion of Silicone Innovation in Asia-Pacific and the Rise of Localized Manufacturing Hubs

A second major growth driver is the rapid localization of silicone-based ingredient manufacturing in East Asia and South Asia, which is fundamentally reshaping supply chain economics and adoption patterns. Previously dominated by European and USA suppliers, the silicone derivatives space is witnessing strategic expansions by Shin-Etsu, KCC Beauty, and Wacker Chemie, along with growing regional capacity additions in China and India.

Localized production reduces import dependency, improves lead times, and enables cost-efficient adaptation of slip agents to local formulation needs, such as heat and humidity resistance or fast-absorbing textures preferred in tropical climates.

This regional innovation dynamic is also driving collaborations between global players and Asian cosmetic brands to co-develop region-specific slip systems, aligning with both performance and sustainability goals.

Restraints

Regulatory Scrutiny and Phase-Out of Volatile Silicones (D4, D5, D6)

The most significant restraint for the market stems from tightening regulatory frameworks on volatile cyclic silicones (D4, D5, and D6) across Europe, North America, and selective Asian markets. These materials, widely used for their superior spreadability and dry-touch sensory feel, are under restriction due to their potential environmental persistence and bioaccumulation risks.

Regulatory agencies such as the European Chemicals Agency (ECHA) and USA EPA are enforcing limits and mandatory labelling for certain silicone categories, compelling manufacturers to reformulate using compliant, low-volatile, or biodegradable alternatives.

While this transition fosters innovation in polyether-modified and natural ester systems, it also imposes R&D costs, certification delays, and supply chain adjustments, temporarily affecting market growth and consistency across regions.

Raw Material Price Volatility and Limited Feedstock Diversification

Another key restraint arises from fluctuations in raw material pricing, particularly for silicone monomers, synthetic esters, and petroleum-based hydrocarbons. Dependence on petrochemical feedstocks and the absence of large-scale natural oil-based alternatives expose producers to cost volatility and margin pressures.

The limited diversification of raw material sources, especially for high-purity silicones, constrains small and mid-sized producers that rely on external suppliers. Additionally, the complex synthesis and purification processes for cosmetic-grade slip agents often require precision-controlled environments, further elevating operational costs.

The result is a growing price-performance imbalance, especially in cost-sensitive markets where mass personal care formulations dominate, slowing adoption of premium slip systems in emerging economies.

Key Trends

Emergence of Bio-Based and Hybrid Silicone Alternatives in Clean Beauty Formulations

A defining trend shaping the market is the rise of bio-based and hybrid silicone alternatives that align with the clean beauty movement. As brands aim for sustainability without sacrificing sensorial appeal, ingredient innovators are introducing esterified silicones, natural oil-modified slip agents, and sugar-derived emollient systems that replicate the tactile smoothness and volatility profile of traditional silicones.

Companies like Evonik, Croda, and Clariant are actively expanding their “green silicone” portfolios that combine the performance of dimethicones with the biodegradability of natural esters. These innovations cater to premium and dermocosmetic categories, especially in Europe and Japan, where regulatory compliance and environmental messaging have become strong consumer purchase drivers. Over 2025 to 2035, hybrid slip agents will form the foundation of next-generation sensorial frameworks in skincare and sun care applications.

Digitalization of Formulation and Ingredient Performance Mapping

Another transformative trend is the digitalization of formulation processes, where AI-driven simulation tools and cloud-based ingredient databases are enabling precise slip agent selection and performance mapping. Major players such as Dow and BASF are integrating digital formulation platforms that allow real-time prediction of sensory outcomes (spread rate, tactile finish, film uniformity) based on slip agent combinations.

This technology-led approach shortens R&D cycles and promotes rapid customization of product texture according to demographic and climatic factors. The convergence of digital chemistry, machine learning, and data-driven sensory evaluation is expected to revolutionize how slip agents are formulated, tested, and scaled.

As brands increasingly focus on consumer sensory profiling and regional texture preferences, digital-enabled formulation ecosystems will become a critical differentiator across the global lubricants and slip agents market.
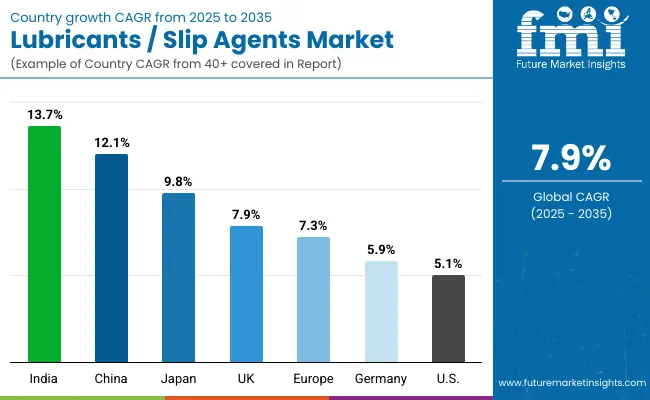
Analysis of Global Lubricants / Slip Agents MarketBy Key Countries

Lubricants Slip Agents Market Country Wise Analysis

Country Estimated CAGR (2025 to 2035)
China 12.1%
USA 5.1%
India 13.7%
UK 7.9%
Germany 5.9%
Japan 9.8%
Europe 7.3%

The Global Lubricants / Slip Agents Market shows a distinct regional performance pattern, with Asia-Pacific emerging as the fastest-growing hub for production, innovation, and consumption between 2025 and 2035. India (13.7% CAGR) and China (12.1% CAGR) lead global expansion, driven by rapid growth in personal care manufacturing, rising domestic brand activity, and increasing consumer preference for high-performance skincare and cosmetic textures. India’s growth is supported by an expanding local formulation base and higher inclusion of silicone and ester-modified slip agents in affordable beauty products.

In China, the surge is linked to aggressive capacity expansions by silicone producers and partnerships between global suppliers and domestic formulators developing multifunctional sensorial ingredients for hybrid beauty and sun care. Japan (9.8% CAGR) also contributes strongly due to continuous technological advancements in polyether-modified silicones and its influence on tactile formulation standards adopted across East Asia. Collectively, the Asian region is becoming the key global innovation center for clean, lightweight, and humidity-adapted slip agents, balancing both functional and regulatory needs.

In contrast, mature markets in North America and Europe exhibit moderate yet stable growth trajectories. The USA market (5.1% CAGR) is characterized by steady demand for premium silicone systems used in dermocosmetic and hybrid skincare formulations, supported by leading players like Dow and Momentive focusing on advanced sensorial chemistries and digital formulation tools.

In Europe, where the average CAGR stands at 7.3%, growth is reinforced by the regulatory-driven shift toward biodegradable and low-volatile silicone alternatives. Germany (5.9% CAGR) and the U.K. (7.9% CAGR) continue to serve as hubs for R&D and sustainable formulation development, leveraging strong cosmetic innovation ecosystems and environmentally conscious consumer bases.

European markets, while slower in volume growth compared to Asia, are steering the global transition toward eco-compliant slip systems and driving collaboration between chemical suppliers and luxury cosmetic brands to redefine next-generation sensorial benchmarks.
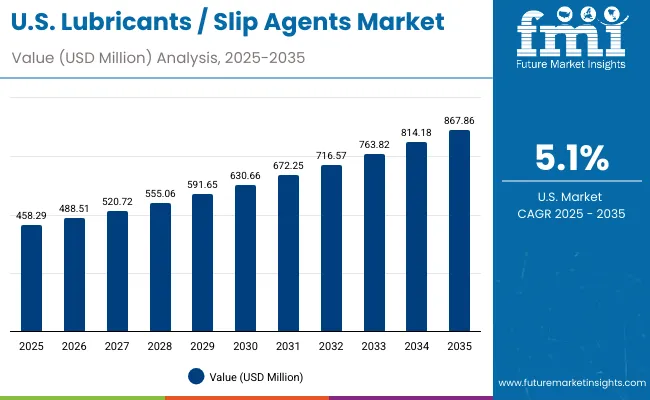
Sales Outlook for Lubricants / Slip Agents Market in the United States

Usa Lubricants Slip Agents Market

Year USA Lubricants / Slip Agents Market (USD Million)
2025 458.29
2026 488.51
2027 520.72
2028 555.06
2029 591.65
2030 630.66
2031 672.25
2032 716.57
2033 763.82
2034 814.18
2035 867.86

The Global Lubricants / Slip Agents Market in the United States is projected to grow at a CAGR of 5.1% from 2025 to 2035, driven by sustained demand across premium skincare, hybrid cosmetics, and advanced hair care formulations. The USA remains a hub for formulation innovation, where chemical suppliers and beauty brands increasingly collaborate to co-develop next-generation sensorial systems.

Growth is led by the expansion of silicone-based and polyether-modified slip agents, which continue to dominate due to their ability to enhance spreadability, tactile balance, and film uniformity in high-performance products. The dermocosmetic and hybrid skincare categories-bridging pharmaceutical-grade efficacy with consumer sensory appeal-have emerged as major consumers of these agents.

Increasing investments by players such as Dow, Momentive, and Wacker Chemie in advanced emulsion technologies and clean-silicone formulations are supporting strong domestic adoption. In addition, the rising consumer preference for multifunctional beauty and sustainable sensorial solutions is pushing formulators to design slip systems that balance biodegradability with high-performance smoothness and texture delivery.

  • Premium skincare brands are integrating silicone-ester hybrid systems for improved sensory feel.
  • Local R&D centers are focusing on low-volatile, sustainable silicone alternatives for compliance.
  • Hybrid slip systems combining film-forming and spreadability functions are gaining commercial scale.

Growth and Expansion Outlook for Lubricants / Slip Agents Market in the United Kingdom

The Global Lubricants / Slip Agents Market in the United Kingdom is forecasted to grow at a CAGR of 7.9% during 2025 to 2035, supported by the nation’s strong innovation ecosystem in cosmetic chemistry and clean beauty formulation. The U.K. market benefits from advanced formulation capabilities, well-developed testing infrastructure, and growing partnerships between ingredient suppliers and luxury skincare brands. Slip agents are increasingly being tailored for eco-certified and hybrid cosmetic formulations, combining high sensorial performance with environmental compliance.

Ester and natural oil-based lubricants are gaining momentum due to strong consumer inclination toward biodegradable and plant-derived ingredients. Moreover, the country’s leading beauty labs and contract manufacturers are expanding the use of polyether-modified silicones that deliver ultra-smooth application and improve active dispersion. The regulatory emphasis on volatile silicone restriction (D4/D5) has accelerated the adoption of innovative non-volatile systems. The integration of digital formulation tools and sensorial analytics by U.K. formulators is also supporting the optimization of slip and texture balance for climate-adapted, premium products.

  • Luxury skincare brands are driving demand for sustainable ester-based slip systems.
  • Regulatory compliance and eco-certification are reshaping silicone selection strategies.
  • AI-assisted formulation tools are improving tactile optimization and product differentiation.

Growth and Expansion Outlook for Lubricants / Slip Agents Market in India

India is witnessing rapid growth in the Global Lubricants / Slip Agents Market, which is expected to expand at a CAGR of 13.7% through 2035, the highest globally. The surge is primarily driven by the localization of personal care manufacturing, the rise of indigenous cosmetic brands, and increasing adoption of sensorially advanced yet cost-efficient formulations.

Domestic manufacturers are increasingly incorporating silicone-based and ester-derived slip agents into skincare, sunscreen, and hair styling products to achieve premium feel without increasing formulation costs. Tier-2 and tier-3 cities are contributing significantly, with MSME producers adopting pre-formulated emulsion concentrates that improve spreadability and product texture.

Additionally, Indian R&D labs are investing in natural ester and oil-derived slip systems aligned with Ayurveda-inspired clean beauty trends. The government’s “Make in India” initiative and tariff reductions on silicone intermediates are further supporting local production and downstream formulation innovation.

  • Local personal care brands are adopting silicone-ester blends to elevate texture quality.
  • MSMEs are using emulsion concentrates for affordable, sensorially rich formulations.
  • Natural ester slip systems are aligning with India’s growing clean beauty movement.

Sales Outlook for Lubricants / Slip Agents Market in China

The Global Lubricants / Slip Agents Market in China is projected to grow at a CAGR of 12.1%, making it one of the most dynamic and competitive markets globally. Growth is underpinned by massive production scalability, aggressive domestic R&D investment, and the integration of sensorial additives into mainstream and luxury beauty formulations.

China’s rapid industrial expansion in silicone derivatives and polyether-modified systems is reshaping supply chains, making high-performance slip agents more accessible to local brands. The growing emphasis on texture innovation, active dispersion, and skin feel balance in products like tone-up creams, sunscreens, and foundations is boosting demand.

Furthermore, China’s government-backed sustainability programs have incentivized green chemistry in cosmetics, leading to strong adoption of bio-based ester slip agents. Domestic suppliers are also competing with global leaders by offering cost-effective multifunctional systems compatible with hybrid formulations.
  • Local producers are developing hybrid silicone-ester systems for affordable high-end textures.
  • The beauty industry’s move toward sensorial innovation is expanding slip agent use.
  • Sustainability-focused programs are accelerating green silicone and ester product pipelines.

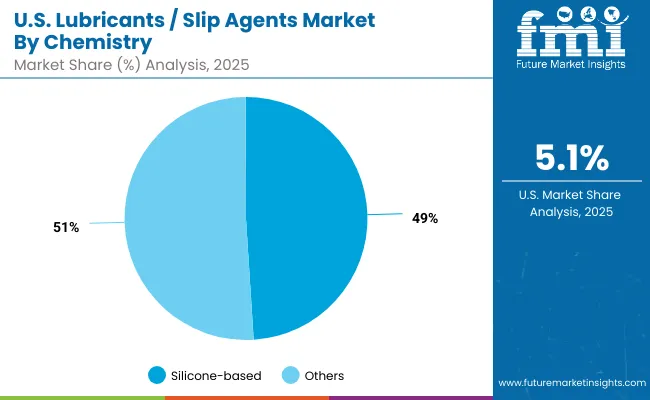
Growth Outlook for Lubricants / Slip Agents Market in the United States

Usa Lubricants Slip Agents Market By Chemistry

USA By Chemistry Value Share % 2025
Silicone-based 49.1%
Others 50.9%

The Global Lubricants / Slip Agents Market in the United States is valued at USD 458.3 million in 2025, representing one of the most mature yet innovation-driven segments of the global landscape. Silicone-based agents dominate with a 49.1% share, reflecting the long-standing reliance of USA formulators on high-purity silicones for premium skincare, hybrid cosmetics, and dermocosmetic applications.

The USA market’s direction is shaped by clean formulation initiatives, increasing use of low-volatile silicone blends, and the integration of polyether-modified agents that combine superior spreadability with environmental compliance. A gradual transition is visible toward sustainable and multifunctional sensorial systems, with formulators seeking to balance tactile performance, volatility control, and biodegradability.

A key growth catalyst is the integration of AI-driven formulation software and sensorial databases, enabling brands to fine-tune slip characteristics for varying skin types and climates. Companies such as Dow and Momentive are leveraging data-backed formulation modeling and hybrid silicone development to meet the rising demand for “smart sensorial” personal care products.

The adoption of hybrid silicone-ester systems in sunscreen, anti-aging serums, and clean beauty lines is expanding rapidly. Regulatory compliance, consumer preference for non-greasy, breathable finishes, and the emphasis on texture differentiation continue to position the United States as a critical innovation hub in the global slip agents ecosystem.
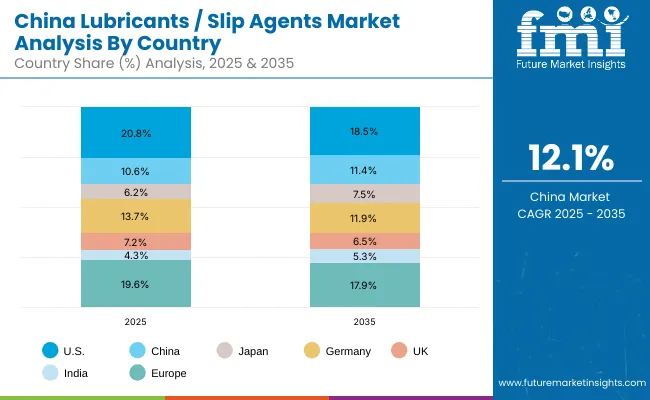
  • The USA market holds a 20.8% share in the global value in 2025.
  • Silicone-based agents lead at 49.1%, driven by premium skincare and dermocosmetic adoption.
  • Growth supported by AI-assisted formulation design and sustainable silicone innovation.

Growth Outlook for Lubricants / Slip Agents Market in China

China Lubricants Slip Agents Market

China By Function Value Share % 2025
Spreadability enhancers 39.2%
Others 60.8%

The Global Lubricants / Slip Agents Market in China is estimated at USD 234.2 million in 2025 and is forecasted to expand at an impressive CAGR of 12.1% through 2035, marking it as one of the most dynamic regional markets worldwide.

Spreadability enhancers dominate the functional segmentation with a 39.2% share, reflecting the strong consumer preference for lightweight, fast-absorbing, and matte-finish products suited to humid climates. The Chinese market’s growth is powered by rapid expansion in personal care manufacturing, strong R&D investment in silicone and natural ester chemistries, and robust domestic production of polyether-modified slip agents.

The widespread adoption of slip systems in skin-brightening creams, tone-up sunscreens, and hybrid foundation-serum formulations has elevated China’s role from a manufacturing base to an innovation-led consumer market. Local players such as KCC Beauty and regional subsidiaries of Shin-Etsu and Wacker Chemie are partnering with cosmetic OEMs to create cost-efficient, multifunctional slip systems optimized for mass and premium beauty lines.

Additionally, China’s strong regulatory push for green chemistry and biodegradable ingredients is accelerating the shift toward ester-based and plant-derived slip agents. As smart manufacturing expands, cloud-integrated formulation labs and AI-based quality control systems are expected to dominate R&D workflows by 2030, further reinforcing China’s competitive advantage in sensorial technology and scale.
  • The Chinese market holds a 10.6% share in global value in 2025.
  • Spreadability enhancers lead with 39.2%, reflecting growing hybrid product adoption.
  • Growth supported by local silicone capacity, smart formulation systems, and sustainability reforms.

Competitive Landscape of the Global Lubricants / Slip Agents Market

Lubricants Slip Agents Market By Company

Company Global Value Share 2025
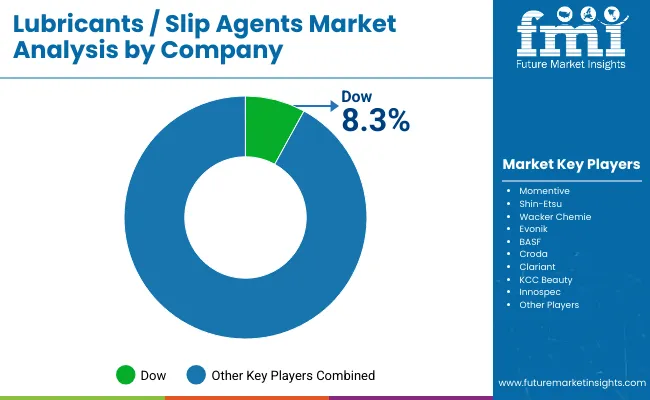
Dow 8.3%
Others 91.7%

The Global Lubricants / Slip Agents Market is moderately consolidated, with a mix of global chemical majors, mid-sized specialty players, and formulation-driven innovators competing for share across regions. Dow leads globally with an 8.3% value share, leveraging its comprehensive silicone-based portfolio and deep partnerships with personal care formulators across the United States, Europe, and Asia.

Momentive, Shin-Etsu, and Wacker Chemie closely follow, focusing on high-performance silicone fluids, polyether-modified derivatives, and emulsion concentrates that deliver multi-sensory enhancement and surface uniformity. Evonik and BASF have strengthened their presence through biodegradable ester and hybrid systems, aligning with the clean beauty transition in Europe and North America.

Mid-tier players such as Croda, Clariant, and Innospec are differentiating through bio-based sensorial engineering, combining natural feedstocks with silicone alternatives to achieve similar tactile smoothness while reducing environmental impact. Emerging Asian manufacturers, particularly KCC Beauty in South Korea and local producers in China, are reshaping the competitive balance through cost-effective hybrid slip systems that rival global formulations in both texture and performance.

The competitive environment is shifting away from chemistry alone toward integrated sensorial ecosystems, where performance analytics, regulatory compliance, and climate-adapted formulation design define differentiation. Increasing adoption of AI-powered R&D, digital formulation mapping, and cloud-based testing platforms is enabling suppliers to co-create products with beauty brands in real time. This convergence of chemistry and data science is establishing a new benchmark for innovation in the Global Lubricants / Slip Agents Market, where the leaders are those who deliver sensorial precision, sustainability, and scalability across every formulation tier.

Key Developments in Global Lubricants / Slip Agents Market

  • On February 8, 2025, Dow launched its Dowsil EL-8050 Hybrid Slip Enhancer, a next-generation silicone-ester blend designed for sustainable beauty formulations. The innovation focuses on providing high spreadability and long-lasting skin feel while maintaining 95% biodegradability. This launch marked Dow’s transition toward hybrid sensorial systems combining silicone precision with natural ester chemistry for clean beauty applications.
  • On November 21, 2024, Momentive Performance Materials introduced a new SilFormEcoSense Series, featuring ultra-low cyclic silicone content to comply with EU D4/D5/D6 restrictions. The company emphasized its alignment with circular chemistry principles, positioning the range as a bridge between regulatory compliance and premium sensorial performance.

Scope of the Report

Item Value
Quantitative Units USD Million
Chemistry Silicone-based, Hydrocarbon-based, Ester & Natural Oil-based, Polyether-modified
Function Spreadability enhancers, Film formers & skin feel modifiers, Friction-reduction agents
Physical Form Liquid, Powder, Emulsion concentrate
Application Skin creams & lotions, Color cosmetics, Hair conditioners & styling, Sunscreen formulations
End Use Mass personal care, Premium skincare & color cosmetics, Dermocosmetic
Regions Covered North America, Europe, East Asia, South Asia & Pacific, Latin America, Middle East & Africa
Countries Covered United States, China, India, Japan, Germany, United Kingdom, France, Brazil, South Korea, Indonesia
Key Companies Profiled Dow, Momentive, Shin-Etsu, Wacker Chemie, Evonik, BASF, Croda, Clariant, KCC Beauty, Innospec
Additional Attributes Dollar sales by chemistry and function, adoption trends in premium skincare and hybrid beauty, rising demand for polyether-modified and silicone-ester hybrids, shift toward low-volatile and biodegradable formulations, expansion of dermocosmetic applications, regional focus on clean beauty and sensorial optimization, integration of digital formulation tools, and sustainability-driven ingredient innovation across major regions.

Key Segments

By Chemistry:

  • Silicone-based
  • Hydrocarbon-based
  • Ester & natural oil-based
  • Polyether-modified

By Function:

  • Spreadability enhancers
  • Film formers & skin feel modifiers
  • Friction-reduction agents

By Physical Form:

  • Liquid
  • Powder
  • Emulsion concentrate

By Application:

  • Skin creams & lotions
  • Color cosmetics
  • Hair conditioners & styling
  • Sunscreen formulations

By End Use:

  • Mass personal care
  • Premium skincare & color cosmetics
  • Dermocosmetic

By Region:

  • North America
  • Latin America
  • Europe
  • East Asia
  • South Asia & Pacific
  • Middle East and Africa

Table of Content

  1. Executive Summary
    • Global Market Outlook
    • Demand-side Trends
    • Supply-side Trends
    • Technology Roadmap Analysis
    • Analysis and Recommendations
  2. Market Overview
    • Market Coverage / Taxonomy
    • Market Definition / Scope / Limitations
  3. Market Background
    • Market Dynamics
      • Drivers
      • Restraints
      • Opportunity
      • Trends
    • Scenario Forecast
      • Demand in Optimistic Scenario
      • Demand in Likely Scenario
      • Demand in Conservative Scenario
    • Opportunity Map Analysis
    • Product Life Cycle Analysis
    • Supply Chain Analysis
      • Supply Side Participants and their Roles
        • Producers
        • Mid-Level Participants (Traders/ Agents/ Brokers)
        • Wholesalers and Distributors
      • Value Added and Value Created at Node in the Supply Chain
      • List of Raw Material Suppliers
      • List of Existing and Potential Buyer’s
    • Investment Feasibility Matrix
    • Value Chain Analysis
      • Profit Margin Analysis
      • Wholesalers and Distributors
      • Retailers
    • PESTLE and Porter’s Analysis
    • Regulatory Landscape
      • By Key Regions
      • By Key Countries
    • Regional Parent Market Outlook
    • Production and Consumption Statistics
    • Import and Export Statistics
  4. Global Market Analysis 2020 to 2024 and Forecast, 2025 to 2035
    • Historical Market Size Value (USD Million) & Volume (Units) Analysis, 2020 to 2024
    • Current and Future Market Size Value (USD Million) & Volume (Units) Projections, 2025 to 2035
      • Y-o-Y Growth Trend Analysis
      • Absolute $ Opportunity Analysis
  5. Global Market Analysis 2020 to 2024 and Forecast 2025 to 2035, By Chemistry
    • Introduction / Key Findings
    • Historical Market Size Value (USD Million) & Volume (Units) Analysis By Chemistry, 2020 to 2024
    • Current and Future Market Size Value (USD Million) & Volume (Units) Analysis and Forecast By Chemistry, 2025 to 2035
      • Silicone-based
      • Hydrocarbon-based
      • Ester & natural oil-based
      • Polyether-modified
    • Y-o-Y Growth Trend Analysis By Chemistry, 2020 to 2024
    • Absolute $ Opportunity Analysis By Chemistry, 2025 to 2035
  6. Global Market Analysis 2020 to 2024 and Forecast 2025 to 2035, By Function
    • Introduction / Key Findings
    • Historical Market Size Value (USD Million) & Volume (Units) Analysis By Function, 2020 to 2024
    • Current and Future Market Size Value (USD Million) & Volume (Units) Analysis and Forecast By Function, 2025 to 2035
      • Spreadability enhancers
      • Film formers & skin feel modifiers
      • Friction-reduction agents
    • Y-o-Y Growth Trend Analysis By Function, 2020 to 2024
    • Absolute $ Opportunity Analysis By Function, 2025 to 2035
  7. Global Market Analysis 2020 to 2024 and Forecast 2025 to 2035, By Physical Form
    • Introduction / Key Findings
    • Historical Market Size Value (USD Million) & Volume (Units) Analysis By Physical Form, 2020 to 2024
    • Current and Future Market Size Value (USD Million) & Volume (Units) Analysis and Forecast By Physical Form, 2025 to 2035
      • Liquid
      • Powder
      • Emulsion concentrate
    • Y-o-Y Growth Trend Analysis By Physical Form, 2020 to 2024
    • Absolute $ Opportunity Analysis By Physical Form, 2025 to 2035
  8. Global Market Analysis 2020 to 2024 and Forecast 2025 to 2035, By Application
    • Introduction / Key Findings
    • Historical Market Size Value (USD Million) & Volume (Units) Analysis By Application, 2020 to 2024
    • Current and Future Market Size Value (USD Million) & Volume (Units) Analysis and Forecast By Application, 2025 to 2035
      • Skin creams & lotions
      • Color cosmetics
      • Hair conditioners & styling
      • Sunscreen formulations
    • Y-o-Y Growth Trend Analysis By Application, 2020 to 2024
    • Absolute $ Opportunity Analysis By Application, 2025 to 2035
  9. Global Market Analysis 2020 to 2024 and Forecast 2025 to 2035, By End Use
    • Introduction / Key Findings
    • Historical Market Size Value (USD Million) & Volume (Units) Analysis By End Use, 2020 to 2024
    • Current and Future Market Size Value (USD Million) & Volume (Units) Analysis and Forecast By End Use, 2025 to 2035
      • Mass personal care
      • Premium skincare & color cosmetics
      • Dermocosmetic
    • Y-o-Y Growth Trend Analysis By End Use, 2020 to 2024
    • Absolute $ Opportunity Analysis By End Use, 2025 to 2035
  10. Global Market Analysis 2020 to 2024 and Forecast 2025 to 2035, By Region
    • Introduction
    • Historical Market Size Value (USD Million) & Volume (Units) Analysis By Region, 2020 to 2024
    • Current Market Size Value (USD Million) & Volume (Units) Analysis and Forecast By Region, 2025 to 2035
      • North America
      • Latin America
      • Europe
      • East Asia
      • South Asia & Pacific
      • Middle East and Africa
    • Market Attractiveness Analysis By Region
  11. North America Market Analysis 2020 to 2024 and Forecast 2025 to 2035, By Country
    • Historical Market Size Value (USD Million) & Volume (Units) Trend Analysis By Market Taxonomy, 2020 to 2024
    • Market Size Value (USD Million) & Volume (Units) Forecast By Market Taxonomy, 2025 to 2035
      • By Country
        • USA
        • Canada
      • By Chemistry
      • By Function
      • By Physical Form
      • By Application
      • By End Use
    • Market Attractiveness Analysis
      • By Country
      • By Chemistry
      • By Function
      • By Physical Form
      • By Application
      • By End Use
    • Key Takeaways
  12. Latin America Market Analysis 2020 to 2024 and Forecast 2025 to 2035, By Country
    • Historical Market Size Value (USD Million) & Volume (Units) Trend Analysis By Market Taxonomy, 2020 to 2024
    • Market Size Value (USD Million) & Volume (Units) Forecast By Market Taxonomy, 2025 to 2035
      • By Country
        • Brazil
        • Mexico
        • Colombia
        • Rest of Latin America
      • By Chemistry
      • By Function
      • By Physical Form
      • By Application
      • By End Use
    • Market Attractiveness Analysis
      • By Country
      • By Chemistry
      • By Function
      • By Physical Form
      • By Application
      • By End Use
    • Key Takeaways
  13. Europe Market Analysis 2020 to 2024 and Forecast 2025 to 2035, By Country
    • Historical Market Size Value (USD Million) & Volume (Units) Trend Analysis By Market Taxonomy, 2020 to 2024
    • Market Size Value (USD Million) & Volume (Units) Forecast By Market Taxonomy, 2025 to 2035
      • By Country
        • Germany
        • UK
        • France
        • Italy
        • Spain
        • Belgium
        • Netherlands
        • Nordic
        • Switzerland
        • Russia
        • Poland
        • Rest of Europe
      • By Chemistry
      • By Function
      • By Physical Form
      • By Application
      • By End Use
    • Market Attractiveness Analysis
      • By Country
      • By Chemistry
      • By Function
      • By Physical Form
      • By Application
      • By End Use
    • Key Takeaways
  14. East Asia Market Analysis 2020 to 2024 and Forecast 2025 to 2035, By Country
    • Historical Market Size Value (USD Million) & Volume (Units) Trend Analysis By Market Taxonomy, 2020 to 2024
    • Market Size Value (USD Million) & Volume (Units) Forecast By Market Taxonomy, 2025 to 2035
      • By Country
        • China
        • Japan
        • South Korea
      • By Chemistry
      • By Function
      • By Physical Form
      • By Application
      • By End Use
    • Market Attractiveness Analysis
      • By Country
      • By Chemistry
      • By Function
      • By Physical Form
      • By Application
      • By End Use
    • Key Takeaways
  15. South Asia & Pacific Market Analysis 2020 to 2024 and Forecast 2025 to 2035, By Country
    • Historical Market Size Value (USD Million) & Volume (Units) Trend Analysis By Market Taxonomy, 2020 to 2024
    • Market Size Value (USD Million) & Volume (Units) Forecast By Market Taxonomy, 2025 to 2035
      • By Country
        • India
        • Thailand
        • Malaysia
        • Indonesia
        • Singapore
        • Vietnam
        • Australia
        • New Zealand
        • Rest of South Asia
      • By Chemistry
      • By Function
      • By Physical Form
      • By Application
      • By End Use
    • Market Attractiveness Analysis
      • By Country
      • By Chemistry
      • By Function
      • By Physical Form
      • By Application
      • By End Use
    • Key Takeaways
  16. Middle East and Africa Market Analysis 2020 to 2024 and Forecast 2025 to 2035, By Country
    • Historical Market Size Value (USD Million) & Volume (Units) Trend Analysis By Market Taxonomy, 2020 to 2024
    • Market Size Value (USD Million) & Volume (Units) Forecast By Market Taxonomy, 2025 to 2035
      • By Country
        • Turkey
        • UAE
        • Saudi Arabia
        • Israel
        • Other GCC Countries
        • North Africa
        • South Africa
      • By Chemistry
      • By Function
      • By Physical Form
      • By Application
      • By End Use
    • Market Attractiveness Analysis
      • By Country
      • By Chemistry
      • By Function
      • By Physical Form
      • By Application
      • By End Use
    • Key Takeaways
  17. Key Countries Market Analysis
    • USA
      • Pricing Analysis
      • Market Share Analysis, 2024
        • By Chemistry
        • By Function
        • By Physical Form
        • By Application
        • By End Use
    • Canada
      • Pricing Analysis
      • Market Share Analysis, 2024
        • By Chemistry
        • By Function
        • By Physical Form
        • By Application
        • By End Use
    • Brazil
      • Pricing Analysis
      • Market Share Analysis, 2024
        • By Chemistry
        • By Function
        • By Physical Form
        • By Application
        • By End Use
    • Mexico
      • Pricing Analysis
      • Market Share Analysis, 2024
        • By Chemistry
        • By Function
        • By Physical Form
        • By Application
        • By End Use
    • Colombia
      • Pricing Analysis
      • Market Share Analysis, 2024
        • By Chemistry
        • By Function
        • By Physical Form
        • By Application
        • By End Use
    • Germany
      • Pricing Analysis
      • Market Share Analysis, 2024
        • By Chemistry
        • By Function
        • By Physical Form
        • By Application
        • By End Use
    • UK
      • Pricing Analysis
      • Market Share Analysis, 2024
        • By Chemistry
        • By Function
        • By Physical Form
        • By Application
        • By End Use
    • France
      • Pricing Analysis
      • Market Share Analysis, 2024
        • By Chemistry
        • By Function
        • By Physical Form
        • By Application
        • By End Use
    • Italy
      • Pricing Analysis
      • Market Share Analysis, 2024
        • By Chemistry
        • By Function
        • By Physical Form
        • By Application
        • By End Use
    • Spain
      • Pricing Analysis
      • Market Share Analysis, 2024
        • By Chemistry
        • By Function
        • By Physical Form
        • By Application
        • By End Use
    • Belgium
      • Pricing Analysis
      • Market Share Analysis, 2024
        • By Chemistry
        • By Function
        • By Physical Form
        • By Application
        • By End Use
    • Netherlands
      • Pricing Analysis
      • Market Share Analysis, 2024
        • By Chemistry
        • By Function
        • By Physical Form
        • By Application
        • By End Use
    • Nordic
      • Pricing Analysis
      • Market Share Analysis, 2024
        • By Chemistry
        • By Function
        • By Physical Form
        • By Application
        • By End Use
    • Switzerland
      • Pricing Analysis
      • Market Share Analysis, 2024
        • By Chemistry
        • By Function
        • By Physical Form
        • By Application
        • By End Use
    • Russia
      • Pricing Analysis
      • Market Share Analysis, 2024
        • By Chemistry
        • By Function
        • By Physical Form
        • By Application
        • By End Use
    • Poland
      • Pricing Analysis
      • Market Share Analysis, 2024
        • By Chemistry
        • By Function
        • By Physical Form
        • By Application
        • By End Use
    • China
      • Pricing Analysis
      • Market Share Analysis, 2024
        • By Chemistry
        • By Function
        • By Physical Form
        • By Application
        • By End Use
    • Japan
      • Pricing Analysis
      • Market Share Analysis, 2024
        • By Chemistry
        • By Function
        • By Physical Form
        • By Application
        • By End Use
    • South Korea
      • Pricing Analysis
      • Market Share Analysis, 2024
        • By Chemistry
        • By Function
        • By Physical Form
        • By Application
        • By End Use
    • India
      • Pricing Analysis
      • Market Share Analysis, 2024
        • By Chemistry
        • By Function
        • By Physical Form
        • By Application
        • By End Use
    • Thailand
      • Pricing Analysis
      • Market Share Analysis, 2024
        • By Chemistry
        • By Function
        • By Physical Form
        • By Application
        • By End Use
    • Indonesia
      • Pricing Analysis
      • Market Share Analysis, 2024
        • By Chemistry
        • By Function
        • By Physical Form
        • By Application
        • By End Use
    • Australia
      • Pricing Analysis
      • Market Share Analysis, 2024
        • By Chemistry
        • By Function
        • By Physical Form
        • By Application
        • By End Use
    • New Zealand
      • Pricing Analysis
      • Market Share Analysis, 2024
        • By Chemistry
        • By Function
        • By Physical Form
        • By Application
        • By End Use
    • Turkey
      • Pricing Analysis
      • Market Share Analysis, 2024
        • By Chemistry
        • By Function
        • By Physical Form
        • By Application
        • By End Use
    • UAE
      • Pricing Analysis
      • Market Share Analysis, 2024
        • By Chemistry
        • By Function
        • By Physical Form
        • By Application
        • By End Use
    • Saudi Arabia
      • Pricing Analysis
      • Market Share Analysis, 2024
        • By Chemistry
        • By Function
        • By Physical Form
        • By Application
        • By End Use
    • Israel
      • Pricing Analysis
      • Market Share Analysis, 2024
        • By Chemistry
        • By Function
        • By Physical Form
        • By Application
        • By End Use
    • North Africa
      • Pricing Analysis
      • Market Share Analysis, 2024
        • By Chemistry
        • By Function
        • By Physical Form
        • By Application
        • By End Use
    • South Africa
      • Pricing Analysis
      • Market Share Analysis, 2024
        • By Chemistry
        • By Function
        • By Physical Form
        • By Application
        • By End Use
  18. Market Structure Analysis
    • Competition Dashboard
    • Competition Benchmarking
    • Market Share Analysis of Top Players
      • By Regional
      • By Chemistry
      • By Function
      • By Physical Form
      • By Application
      • By End Use
  19. Competition Analysis
    • Competition Deep Dive
      • Dow
        • Overview
        • Product Portfolio
        • Profitability by Market Segments (Product/Age /Sales Channel/Region)
        • Sales Footprint
        • Strategy Overview
          • Marketing Strategy
          • Product Strategy
          • Channel Strategy
      • Momentive
        • Overview
        • Product Portfolio
        • Profitability by Market Segments (Product/Age /Sales Channel/Region)
        • Sales Footprint
        • Strategy Overview
          • Marketing Strategy
          • Product Strategy
          • Channel Strategy
      • Shin-Etsu
        • Overview
        • Product Portfolio
        • Profitability by Market Segments (Product/Age /Sales Channel/Region)
        • Sales Footprint
        • Strategy Overview
          • Marketing Strategy
          • Product Strategy
          • Channel Strategy
      • Wacker Chemie
        • Overview
        • Product Portfolio
        • Profitability by Market Segments (Product/Age /Sales Channel/Region)
        • Sales Footprint
        • Strategy Overview
          • Marketing Strategy
          • Product Strategy
          • Channel Strategy
      • Evonik
        • Overview
        • Product Portfolio
        • Profitability by Market Segments (Product/Age /Sales Channel/Region)
        • Sales Footprint
        • Strategy Overview
          • Marketing Strategy
          • Product Strategy
          • Channel Strategy
      • BASF
        • Overview
        • Product Portfolio
        • Profitability by Market Segments (Product/Age /Sales Channel/Region)
        • Sales Footprint
        • Strategy Overview
          • Marketing Strategy
          • Product Strategy
          • Channel Strategy
      • Croda
        • Overview
        • Product Portfolio
        • Profitability by Market Segments (Product/Age /Sales Channel/Region)
        • Sales Footprint
        • Strategy Overview
          • Marketing Strategy
          • Product Strategy
          • Channel Strategy
      • Clariant
        • Overview
        • Product Portfolio
        • Profitability by Market Segments (Product/Age /Sales Channel/Region)
        • Sales Footprint
        • Strategy Overview
          • Marketing Strategy
          • Product Strategy
          • Channel Strategy
      • KCC Beauty
        • Overview
        • Product Portfolio
        • Profitability by Market Segments (Product/Age /Sales Channel/Region)
        • Sales Footprint
        • Strategy Overview
          • Marketing Strategy
          • Product Strategy
          • Channel Strategy
      • Innospec
        • Overview
        • Product Portfolio
        • Profitability by Market Segments (Product/Age /Sales Channel/Region)
        • Sales Footprint
        • Strategy Overview
          • Marketing Strategy
          • Product Strategy
          • Channel Strategy
      • Others
        • Overview
        • Product Portfolio
        • Profitability by Market Segments (Product/Age /Sales Channel/Region)
        • Sales Footprint
        • Strategy Overview
          • Marketing Strategy
          • Product Strategy
          • Channel Strategy
  20. Assumptions & Acronyms Used
  21. Research Methodology

List of Tables

  • Table 1: Global Market Value (USD Million) Forecast by Region, 2020-2035
  • Table 2: Global Market Volume (Units) Forecast by Region, 2020-2035
  • Table 3: Global Market Value (USD Million) Forecast by Chemistry, 2020-2035
  • Table 4: Global Market Volume (Units) Forecast by Chemistry, 2020-2035
  • Table 5: Global Market Value (USD Million) Forecast by Function, 2020-2035
  • Table 6: Global Market Volume (Units) Forecast by Function, 2020-2035
  • Table 7: Global Market Value (USD Million) Forecast by Physical Form, 2020-2035
  • Table 8: Global Market Volume (Units) Forecast by Physical Form, 2020-2035
  • Table 9: Global Market Value (USD Million) Forecast by Application, 2020-2035
  • Table 10: Global Market Volume (Units) Forecast by Application, 2020-2035
  • Table 11: Global Market Value (USD Million) Forecast by End Use, 2020-2035
  • Table 12: Global Market Volume (Units) Forecast by End Use, 2020-2035
  • Table 13: North America Market Value (USD Million) Forecast by Country, 2020-2035
  • Table 14: North America Market Volume (Units) Forecast by Country, 2020-2035
  • Table 15: North America Market Value (USD Million) Forecast by Chemistry, 2020-2035
  • Table 16: North America Market Volume (Units) Forecast by Chemistry, 2020-2035
  • Table 17: North America Market Value (USD Million) Forecast by Function, 2020-2035
  • Table 18: North America Market Volume (Units) Forecast by Function, 2020-2035
  • Table 19: North America Market Value (USD Million) Forecast by Physical Form, 2020-2035
  • Table 20: North America Market Volume (Units) Forecast by Physical Form, 2020-2035
  • Table 21: North America Market Value (USD Million) Forecast by Application, 2020-2035
  • Table 22: North America Market Volume (Units) Forecast by Application, 2020-2035
  • Table 23: North America Market Value (USD Million) Forecast by End Use, 2020-2035
  • Table 24: North America Market Volume (Units) Forecast by End Use, 2020-2035
  • Table 25: Latin America Market Value (USD Million) Forecast by Country, 2020-2035
  • Table 26: Latin America Market Volume (Units) Forecast by Country, 2020-2035
  • Table 27: Latin America Market Value (USD Million) Forecast by Chemistry, 2020-2035
  • Table 28: Latin America Market Volume (Units) Forecast by Chemistry, 2020-2035
  • Table 29: Latin America Market Value (USD Million) Forecast by Function, 2020-2035
  • Table 30: Latin America Market Volume (Units) Forecast by Function, 2020-2035
  • Table 31: Latin America Market Value (USD Million) Forecast by Physical Form, 2020-2035
  • Table 32: Latin America Market Volume (Units) Forecast by Physical Form, 2020-2035
  • Table 33: Latin America Market Value (USD Million) Forecast by Application, 2020-2035
  • Table 34: Latin America Market Volume (Units) Forecast by Application, 2020-2035
  • Table 35: Latin America Market Value (USD Million) Forecast by End Use, 2020-2035
  • Table 36: Latin America Market Volume (Units) Forecast by End Use, 2020-2035
  • Table 37: Europe Market Value (USD Million) Forecast by Country, 2020-2035
  • Table 38: Europe Market Volume (Units) Forecast by Country, 2020-2035
  • Table 39: Europe Market Value (USD Million) Forecast by Chemistry, 2020-2035
  • Table 40: Europe Market Volume (Units) Forecast by Chemistry, 2020-2035
  • Table 41: Europe Market Value (USD Million) Forecast by Function, 2020-2035
  • Table 42: Europe Market Volume (Units) Forecast by Function, 2020-2035
  • Table 43: Europe Market Value (USD Million) Forecast by Physical Form, 2020-2035
  • Table 44: Europe Market Volume (Units) Forecast by Physical Form, 2020-2035
  • Table 45: Europe Market Value (USD Million) Forecast by Application, 2020-2035
  • Table 46: Europe Market Volume (Units) Forecast by Application, 2020-2035
  • Table 47: Europe Market Value (USD Million) Forecast by End Use, 2020-2035
  • Table 48: Europe Market Volume (Units) Forecast by End Use, 2020-2035
  • Table 49: East Asia Market Value (USD Million) Forecast by Country, 2020-2035
  • Table 50: East Asia Market Volume (Units) Forecast by Country, 2020-2035
  • Table 51: East Asia Market Value (USD Million) Forecast by Chemistry, 2020-2035
  • Table 52: East Asia Market Volume (Units) Forecast by Chemistry, 2020-2035
  • Table 53: East Asia Market Value (USD Million) Forecast by Function, 2020-2035
  • Table 54: East Asia Market Volume (Units) Forecast by Function, 2020-2035
  • Table 55: East Asia Market Value (USD Million) Forecast by Physical Form, 2020-2035
  • Table 56: East Asia Market Volume (Units) Forecast by Physical Form, 2020-2035
  • Table 57: East Asia Market Value (USD Million) Forecast by Application, 2020-2035
  • Table 58: East Asia Market Volume (Units) Forecast by Application, 2020-2035
  • Table 59: East Asia Market Value (USD Million) Forecast by End Use, 2020-2035
  • Table 60: East Asia Market Volume (Units) Forecast by End Use, 2020-2035
  • Table 61: South Asia & Pacific Market Value (USD Million) Forecast by Country, 2020-2035
  • Table 62: South Asia & Pacific Market Volume (Units) Forecast by Country, 2020-2035
  • Table 63: South Asia & Pacific Market Value (USD Million) Forecast by Chemistry, 2020-2035
  • Table 64: South Asia & Pacific Market Volume (Units) Forecast by Chemistry, 2020-2035
  • Table 65: South Asia & Pacific Market Value (USD Million) Forecast by Function, 2020-2035
  • Table 66: South Asia & Pacific Market Volume (Units) Forecast by Function, 2020-2035
  • Table 67: South Asia & Pacific Market Value (USD Million) Forecast by Physical Form, 2020-2035
  • Table 68: South Asia & Pacific Market Volume (Units) Forecast by Physical Form, 2020-2035
  • Table 69: South Asia & Pacific Market Value (USD Million) Forecast by Application, 2020-2035
  • Table 70: South Asia & Pacific Market Volume (Units) Forecast by Application, 2020-2035
  • Table 71: South Asia & Pacific Market Value (USD Million) Forecast by End Use, 2020-2035
  • Table 72: South Asia & Pacific Market Volume (Units) Forecast by End Use, 2020-2035
  • Table 73: Middle East and Africa Market Value (USD Million) Forecast by Country, 2020-2035
  • Table 74: Middle East and Africa Market Volume (Units) Forecast by Country, 2020-2035
  • Table 75: Middle East and Africa Market Value (USD Million) Forecast by Chemistry, 2020-2035
  • Table 76: Middle East and Africa Market Volume (Units) Forecast by Chemistry, 2020-2035
  • Table 77: Middle East and Africa Market Value (USD Million) Forecast by Function, 2020-2035
  • Table 78: Middle East and Africa Market Volume (Units) Forecast by Function, 2020-2035
  • Table 79: Middle East and Africa Market Value (USD Million) Forecast by Physical Form, 2020-2035
  • Table 80: Middle East and Africa Market Volume (Units) Forecast by Physical Form, 2020-2035
  • Table 81: Middle East and Africa Market Value (USD Million) Forecast by Application, 2020-2035
  • Table 82: Middle East and Africa Market Volume (Units) Forecast by Application, 2020-2035
  • Table 83: Middle East and Africa Market Value (USD Million) Forecast by End Use, 2020-2035
  • Table 84: Middle East and Africa Market Volume (Units) Forecast by End Use, 2020-2035

List of Figures

  • Figure 1: Global Market Value (USD Million) by Chemistry, 2025-2035
  • Figure 2: Global Market Value (USD Million) by Function, 2025-2035
  • Figure 3: Global Market Value (USD Million) by Physical Form, 2025-2035
  • Figure 4: Global Market Value (USD Million) by Application, 2025-2035
  • Figure 5: Global Market Value (USD Million) by End Use, 2025-2035
  • Figure 6: Global Market Value (USD Million) by Region, 2025-2035
  • Figure 7: Global Market Value (USD Million) Analysis by Region, 2020-2035
  • Figure 8: Global Market Volume (Units) Analysis by Region, 2020-2035
  • Figure 9: Global Market Value Share (%) and BPS Analysis by Region, 2025-2035
  • Figure 10: Global Market Y-o-Y Growth (%) Projections by Region, 2025-2035
  • Figure 11: Global Market Value (USD Million) Analysis by Chemistry, 2020-2035
  • Figure 12: Global Market Volume (Units) Analysis by Chemistry, 2020-2035
  • Figure 13: Global Market Value Share (%) and BPS Analysis by Chemistry, 2025-2035
  • Figure 14: Global Market Y-o-Y Growth (%) Projections by Chemistry, 2025-2035
  • Figure 15: Global Market Value (USD Million) Analysis by Function, 2020-2035
  • Figure 16: Global Market Volume (Units) Analysis by Function, 2020-2035
  • Figure 17: Global Market Value Share (%) and BPS Analysis by Function, 2025-2035
  • Figure 18: Global Market Y-o-Y Growth (%) Projections by Function, 2025-2035
  • Figure 19: Global Market Value (USD Million) Analysis by Physical Form, 2020-2035
  • Figure 20: Global Market Volume (Units) Analysis by Physical Form, 2020-2035
  • Figure 21: Global Market Value Share (%) and BPS Analysis by Physical Form, 2025-2035
  • Figure 22: Global Market Y-o-Y Growth (%) Projections by Physical Form, 2025-2035
  • Figure 23: Global Market Value (USD Million) Analysis by Application, 2020-2035
  • Figure 24: Global Market Volume (Units) Analysis by Application, 2020-2035
  • Figure 25: Global Market Value Share (%) and BPS Analysis by Application, 2025-2035
  • Figure 26: Global Market Y-o-Y Growth (%) Projections by Application, 2025-2035
  • Figure 27: Global Market Value (USD Million) Analysis by End Use, 2020-2035
  • Figure 28: Global Market Volume (Units) Analysis by End Use, 2020-2035
  • Figure 29: Global Market Value Share (%) and BPS Analysis by End Use, 2025-2035
  • Figure 30: Global Market Y-o-Y Growth (%) Projections by End Use, 2025-2035
  • Figure 31: Global Market Attractiveness by Chemistry, 2025-2035
  • Figure 32: Global Market Attractiveness by Function, 2025-2035
  • Figure 33: Global Market Attractiveness by Physical Form, 2025-2035
  • Figure 34: Global Market Attractiveness by Application, 2025-2035
  • Figure 35: Global Market Attractiveness by End Use, 2025-2035
  • Figure 36: Global Market Attractiveness by Region, 2025-2035
  • Figure 37: North America Market Value (USD Million) by Chemistry, 2025-2035
  • Figure 38: North America Market Value (USD Million) by Function, 2025-2035
  • Figure 39: North America Market Value (USD Million) by Physical Form, 2025-2035
  • Figure 40: North America Market Value (USD Million) by Application, 2025-2035
  • Figure 41: North America Market Value (USD Million) by End Use, 2025-2035
  • Figure 42: North America Market Value (USD Million) by Country, 2025-2035
  • Figure 43: North America Market Value (USD Million) Analysis by Country, 2020-2035
  • Figure 44: North America Market Volume (Units) Analysis by Country, 2020-2035
  • Figure 45: North America Market Value Share (%) and BPS Analysis by Country, 2025-2035
  • Figure 46: North America Market Y-o-Y Growth (%) Projections by Country, 2025-2035
  • Figure 47: North America Market Value (USD Million) Analysis by Chemistry, 2020-2035
  • Figure 48: North America Market Volume (Units) Analysis by Chemistry, 2020-2035
  • Figure 49: North America Market Value Share (%) and BPS Analysis by Chemistry, 2025-2035
  • Figure 50: North America Market Y-o-Y Growth (%) Projections by Chemistry, 2025-2035
  • Figure 51: North America Market Value (USD Million) Analysis by Function, 2020-2035
  • Figure 52: North America Market Volume (Units) Analysis by Function, 2020-2035
  • Figure 53: North America Market Value Share (%) and BPS Analysis by Function, 2025-2035
  • Figure 54: North America Market Y-o-Y Growth (%) Projections by Function, 2025-2035
  • Figure 55: North America Market Value (USD Million) Analysis by Physical Form, 2020-2035
  • Figure 56: North America Market Volume (Units) Analysis by Physical Form, 2020-2035
  • Figure 57: North America Market Value Share (%) and BPS Analysis by Physical Form, 2025-2035
  • Figure 58: North America Market Y-o-Y Growth (%) Projections by Physical Form, 2025-2035
  • Figure 59: North America Market Value (USD Million) Analysis by Application, 2020-2035
  • Figure 60: North America Market Volume (Units) Analysis by Application, 2020-2035
  • Figure 61: North America Market Value Share (%) and BPS Analysis by Application, 2025-2035
  • Figure 62: North America Market Y-o-Y Growth (%) Projections by Application, 2025-2035
  • Figure 63: North America Market Value (USD Million) Analysis by End Use, 2020-2035
  • Figure 64: North America Market Volume (Units) Analysis by End Use, 2020-2035
  • Figure 65: North America Market Value Share (%) and BPS Analysis by End Use, 2025-2035
  • Figure 66: North America Market Y-o-Y Growth (%) Projections by End Use, 2025-2035
  • Figure 67: North America Market Attractiveness by Chemistry, 2025-2035
  • Figure 68: North America Market Attractiveness by Function, 2025-2035
  • Figure 69: North America Market Attractiveness by Physical Form, 2025-2035
  • Figure 70: North America Market Attractiveness by Application, 2025-2035
  • Figure 71: North America Market Attractiveness by End Use, 2025-2035
  • Figure 72: North America Market Attractiveness by Country, 2025-2035
  • Figure 73: Latin America Market Value (USD Million) by Chemistry, 2025-2035
  • Figure 74: Latin America Market Value (USD Million) by Function, 2025-2035
  • Figure 75: Latin America Market Value (USD Million) by Physical Form, 2025-2035
  • Figure 76: Latin America Market Value (USD Million) by Application, 2025-2035
  • Figure 77: Latin America Market Value (USD Million) by End Use, 2025-2035
  • Figure 78: Latin America Market Value (USD Million) by Country, 2025-2035
  • Figure 79: Latin America Market Value (USD Million) Analysis by Country, 2020-2035
  • Figure 80: Latin America Market Volume (Units) Analysis by Country, 2020-2035
  • Figure 81: Latin America Market Value Share (%) and BPS Analysis by Country, 2025-2035
  • Figure 82: Latin America Market Y-o-Y Growth (%) Projections by Country, 2025-2035
  • Figure 83: Latin America Market Value (USD Million) Analysis by Chemistry, 2020-2035
  • Figure 84: Latin America Market Volume (Units) Analysis by Chemistry, 2020-2035
  • Figure 85: Latin America Market Value Share (%) and BPS Analysis by Chemistry, 2025-2035
  • Figure 86: Latin America Market Y-o-Y Growth (%) Projections by Chemistry, 2025-2035
  • Figure 87: Latin America Market Value (USD Million) Analysis by Function, 2020-2035
  • Figure 88: Latin America Market Volume (Units) Analysis by Function, 2020-2035
  • Figure 89: Latin America Market Value Share (%) and BPS Analysis by Function, 2025-2035
  • Figure 90: Latin America Market Y-o-Y Growth (%) Projections by Function, 2025-2035
  • Figure 91: Latin America Market Value (USD Million) Analysis by Physical Form, 2020-2035
  • Figure 92: Latin America Market Volume (Units) Analysis by Physical Form, 2020-2035
  • Figure 93: Latin America Market Value Share (%) and BPS Analysis by Physical Form, 2025-2035
  • Figure 94: Latin America Market Y-o-Y Growth (%) Projections by Physical Form, 2025-2035
  • Figure 95: Latin America Market Value (USD Million) Analysis by Application, 2020-2035
  • Figure 96: Latin America Market Volume (Units) Analysis by Application, 2020-2035
  • Figure 97: Latin America Market Value Share (%) and BPS Analysis by Application, 2025-2035
  • Figure 98: Latin America Market Y-o-Y Growth (%) Projections by Application, 2025-2035
  • Figure 99: Latin America Market Value (USD Million) Analysis by End Use, 2020-2035
  • Figure 100: Latin America Market Volume (Units) Analysis by End Use, 2020-2035
  • Figure 101: Latin America Market Value Share (%) and BPS Analysis by End Use, 2025-2035
  • Figure 102: Latin America Market Y-o-Y Growth (%) Projections by End Use, 2025-2035
  • Figure 103: Latin America Market Attractiveness by Chemistry, 2025-2035
  • Figure 104: Latin America Market Attractiveness by Function, 2025-2035
  • Figure 105: Latin America Market Attractiveness by Physical Form, 2025-2035
  • Figure 106: Latin America Market Attractiveness by Application, 2025-2035
  • Figure 107: Latin America Market Attractiveness by End Use, 2025-2035
  • Figure 108: Latin America Market Attractiveness by Country, 2025-2035
  • Figure 109: Europe Market Value (USD Million) by Chemistry, 2025-2035
  • Figure 110: Europe Market Value (USD Million) by Function, 2025-2035
  • Figure 111: Europe Market Value (USD Million) by Physical Form, 2025-2035
  • Figure 112: Europe Market Value (USD Million) by Application, 2025-2035
  • Figure 113: Europe Market Value (USD Million) by End Use, 2025-2035
  • Figure 114: Europe Market Value (USD Million) by Country, 2025-2035
  • Figure 115: Europe Market Value (USD Million) Analysis by Country, 2020-2035
  • Figure 116: Europe Market Volume (Units) Analysis by Country, 2020-2035
  • Figure 117: Europe Market Value Share (%) and BPS Analysis by Country, 2025-2035
  • Figure 118: Europe Market Y-o-Y Growth (%) Projections by Country, 2025-2035
  • Figure 119: Europe Market Value (USD Million) Analysis by Chemistry, 2020-2035
  • Figure 120: Europe Market Volume (Units) Analysis by Chemistry, 2020-2035
  • Figure 121: Europe Market Value Share (%) and BPS Analysis by Chemistry, 2025-2035
  • Figure 122: Europe Market Y-o-Y Growth (%) Projections by Chemistry, 2025-2035
  • Figure 123: Europe Market Value (USD Million) Analysis by Function, 2020-2035
  • Figure 124: Europe Market Volume (Units) Analysis by Function, 2020-2035
  • Figure 125: Europe Market Value Share (%) and BPS Analysis by Function, 2025-2035
  • Figure 126: Europe Market Y-o-Y Growth (%) Projections by Function, 2025-2035
  • Figure 127: Europe Market Value (USD Million) Analysis by Physical Form, 2020-2035
  • Figure 128: Europe Market Volume (Units) Analysis by Physical Form, 2020-2035
  • Figure 129: Europe Market Value Share (%) and BPS Analysis by Physical Form, 2025-2035
  • Figure 130: Europe Market Y-o-Y Growth (%) Projections by Physical Form, 2025-2035
  • Figure 131: Europe Market Value (USD Million) Analysis by Application, 2020-2035
  • Figure 132: Europe Market Volume (Units) Analysis by Application, 2020-2035
  • Figure 133: Europe Market Value Share (%) and BPS Analysis by Application, 2025-2035
  • Figure 134: Europe Market Y-o-Y Growth (%) Projections by Application, 2025-2035
  • Figure 135: Europe Market Value (USD Million) Analysis by End Use, 2020-2035
  • Figure 136: Europe Market Volume (Units) Analysis by End Use, 2020-2035
  • Figure 137: Europe Market Value Share (%) and BPS Analysis by End Use, 2025-2035
  • Figure 138: Europe Market Y-o-Y Growth (%) Projections by End Use, 2025-2035
  • Figure 139: Europe Market Attractiveness by Chemistry, 2025-2035
  • Figure 140: Europe Market Attractiveness by Function, 2025-2035
  • Figure 141: Europe Market Attractiveness by Physical Form, 2025-2035
  • Figure 142: Europe Market Attractiveness by Application, 2025-2035
  • Figure 143: Europe Market Attractiveness by End Use, 2025-2035
  • Figure 144: Europe Market Attractiveness by Country, 2025-2035
  • Figure 145: East Asia Market Value (USD Million) by Chemistry, 2025-2035
  • Figure 146: East Asia Market Value (USD Million) by Function, 2025-2035
  • Figure 147: East Asia Market Value (USD Million) by Physical Form, 2025-2035
  • Figure 148: East Asia Market Value (USD Million) by Application, 2025-2035
  • Figure 149: East Asia Market Value (USD Million) by End Use, 2025-2035
  • Figure 150: East Asia Market Value (USD Million) by Country, 2025-2035
  • Figure 151: East Asia Market Value (USD Million) Analysis by Country, 2020-2035
  • Figure 152: East Asia Market Volume (Units) Analysis by Country, 2020-2035
  • Figure 153: East Asia Market Value Share (%) and BPS Analysis by Country, 2025-2035
  • Figure 154: East Asia Market Y-o-Y Growth (%) Projections by Country, 2025-2035
  • Figure 155: East Asia Market Value (USD Million) Analysis by Chemistry, 2020-2035
  • Figure 156: East Asia Market Volume (Units) Analysis by Chemistry, 2020-2035
  • Figure 157: East Asia Market Value Share (%) and BPS Analysis by Chemistry, 2025-2035
  • Figure 158: East Asia Market Y-o-Y Growth (%) Projections by Chemistry, 2025-2035
  • Figure 159: East Asia Market Value (USD Million) Analysis by Function, 2020-2035
  • Figure 160: East Asia Market Volume (Units) Analysis by Function, 2020-2035
  • Figure 161: East Asia Market Value Share (%) and BPS Analysis by Function, 2025-2035
  • Figure 162: East Asia Market Y-o-Y Growth (%) Projections by Function, 2025-2035
  • Figure 163: East Asia Market Value (USD Million) Analysis by Physical Form, 2020-2035
  • Figure 164: East Asia Market Volume (Units) Analysis by Physical Form, 2020-2035
  • Figure 165: East Asia Market Value Share (%) and BPS Analysis by Physical Form, 2025-2035
  • Figure 166: East Asia Market Y-o-Y Growth (%) Projections by Physical Form, 2025-2035
  • Figure 167: East Asia Market Value (USD Million) Analysis by Application, 2020-2035
  • Figure 168: East Asia Market Volume (Units) Analysis by Application, 2020-2035
  • Figure 169: East Asia Market Value Share (%) and BPS Analysis by Application, 2025-2035
  • Figure 170: East Asia Market Y-o-Y Growth (%) Projections by Application, 2025-2035
  • Figure 171: East Asia Market Value (USD Million) Analysis by End Use, 2020-2035
  • Figure 172: East Asia Market Volume (Units) Analysis by End Use, 2020-2035
  • Figure 173: East Asia Market Value Share (%) and BPS Analysis by End Use, 2025-2035
  • Figure 174: East Asia Market Y-o-Y Growth (%) Projections by End Use, 2025-2035
  • Figure 175: East Asia Market Attractiveness by Chemistry, 2025-2035
  • Figure 176: East Asia Market Attractiveness by Function, 2025-2035
  • Figure 177: East Asia Market Attractiveness by Physical Form, 2025-2035
  • Figure 178: East Asia Market Attractiveness by Application, 2025-2035
  • Figure 179: East Asia Market Attractiveness by End Use, 2025-2035
  • Figure 180: East Asia Market Attractiveness by Country, 2025-2035
  • Figure 181: South Asia & Pacific Market Value (USD Million) by Chemistry, 2025-2035
  • Figure 182: South Asia & Pacific Market Value (USD Million) by Function, 2025-2035
  • Figure 183: South Asia & Pacific Market Value (USD Million) by Physical Form, 2025-2035
  • Figure 184: South Asia & Pacific Market Value (USD Million) by Application, 2025-2035
  • Figure 185: South Asia & Pacific Market Value (USD Million) by End Use, 2025-2035
  • Figure 186: South Asia & Pacific Market Value (USD Million) by Country, 2025-2035
  • Figure 187: South Asia & Pacific Market Value (USD Million) Analysis by Country, 2020-2035
  • Figure 188: South Asia & Pacific Market Volume (Units) Analysis by Country, 2020-2035
  • Figure 189: South Asia & Pacific Market Value Share (%) and BPS Analysis by Country, 2025-2035
  • Figure 190: South Asia & Pacific Market Y-o-Y Growth (%) Projections by Country, 2025-2035
  • Figure 191: South Asia & Pacific Market Value (USD Million) Analysis by Chemistry, 2020-2035
  • Figure 192: South Asia & Pacific Market Volume (Units) Analysis by Chemistry, 2020-2035
  • Figure 193: South Asia & Pacific Market Value Share (%) and BPS Analysis by Chemistry, 2025-2035
  • Figure 194: South Asia & Pacific Market Y-o-Y Growth (%) Projections by Chemistry, 2025-2035
  • Figure 195: South Asia & Pacific Market Value (USD Million) Analysis by Function, 2020-2035
  • Figure 196: South Asia & Pacific Market Volume (Units) Analysis by Function, 2020-2035
  • Figure 197: South Asia & Pacific Market Value Share (%) and BPS Analysis by Function, 2025-2035
  • Figure 198: South Asia & Pacific Market Y-o-Y Growth (%) Projections by Function, 2025-2035
  • Figure 199: South Asia & Pacific Market Value (USD Million) Analysis by Physical Form, 2020-2035
  • Figure 200: South Asia & Pacific Market Volume (Units) Analysis by Physical Form, 2020-2035
  • Figure 201: South Asia & Pacific Market Value Share (%) and BPS Analysis by Physical Form, 2025-2035
  • Figure 202: South Asia & Pacific Market Y-o-Y Growth (%) Projections by Physical Form, 2025-2035
  • Figure 203: South Asia & Pacific Market Value (USD Million) Analysis by Application, 2020-2035
  • Figure 204: South Asia & Pacific Market Volume (Units) Analysis by Application, 2020-2035
  • Figure 205: South Asia & Pacific Market Value Share (%) and BPS Analysis by Application, 2025-2035
  • Figure 206: South Asia & Pacific Market Y-o-Y Growth (%) Projections by Application, 2025-2035
  • Figure 207: South Asia & Pacific Market Value (USD Million) Analysis by End Use, 2020-2035
  • Figure 208: South Asia & Pacific Market Volume (Units) Analysis by End Use, 2020-2035
  • Figure 209: South Asia & Pacific Market Value Share (%) and BPS Analysis by End Use, 2025-2035
  • Figure 210: South Asia & Pacific Market Y-o-Y Growth (%) Projections by End Use, 2025-2035
  • Figure 211: South Asia & Pacific Market Attractiveness by Chemistry, 2025-2035
  • Figure 212: South Asia & Pacific Market Attractiveness by Function, 2025-2035
  • Figure 213: South Asia & Pacific Market Attractiveness by Physical Form, 2025-2035
  • Figure 214: South Asia & Pacific Market Attractiveness by Application, 2025-2035
  • Figure 215: South Asia & Pacific Market Attractiveness by End Use, 2025-2035
  • Figure 216: South Asia & Pacific Market Attractiveness by Country, 2025-2035
  • Figure 217: Middle East and Africa Market Value (USD Million) by Chemistry, 2025-2035
  • Figure 218: Middle East and Africa Market Value (USD Million) by Function, 2025-2035
  • Figure 219: Middle East and Africa Market Value (USD Million) by Physical Form, 2025-2035
  • Figure 220: Middle East and Africa Market Value (USD Million) by Application, 2025-2035
  • Figure 221: Middle East and Africa Market Value (USD Million) by End Use, 2025-2035
  • Figure 222: Middle East and Africa Market Value (USD Million) by Country, 2025-2035
  • Figure 223: Middle East and Africa Market Value (USD Million) Analysis by Country, 2020-2035
  • Figure 224: Middle East and Africa Market Volume (Units) Analysis by Country, 2020-2035
  • Figure 225: Middle East and Africa Market Value Share (%) and BPS Analysis by Country, 2025-2035
  • Figure 226: Middle East and Africa Market Y-o-Y Growth (%) Projections by Country, 2025-2035
  • Figure 227: Middle East and Africa Market Value (USD Million) Analysis by Chemistry, 2020-2035
  • Figure 228: Middle East and Africa Market Volume (Units) Analysis by Chemistry, 2020-2035
  • Figure 229: Middle East and Africa Market Value Share (%) and BPS Analysis by Chemistry, 2025-2035
  • Figure 230: Middle East and Africa Market Y-o-Y Growth (%) Projections by Chemistry, 2025-2035
  • Figure 231: Middle East and Africa Market Value (USD Million) Analysis by Function, 2020-2035
  • Figure 232: Middle East and Africa Market Volume (Units) Analysis by Function, 2020-2035
  • Figure 233: Middle East and Africa Market Value Share (%) and BPS Analysis by Function, 2025-2035
  • Figure 234: Middle East and Africa Market Y-o-Y Growth (%) Projections by Function, 2025-2035
  • Figure 235: Middle East and Africa Market Value (USD Million) Analysis by Physical Form, 2020-2035
  • Figure 236: Middle East and Africa Market Volume (Units) Analysis by Physical Form, 2020-2035
  • Figure 237: Middle East and Africa Market Value Share (%) and BPS Analysis by Physical Form, 2025-2035
  • Figure 238: Middle East and Africa Market Y-o-Y Growth (%) Projections by Physical Form, 2025-2035
  • Figure 239: Middle East and Africa Market Value (USD Million) Analysis by Application, 2020-2035
  • Figure 240: Middle East and Africa Market Volume (Units) Analysis by Application, 2020-2035
  • Figure 241: Middle East and Africa Market Value Share (%) and BPS Analysis by Application, 2025-2035
  • Figure 242: Middle East and Africa Market Y-o-Y Growth (%) Projections by Application, 2025-2035
  • Figure 243: Middle East and Africa Market Value (USD Million) Analysis by End Use, 2020-2035
  • Figure 244: Middle East and Africa Market Volume (Units) Analysis by End Use, 2020-2035
  • Figure 245: Middle East and Africa Market Value Share (%) and BPS Analysis by End Use, 2025-2035
  • Figure 246: Middle East and Africa Market Y-o-Y Growth (%) Projections by End Use, 2025-2035
  • Figure 247: Middle East and Africa Market Attractiveness by Chemistry, 2025-2035
  • Figure 248: Middle East and Africa Market Attractiveness by Function, 2025-2035
  • Figure 249: Middle East and Africa Market Attractiveness by Physical Form, 2025-2035
  • Figure 250: Middle East and Africa Market Attractiveness by Application, 2025-2035
  • Figure 251: Middle East and Africa Market Attractiveness by End Use, 2025-2035
  • Figure 252: Middle East and Africa Market Attractiveness by Country, 2025-2035

Frequently Asked Questions

How big is the Global Lubricants / Slip Agents Market in 2025?

The Global Lubricants / Slip Agents Market is estimated to be valued at USD 2,207.4 million in 2025.

What will be the size of the Global Lubricants / Slip Agents Market in 2035?

The market size for the Global Lubricants / Slip Agents Market is projected to reach USD 4,702.6 million by 2035.

How much will be the market growth between 2025 and 2035?

The Global Lubricants / Slip Agents Market is expected to grow at a 7.9% CAGR between 2025 and 2035.

What are the key product types or chemistries in the market?

The key chemistries in the Global Lubricants / Slip Agents Market are silicone-based, hydrocarbon-based, ester & natural oil-based, and polyether-modified slip agents.

Which functional segment will contribute the most in 2025?

In terms of function, spreadability enhancers are expected to command 42.7% share of the Global Lubricants / Slip Agents Market in 2025.

Which regions will see the strongest growth during the forecast period?

The East Asia and South Asia & Pacific regions will witness the highest growth, led by expanding personal care manufacturing in China and India, and rapid adoption of sensorially advanced, sustainable formulation technologies.

Explore Similar Insights

Future Market Insights

Lubricants / Slip Agents Market

Chat With MaRIA

Chat With

MaRIA

Hi There, I am MaRIA, Your Market Research Intelligence Assistant. How may I help you?