The global two-wheeler lubricants market is projected to reach USD 56.4 billion by 2035, recording an absolute increase of USD 17.3 billion over the forecast period. The market is valued at USD 39.2 billion in 2025 and is set to rise at a CAGR of 3.7% during the assessment period. As per Future Market Insights (FMI)’s chemicals outlook, widely referenced across process manufacturing studies, the overall market size is expected to grow by approximately 1.4 times during the same period, supported by expanding motorcycle and scooter parc across Asia-Pacific markets, growing demand for premium synthetic lubricants in developed regions, and increasing service frequency requirements in high-temperature and dusty operating environments globally. However, shift toward electric two-wheelers reducing lubricant consumption and extended drain interval technologies may pose challenges to market expansion.
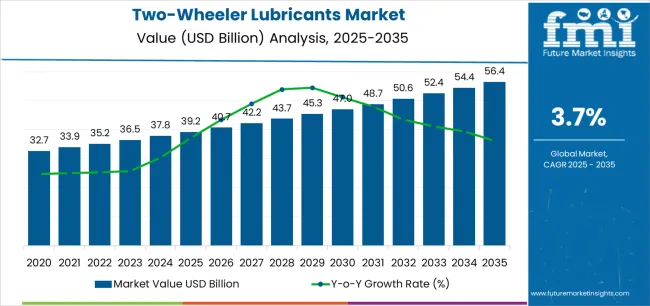
Two-Wheeler Lubricants Market Year-over-Year Forecast (2025-2035)
Between 2025 and 2030, the two-wheeler lubricants market is projected to expand from USD 39.2 billion to USD 47.0 billion, resulting in a value increase of USD 7.8 billion, which represents 45.1% of the total forecast growth for the decade. This phase of development will be shaped by rising two-wheeler ownership in emerging markets, increasing adoption of synthetic and semi-synthetic formulations for improved engine protection, product innovation in advanced additive technologies and low-viscosity engine oils, as well as expanding motorcycle taxi and delivery fleet operations driving higher service-fill frequency across urban centers. Companies are establishing competitive positions through investment in brand development, retail distribution network expansion, premium product portfolio enhancement, and strategic partnerships with original equipment manufacturers and independent workshop chains.
From 2030 to 2035, the market is forecast to grow from USD 47.0 billion to USD 56.4 billion, adding another USD 9.5 billion, which constitutes 54.9% of the overall ten-year expansion. This period is expected to be characterized by the expansion of specialized lubricant formulations including performance-oriented products for sports and premium motorcycles, strategic collaborations between lubricant manufacturers and two-wheeler OEMs for co-branded and factory-fill programs, and an enhanced focus on sustainability with bio-based and low-emission lubricant development. The growing emphasis on fuel efficiency optimization and emission compliance will drive demand for advanced, high-performance synthetic lubricants across diverse two-wheeler segments including commuter motorcycles, scooters, and performance bikes.
| Metric | Value |
|---|---|
| Market Value 2025 | USD 39.2 billion |
| Market Forecast Value 2035 | USD 56.5 billion |
| Forecast CAGR (2025-2035) | 3.7% |
The two-wheeler lubricants market grows by providing essential engine protection, friction reduction, and heat dissipation for motorcycles and scooters operating in demanding conditions including high ambient temperatures, dusty environments, and frequent stop-start urban commuting patterns that accelerate oil degradation. Two-wheeler operators face increasing pressure to maximize engine life and maintain optimal performance, with modern synthetic and semi-synthetic lubricants offering superior thermal stability, oxidation resistance, and deposit control compared to conventional mineral oils. The expansion of motorcycle and scooter ownership in emerging economies, particularly across South Asia and Southeast Asia where two-wheelers serve as primary transportation, creates sustained demand for affordable yet reliable lubricant solutions that deliver consistent protection across service intervals typically ranging from 3,000 to 6,000 kilometers.
Rising consumer awareness of synthetic lubricant benefits including improved fuel economy, extended drain intervals, and enhanced engine cleanliness drives premiumization trends in developed markets where enthusiasts and daily commuters increasingly specify high-performance products. Government emission regulations mandating cleaner-burning engines and advanced catalytic converter systems create technical requirements for low-ash, low-phosphorus formulations that protect emission control hardware while maintaining engine protection standards. The rapid growth of motorcycle-based ride-hailing services and last-mile delivery platforms in urban centers across Asia, Africa, and Latin America generates commercial demand for high-quality lubricants that minimize downtime and reduce maintenance costs for fleet operators managing hundreds or thousands of vehicles.
However, accelerating electric two-wheeler adoption in markets including China, India, and Europe may constrain long-term growth as battery-electric powertrains eliminate engine oil requirements entirely, while technological advances in synthetic base stocks and additive chemistry enable extended drain intervals that reduce lubricant consumption per vehicle over its operational lifetime.
The market is segmented by lubricant type, engine type, vehicle type, and region. By lubricant type, the market is divided into engine oil (synthetic, semi-synthetic, mineral), gear oil, suspension/fork oil, chain oil, and others. Based on engine type, the market is categorized into 4T (10W-40, 10W-30, 20W-50, other viscosities) and 2T. By vehicle type, the market is segmented into regular motorcycles, scooters/mopeds, sports & cruiser, premium motorcycles, and electric two-wheelers. Regionally, the market is divided into Asia-Pacific, Latin America, North America, Europe, Africa, and Middle East.
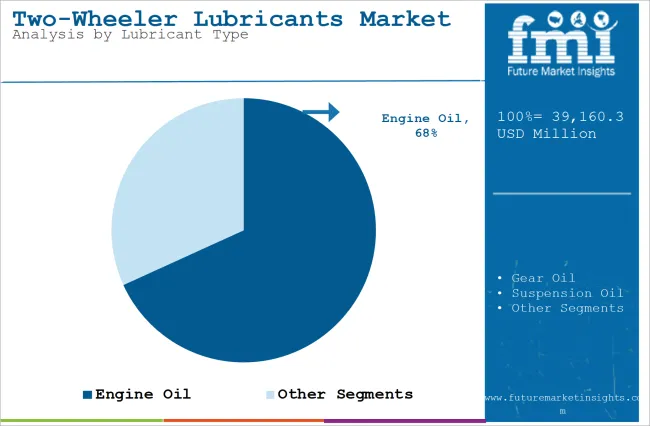
Engine oil applications dominate the two-wheeler lubricants market with approximately 68.2% market share in 2025, reflecting the critical role of crankcase lubrication in protecting pistons, rings, cylinders, and valve train components while managing combustion byproducts and preventing deposit formation. The engine oil segment's market leadership is reinforced by mandatory oil change requirements at regular service intervals, growing synthetic adoption reaching 44.0% share within the engine oil category due to superior protection characteristics, and increasing consumer awareness of lubricant quality impact on engine longevity and fuel economy. Semi-synthetic formulations capture 36.0% of engine oil demand through balanced performance and affordability positioning, while mineral oils retain 20% share primarily in price-sensitive markets and older vehicle applications.
The gear oil segment represents the second-largest application category, capturing 12.6% market share through specialized requirements for transmission protection and gear meshing efficiency in two-wheeler gearboxes. The suspension/fork oil segment accounts for 8.0% market share, serving front suspension systems requiring precise damping characteristics and consistent viscosity across temperature ranges. The chain oil segment captures 6.1% market share through specialized chain lubrication requirements, while other applications including brake fluid and coolants represent 5.1% of the market.
Key market dynamics supporting application growth include:
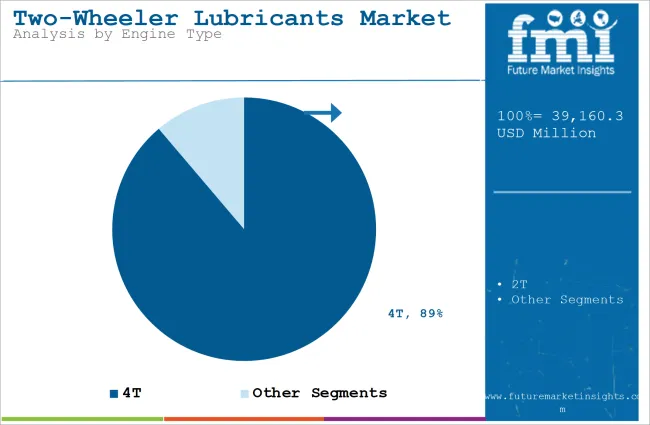
The 4T (four-stroke) engine type segment dominates the two-wheeler lubricants market with approximately 88.8% market share in 2025, driven by widespread four-stroke engine adoption across modern motorcycles and scooters offering superior fuel efficiency, lower emissions, and quieter operation compared to two-stroke alternatives.
Four-stroke engines utilize separate lubrication systems requiring dedicated crankcase oils changed at regular intervals, creating sustained lubricant demand across vehicle lifespan and driving specification development for viscosity grades optimized for different operating conditions and climate zones. The segment's leadership is reinforced by regulatory phase-out of two-stroke engines in major markets due to emission concerns, ongoing technology development improving four-stroke efficiency and performance, and OEM focus on four-stroke platforms across all vehicle categories from entry-level commuters to premium sport bikes.
Within the 4T segment, 10W-40 viscosity grade captures 35.0% share through optimal balance of cold-start protection and high-temperature stability suitable for tropical and moderate climates. The 10W-30 grade accounts for 28.0% share with advantages in fuel economy and cold-weather performance, while 20W-50 maintains 22.0% share serving older engines and high-temperature applications. Other viscosity grades including 5W-30, 15W-40, and specialty formulations represent 15.0% of the segment.
The 2T (two-stroke) segment maintains 11.2% market share, serving legacy two-stroke motorcycles and scooters still operating in developing markets, small-displacement utility vehicles, and performance applications including racing and off-road use where power-to-weight advantages outweigh emission concerns.
Key factors driving 4T segment dominance include:
The market is driven by three concrete demand factors tied to vehicle population growth and service requirements. First, expanding two-wheeler parc across emerging markets creates sustained lubricant consumption, with Asia-Pacific region accounting for over 70% of global two-wheeler ownership and annual sales exceeding 50 million units, requiring regular lubricant changes averaging 3-4 times annually depending on usage intensity and environmental conditions. Markets including India, Indonesia, Vietnam, and Philippines demonstrate particular strength with combined two-wheeler populations exceeding 300 million units, generating consistent aftermarket demand for affordable yet reliable engine oils, transmission lubricants, and specialty products. Second, premiumization trends in developed and emerging markets drive synthetic and semi-synthetic adoption, with riders increasingly willing to invest in high-performance lubricants offering benefits including improved fuel economy (1-3% typical improvement), extended drain intervals (50-100% extension versus mineral oils), enhanced engine cleanliness, and superior protection under severe operating conditions.
Market restraints include accelerating electric two-wheeler adoption particularly in China (world's largest electric two-wheeler market with over 30 million annual sales) and emerging EV programs in India, Europe, and Southeast Asia that eliminate engine oil requirements entirely while requiring only minimal lubrication for gearboxes and bearings. Extended drain interval technologies including synthetic base stocks and advanced additive packages reduce lubricant consumption per vehicle, with modern synthetic formulations enabling service intervals extending from traditional 3,000-kilometer standards to 6,000-10,000 kilometers depending on application and operating conditions. Price volatility for base oil feedstocks (Group I, II, III mineral and synthetic bases) and additive components can compress margins during periods of crude oil price increases or supply chain disruption affecting lubricant manufacturers and end users.
Key trends indicate continued synthetic lubricant penetration growth, particularly in 4T segment where synthetic share is projected to exceed 50% by 2030 driven by performance advantages, OEM recommendations, and declining price premiums as production scale increases. Low-viscosity lubricant development accelerates with grades including 0W-20 and 5W-30 gaining share through fuel economy benefits and compatibility with modern engine designs featuring tighter clearances and advanced materials. Motorcycle-specific formulation emphasis strengthens as manufacturers discontinue shared motorcycle-car oil specifications in favor of dedicated JASO MA, JASO MB, and proprietary OEM standards addressing unique two-wheeler requirements including wet clutch compatibility, high-RPM operation, and integrated transmission lubrication. Sustainability initiatives drive bio-based lubricant development and recycling program expansion, with select manufacturers introducing products incorporating renewable base stocks and extended-life formulations reducing waste generation. Digital distribution channels expand through e-commerce platforms and mobile service apps, particularly in markets including India, Southeast Asia, and Latin America where smartphone penetration enables direct-to-consumer sales and doorstep oil change services.
| Country | CAGR (2025-2035) |
|---|---|
| India | 4.9% |
| Indonesia | 4.4% |
| Vietnam | 4.8% |
| Brazil | 4.2% |
| China | 3.6% |
| Nigeria | 6.1% |
| USA | 2.7% |
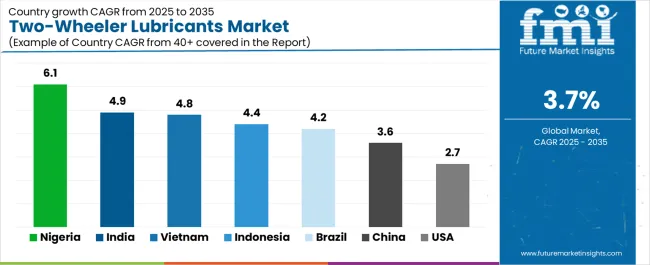
The two-wheeler lubricants market is gaining momentum worldwide, with India taking the lead thanks to very large motorcycle and scooter parc combined with frequent service intervals required in hot and dusty operating conditions driving sustained lubricant consumption. Close behind, Indonesia benefits from dense scooter usage in urban commutes and high service-fill dependence, positioning itself as a strategic growth market in the Asia-Pacific region. Vietnam shows steady advancement, where rising scooter penetration and delivery fleets strengthen its role in Southeast Asian market expansion.
Brazil is focusing on strong motorcycle use beyond metropolitan areas and expansion of independent workshop networks, signaling an ambition to capitalize on growing opportunities in Latin American markets. Meanwhile, China stands out for its huge vehicle parc with shift toward higher-specification synthetics under tighter emission norms, and Nigeria and the USA continue to record consistent progress in fast-growing motorcycle taxi operations and stable leisure/sport segment demand respectively. Together, India and Indonesia anchor the global expansion story, while the rest build stability and diversity into the market's growth path.
The report covers an in-depth analysis of 40+ countries; 7 top-performing countries are highlighted below.
India demonstrates the strongest growth potential in the Two-Wheeler Lubricants Market with a CAGR of 4.9% through 2035. The country's leadership position stems from very large motorcycle and scooter parc exceeding 200 million units, frequent service intervals necessitated by hot and dusty operating conditions across most regions, and expanding middle-class adoption of premium synthetic and semi-synthetic lubricants offering superior engine protection and fuel economy benefits.
Growth is concentrated in major metropolitan areas including Mumbai, Delhi, Bangalore, Chennai, and Hyderabad, alongside tier-2 and tier-3 cities where two-wheelers serve as primary family transportation and commercial delivery platforms. Distribution channels through extensive dealer networks, quick-lube chains, neighborhood mechanics, and growing e-commerce platforms expand product availability across urban and rural markets. The country's Bharat Stage VI emission standards mandate advanced engine technologies requiring specialized lubricant formulations, while rising disposable incomes support premiumization trends favoring branded synthetic products.
Key market factors:
In Jakarta, Surabaya, Bandung, and Medan, the adoption of premium two-wheeler lubricants is accelerating across dense scooter populations, delivery fleets, and motorcycle taxi operations, driven by high service-fill dependence and increasing quality awareness among riders prioritizing engine protection. The market demonstrates strong growth momentum with a CAGR of 4.4% through 2035, linked to urbanization trends concentrating scooter usage in traffic-congested cities requiring frequent idling and stop-start operation that stresses lubricant performance.
Indonesian riders and fleet operators are implementing regular maintenance programs and upgrading to semi-synthetic formulations to enhance protection while meeting service interval requirements typically ranging from 2,000-4,000 kilometers in severe urban operating conditions. The country's tropical climate creates sustained demand for high-temperature stability, while expanding middle class supports premiumization trends favoring recognized international and regional brands.
Key development areas:
Vietnam's expanding two-wheeler market demonstrates sophisticated implementation of synthetic and semi-synthetic lubricants, with documented applications supporting commuter scooters, delivery platforms, and premium motorcycles requiring enhanced protection characteristics.
The country's urban centers in Hanoi, Ho Chi Minh City, Da Nang, and Can Tho showcase integration of modern lubricant products with growing service network infrastructure, leveraging expertise in high-frequency maintenance typical of Southeast Asian markets. Vietnamese riders emphasize value and reliability, creating demand for mid-tier semi-synthetic formulations that deliver improved protection versus mineral oils at accessible price points suitable for daily commuter budgets. The market maintains strong growth through rising scooter penetration and delivery fleet expansion, with a CAGR of 4.8% through 2035.
Market characteristics:
Brazil's market expansion is driven by diverse motorcycle demand including commuter bikes in São Paulo and Rio de Janeiro, widespread motorcycle use in interior regions for personal transportation and commercial applications, and expansion of independent workshop networks providing maintenance services across urban and rural areas. The country demonstrates promising growth potential with a CAGR of 4.2% through 2035, supported by large installed motorcycle parc exceeding 20 million units and consistent aftermarket service requirements.
Brazilian riders face implementation challenges related to economic volatility affecting discretionary maintenance spending and competitive pricing pressure from economy-tier mineral oils, requiring value demonstration and financing programs. However, growing middle class and expanding delivery platform operations create compelling business cases for synthetic and semi-synthetic adoption, particularly in metropolitan areas where riders recognize protection benefits and total cost of ownership advantages.
Key factors:
The Chinese market leads in established two-wheeler production infrastructure based on comprehensive domestic manufacturing capabilities, massive vehicle parc exceeding 150 million units, and sophisticated lubricant formulation requirements supporting advanced emission standards. The country shows solid growth potential with a CAGR of 3.6% through 2035, driven by shift toward higher-specification synthetics under tighter emission norms including China 6 standards and ongoing technology development improving engine efficiency and reducing lubricant consumption through extended drain intervals.
Chinese manufacturers and riders are upgrading lubricant specifications for improved environmental compliance and engine protection, particularly in premium motorcycle and scooter segments where synthetic adoption exceeds 60% driven by OEM requirements and consumer quality expectations. Technology deployment channels through extensive OEM dealer networks, quick-lube chains, and e-commerce platforms expand coverage across tier-1 through tier-4 cities.
Leading market segments:
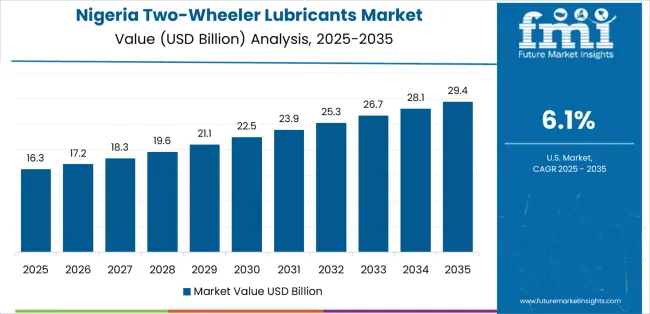
In Lagos, Kano, Ibadan, and Port Harcourt, motorcycle taxi operations (okada) and delivery services are implementing regular maintenance programs using accessible lubricant products, with documented applications supporting commercial fleet requirements for reliable protection minimizing breakdown risk and operational disruption. The market shows exceptional growth potential with a CAGR of 6.1% through 2035, linked to fast growth of motorcycle taxis providing essential urban transportation and rising maintenance spend as riders recognize lubricant quality impact on engine durability and operating costs.
Nigerian operators emphasize affordability and widespread availability, creating demand for mineral and economy semi-synthetic formulations distributed through dense networks of spare parts shops and informal mechanics serving commercial and private riders. The country's tropical climate and challenging road conditions necessitate frequent service intervals, while expanding middle class supports gradual premiumization toward recognized branded products.
Market development factors:
The U.S. market leads in established performance motorcycle and cruiser segments based on comprehensive dealership infrastructure, sophisticated lubrication requirements for large-displacement V-twin and inline-four engines, and mature aftermarket distribution through powersports dealers, automotive retail chains, and online channels. The country shows moderate growth potential with a CAGR of 2.7% through 2035, driven by stable leisure/sport segments including touring, cruiser, and sport bike categories where riders prioritize premium synthetics offering maximum protection for high-value machines.
American riders demand extended drain intervals enabled by advanced synthetic formulations, with typical service requirements extending to 8,000-12,000 miles compared to 3,000-6,000 kilometers common in Asian markets, reducing consumption per vehicle but supporting premium product positioning. Technology deployment channels through Harley-Davidson, BMW, Honda, and other OEM dealer networks establish brand loyalty and specification compliance.
Key characteristics:
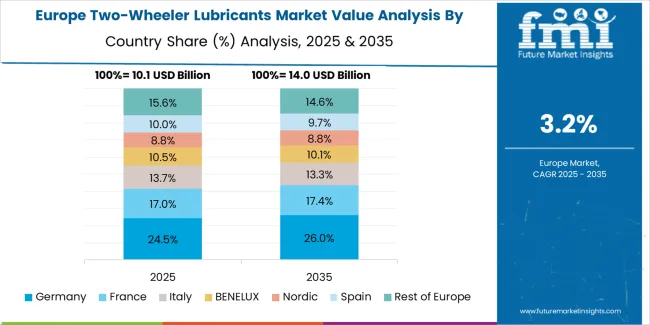
The two-wheeler lubricants market in Europe is projected to grow from USD 3.8 billion in 2025 to USD 5.2 billion by 2035, registering a CAGR of 3.2% over the forecast period. Western Europe accounts for the largest share of European two-wheeler lubricants demand, led by Germany approximately 21% where commuter bikes and premium tourers underpin sustained service-fill demand and synthetic adoption driven by technical sophistication and quality emphasis.
The United Kingdom follows with approximately 13% market share, driven by strong leisure/sport and delivery-fleet usage with quick-lube retail networks and established motorcycle service infrastructure. France holds approximately 14% share, balancing commuter scooter operations with sport touring applications and enthusiast segments. Italy commands approximately 16% market share through high scooter density in cities including Rome, Milan, and Naples, plus OEM-dealer service ecosystems supporting Vespa, Piaggio, and Ducati marques. Spain accounts for approximately 11%, emphasizing scooters for urban mobility and last-mile delivery platforms expanding across Barcelona, Madrid, and coastal cities.
The Nordic region represents approximately 8% collectively, led by Sweden and Denmark, where markets favor premium synthetics and extended drains for cold-start protection enabling year-round riding in challenging winter conditions. Benelux countries capture approximately 7%, supported by concentrated urban parc in Amsterdam, Brussels, and Luxembourg plus dense aftermarket distribution networks serving both local residents and touring riders. The remaining approximately 10% is distributed across Central & Eastern Europe, notably Poland, Czechia, and Romania, where growth is tied to rising scooter adoption for urban commuting, courier service expansion, and modernization of workshop networks upgrading from economy to mid-tier lubricant products.
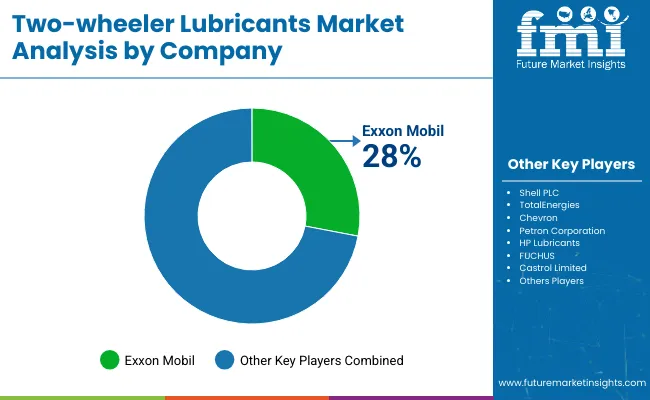
The Two-Wheeler Lubricants Market features approximately 30-40 meaningful players with moderate concentration, where the leading company Shell PLC holds approximately 14.5% of global market share, while the top five companies collectively control roughly 45-52% of the market through established brand recognition, extensive distribution networks, and deep OEM relationships spanning motorcycle and scooter manufacturers worldwide. Competition centers on brand equity, product performance verification, technical support capabilities, and comprehensive distribution infrastructure rather than price competition alone, with premium segments particularly resistant to economy-tier substitution given rider emphasis on engine protection and proven reliability.
Market leaders include Shell PLC (Shell Advance, Shell Helix), Exxon Mobil (Mobil 1 Racing, Mobil Super Moto), and TotalEnergies (Total Quartz, Total Hi-Perf), which maintain competitive advantages through comprehensive motorcycle lubricant portfolios, global manufacturing and distribution networks, extensive technical research and development capabilities supporting product innovation, and deep OEM partnerships including factory-fill programs and co-branded specifications with major two-wheeler manufacturers. These companies leverage economies of scale in base oil procurement and additive purchasing, research and development facilities enabling formulation optimization, and ongoing customer relationships built through decades of market presence defending market positions while expanding into emerging segments including synthetic motorcycle oils and specialized performance products.
Challengers encompass BP Castrol (Castrol Power1, Castrol Activ) and Chevron (Havoline, Delo), which compete through strong regional market presence particularly in Asia-Pacific and established distribution relationships serving OEM dealers and independent workshops. Regional specialists including Petronas Lubricants International (Petronas Sprinta, Petronas Syntium), FUCHS (Silkolene, Motorex), and Idemitsu Kosan focus on specific geographical markets or performance applications, offering differentiated capabilities in racing-proven formulations, customized viscosity grades, and localized technical support programs. Performance-oriented brands including Repsol (Moto Racing, Moto Sport), Gulf Oil Lubricants, and Motul create competitive pressure through motorsports heritage, enthusiast community engagement, and premium positioning emphasizing maximum protection and proven competition track records.
Market dynamics favor companies that combine reliable product performance meeting or exceeding OEM specifications with comprehensive distribution networks reaching OEM dealerships, multi-brand service chains, independent mechanics, and retail outlets, supported by technical support offerings including training programs for service technicians, application guides for proper product selection, and marketing programs building brand awareness among riders. Recent industry developments including Shell Lubricants India's upgraded Shell Advance motorcycle oils portfolio featuring new AX7 Synthetic Technology with Flexi Molecule Technology (April 2024) and Nandan Petrochem's launch of new synthetic motorcycle oil range tailored to high-performance bikes in India (February 2024) demonstrate ongoing investment in product innovation and market position strengthening.
Two-wheeler lubricants represent essential maintenance products that enable motorcycle and scooter riders to protect engines, transmissions, and drivetrain components while optimizing performance, fuel efficiency, and component longevity across diverse operating conditions including urban commuting, highway touring, and performance applications. With the market projected to grow from USD 39.2 billion in 2025 to USD 56.5 billion by 2035 at a 3.7% CAGR, these lubricant solutions offer compelling advantages including proven engine protection, friction reduction delivering fuel economy benefits, and thermal management preventing overheating, making them essential for regular motorcycles (49.0% vehicle type share), scooters/mopeds (31.0% share), and sports & cruiser segments seeking reliable maintenance solutions supporting vehicle longevity and optimal operation. Scaling market adoption and technological advancement requires coordinated action across emission policy frameworks, technical standards development, lubricant manufacturers, motorcycle OEMs, distribution networks, and sustainable chemistry research initiatives.
How Governments Could Spur Local Production and Adoption?
Emission Standards Enforcement: Implement stringent emission regulations (Euro 5, Bharat Stage VI equivalents) mandating advanced engine technologies requiring specialized low-SAPS lubricants, provide incentives for domestic lubricant manufacturing facilities producing emission-compliant formulations, and establish testing infrastructure validating lubricant compatibility with catalytic converter and oxygen sensor systems protecting emission control hardware.
Quality Standards Certification: Establish national testing facilities for lubricant quality verification including viscosity, oxidation stability, and wear protection characteristics, develop certification programs for products meeting JASO MA, JASO MB, and API specifications, and create international standards harmonization facilitating export of compliant lubricant products to regional and global markets.
Distribution Infrastructure Support: Provide incentives for quick-lube chain expansion and authorized service center development, support e-commerce platform integration enabling direct-to-consumer sales and doorstep service programs, and establish quality assurance frameworks ensuring product authenticity and preventing counterfeit lubricant distribution protecting consumers and legitimate manufacturers.
Consumer Education Programs: Promote awareness campaigns emphasizing proper lubricant selection, regular maintenance intervals, and synthetic product benefits through public service messaging, support training programs for mechanics and service technicians on proper application techniques and specification compliance, and establish consumer protection frameworks ensuring transparent labeling and accurate performance claims.
Sustainable Chemistry Initiatives: Support research into bio-based lubricant development utilizing renewable feedstocks, provide incentives for extended-life formulation development reducing waste generation, and establish recycling infrastructure for used oil collection and reprocessing protecting environmental quality and recovering valuable base stocks.
How Industry Bodies Could Support Market Development?
Technical Specification Standards: Define standardized performance requirements for different motorcycle categories including commuter, sport, touring, and off-road applications across engine oil (68.2% lubricant type dominance), gear oil, and specialty product categories, enabling reliable formulation development and cross-manufacturer compatibility supporting consumer confidence.
Quality Assurance Frameworks: Develop comprehensive testing methodologies for wear protection, oxidation stability, thermal degradation, and deposit control characteristics, establish certification programs ensuring product consistency across manufacturing batches and distribution channels, and create performance verification databases allowing consumers and service providers to validate specification compliance.
Application Guidelines: Create standardized drain interval recommendations based on vehicle type, usage patterns, and operating environment severity, develop viscosity selection guides for different climate zones and temperature ranges, and establish proper disposal protocols for used lubricants protecting environmental quality and worker safety.
Technical Training Programs: Establish education initiatives for service technicians, dealership mechanics, and independent workshop owners on optimal lubricant selection, proper application techniques, and troubleshooting procedures identifying lubrication-related issues, supporting professional competency development and service quality consistency.
How OEMs and Technology Players Could Strengthen the Ecosystem?
Advanced Formulation Development: Develop high-performance synthetic lubricants meeting stringent OEM specifications for modern four-stroke engines, create specialized products for different applications including fuel-efficient commuter formulations and maximum-protection sport bike oils, and offer proprietary additive technologies delivering differentiated benefits in wear protection, friction reduction, and oxidation resistance.
Factory-Fill Programs: Establish co-branded lubricant programs with motorcycle manufacturers specifying products for factory fill and dealer service networks, provide technical collaboration supporting formulation optimization for specific engine designs and operating requirements, and create integrated service packages bundling lubricants with maintenance programs and extended warranty coverage.
Distribution Network Development: Build comprehensive retail presence through OEM dealerships, multi-brand service chains, automotive retail outlets, and e-commerce platforms, provide point-of-sale materials and consumer education tools supporting informed product selection, and establish professional installer networks ensuring proper application and specification compliance.
Digital Service Integration: Develop mobile applications enabling riders to track maintenance intervals, receive service reminders, and order products for doorstep delivery or service appointment scheduling, create digital product authentication systems preventing counterfeit distribution, and provide online technical resources including specification guides and frequently asked questions supporting consumer self-service.
How Suppliers Could Navigate the Shift?
Application-Focused Product Portfolios: Develop specialized formulation lines for 4T engines (88.8% engine type dominance) including optimal viscosity grades (10W-40, 10W-30, 20W-50), 2T applications serving legacy vehicles and performance segments, and specialty products for gear oil, fork oil, and chain lubrication requirements, with each product optimized for specific performance requirements and price positioning.
Geographic Market Strategy: Establish production and distribution capabilities in high-growth markets like India (4.9% CAGR), Indonesia (4.4% CAGR), and Vietnam (4.8% CAGR) capturing expanding demand, while maintaining strong presence in established markets like USA (2.7% CAGR) and Europe supporting stable customer relationships and premium product positioning.
Formulation Differentiation: Invest in synthetic lubricant development (44.0% share within engine oil segment) offering proven performance advantages, develop semi-synthetic products (36.0% share) balancing protection and affordability for mass market appeal, and maintain mineral oil portfolios (20.0% share) serving price-sensitive segments and older vehicle applications.
Brand Building Programs: Develop motorsports sponsorships and racing programs demonstrating product performance under extreme conditions, create enthusiast community engagement through social media, motorcycle events, and riding clubs building brand loyalty, and establish technical authority through educational content, specification guides, and application support building professional credibility.
How Investors and Financial Enablers Could Unlock Value?
Production Capacity Investment: Finance established lubricant companies like Shell PLC, Exxon Mobil, and TotalEnergies for synthetic base stock production expansion, additive manufacturing capabilities, and regional blending plant development supporting local market service and cost optimization.
Distribution Infrastructure Development: Provide capital for quick-lube chain rollout, e-commerce platform development, and last-mile logistics capabilities enabling convenient consumer access, support independent workshop network development providing technical training and equipment financing, and enable retail expansion through automotive aftermarket chains and motorcycle dealership partnerships.
Technology Development: Back companies developing advanced additive technologies, bio-based lubricant formulations utilizing renewable feedstocks, and extended-life products reducing maintenance frequency and waste generation, supporting competitive differentiation and sustainability positioning.
Market Consolidation: Support strategic acquisitions enabling regional market access, product portfolio complementarity, and distribution network expansion, finance joint ventures between international lubricant manufacturers and regional specialists combining global technical capabilities with local market knowledge, and enable supply chain integration creating comprehensive solutions providers serving OEM factory-fill, dealer service, and aftermarket distribution channels.
| Item | Value |
|---|---|
| Quantitative Units | USD 39.2 billion |
| Lubricant Type | Engine Oil (Synthetic, Semi-synthetic, Mineral), Gear Oil, Suspension/Fork Oil, Chain Oil, Others |
| Engine Type | 4T (10W-40, 10W-30, 20W-50, Other Viscosities), 2T |
| Vehicle Type | Regular Motorcycles, Scooters/Mopeds, Sports & Cruiser, Premium Motorcycles, Electric Two-Wheelers |
| Regions Covered | Asia-Pacific, Latin America, North America, Europe, Africa, Middle East |
| Country Covered | India, Indonesia, Vietnam, Brazil, China, Nigeria, USA, and 40+ countries |
| Key Companies Profiled | Shell PLC, Exxon Mobil, TotalEnergies, BP Castrol, Chevron, Petronas Lubricants International, FUCHS, Idemitsu Kosan, Repsol, Gulf Oil Lubricants, Motul |
| Additional Attributes | Dollar sales by lubricant type, engine type, and vehicle type categories; regional adoption trends across Asia-Pacific, Latin America, and emerging markets; competitive landscape with international majors and regional specialists; application requirements and OEM specifications; integration with motorcycle service networks and aftermarket distribution; innovations in synthetic base stock technology and advanced additive packages; development of specialized formulations with emission compliance and extended drain capabilities |
Lubricant Type
The global two-wheeler lubricants market is estimated to be valued at USD 39.2 billion in 2025.
The market size for the two-wheeler lubricants market is projected to reach USD 56.4 billion by 2035.
The two-wheeler lubricants market is expected to grow at a 3.7% CAGR between 2025 and 2035.
The key product types in two-wheeler lubricants market are engine oil, gear oil, suspension/fork oil, chain oil and others.
In terms of engine type, 4t segment to command 88.8% share in the two-wheeler lubricants market in 2025.


Full Research Suite comprises of:
Market outlook & trends analysis
Interviews & case studies
Strategic recommendations
Vendor profiles & capabilities analysis
5-year forecasts
8 regions and 60+ country-level data splits
Market segment data splits
12 months of continuous data updates
DELIVERED AS:
PDF EXCEL ONLINE
Lubricants / Slip Agents Market Size and Share Forecast Outlook 2025 to 2035
Lubricants for Cement Industry Market
Firearm Lubricants Market Demand & Growth 2025 to 2035
Plastic Lubricants Market
Market Share Distribution Among Forestry Lubricants Manufacturers
Aviation Lubricants Market
Wire Rope Lubricants Market Size and Share Forecast Outlook 2025 to 2035
Synthetic Lubricants and Functional Fluids Market - Growth & Demand 2025 to 2035
Bio-Based Lubricants Market
Open Gear Lubricants Market
Industrial Lubricants Industry Analysis in India - Growth Trends, Regional Insights 2025 to 2035
Hydropower Lubricants Market
Agricultural Lubricants Market Growth – Trends & Forecast 2024 to 2034
Textile Machine Lubricants Market Size and Share Forecast Outlook 2025 to 2035
High Performance Lubricants Market
Europe Industrial Lubricants Market: Growth, Trends, and Forecast 2025 to 2035
Cold Rolling Oils/Lubricants Market Size & Growth 2025 to 2035
Aluminum Extrusion Lubricants Market
Automotive Die-casting Lubricants Market – Size, Share, and Forecast 2025 to 2035

Thank you!
You will receive an email from our Business Development Manager. Please be sure to check your SPAM/JUNK folder too.
Chat With
MaRIA