The enterprise IoT market is estimated to be valued at USD 760.3 million in 2025 and is projected to reach USD 2580.9 million by 2035, registering a compound annual growth rate (CAGR) of 13.0% over the forecast period. The market experiences exceptional expansion driven by digital transformation initiatives, operational efficiency optimization, and data-driven decision making requirements that necessitate comprehensive sensor networks capable of monitoring assets, processes, and environments while providing real-time insights throughout complex business operations.
Enterprise organizations implement IoT ecosystems that integrate manufacturing equipment, supply chain logistics, facility management, and workforce tracking systems within unified platforms that enable predictive analytics and automated responses to operational conditions. The industry's evolution toward intelligent enterprise architectures creates demand for scalable IoT solutions that coordinate edge computing, cloud analytics, and machine learning algorithms while ensuring cybersecurity and regulatory compliance throughout mission-critical business applications.
Manufacturing operations represent the largest deployment segment where Industrial IoT systems enable predictive maintenance, quality monitoring, and production optimization through sensor-equipped machinery that provides real-time performance data and condition monitoring throughout complex manufacturing processes.
Factory managers utilize connected equipment networks that predict equipment failures before they occur while optimizing production schedules and resource allocation based on demand forecasts and capacity constraints. Quality assurance protocols emphasize sensor accuracy, data integrity, and system reliability that ensure consistent manufacturing outcomes while supporting regulatory compliance and customer satisfaction throughout diverse industrial applications.
Supply chain and logistics markets demonstrate accelerating adoption of IoT tracking systems for inventory management, fleet monitoring, and warehouse automation that provide end-to-end visibility throughout global distribution networks while optimizing delivery performance and reducing operational costs.
Logistics managers implement asset tracking solutions that monitor shipment location, environmental conditions, and delivery status while providing exception alerts and automated responses to supply chain disruptions. Cold chain monitoring applications ensure temperature-sensitive products maintain quality throughout transportation while providing compliance documentation necessary for pharmaceutical and food distribution operations.
Smart building applications create substantial market segments requiring IoT sensors for energy management, space utilization, and facility maintenance that optimize building performance while reducing operational costs and improving occupant comfort throughout commercial real estate properties.
Facility managers utilize integrated building management systems that coordinate HVAC controls, lighting systems, and security infrastructure while providing energy consumption analytics and predictive maintenance scheduling. Environmental monitoring systems track air quality, occupancy patterns, and equipment performance while supporting sustainability initiatives and regulatory compliance requirements.
Data governance policies address privacy protection and analytics capabilities while ensuring compliance with regulatory requirements and industry standards governing data collection and usage throughout enterprise IoT implementations requiring careful balance between operational insights and privacy protection in complex regulatory environments affecting diverse business operations.
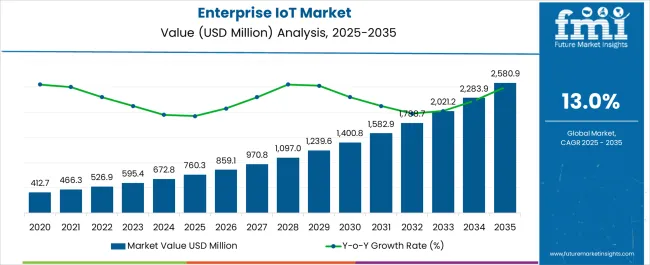
| Metric | Value |
|---|---|
| Enterprise IoT Market Estimated Value in (2025 E) | USD 760.3 million |
| Enterprise IoT Market Forecast Value in (2035 F) | USD 2580.9 million |
| Forecast CAGR (2025 to 2035) | 13.0% |
The enterprise IoT market is expanding rapidly due to the increasing need for connected infrastructure, operational efficiency, and real time monitoring across diverse industries. Growing investments in digital transformation strategies and the rising adoption of smart sensors, gateways, and connected platforms are enhancing enterprise productivity.
The integration of artificial intelligence and edge computing into IoT ecosystems is enabling predictive maintenance, improved decision making, and reduced downtime for enterprises. Regulatory support for data security and smart infrastructure deployment is also fueling market adoption.
With enterprises striving for competitive advantage through automation and connectivity, the outlook remains strong. Future opportunities are expected to emerge from industrial automation, cross industry interoperability, and scalable cloud enabled IoT platforms that address enterprise wide challenges in efficiency and performance.
The market is segmented by Component, Enterprise Type, and End-use and region. By Component, the market is divided into Hardware, Software & Solutions, and Services. In terms of Enterprise Type, the market is classified into Small & Medium Sized Enterprise and Large Enterprise. Based on End-use, the market is segmented into Manufacturing, Oil & Gas, Utilities, Transport, BFSI, IT & Telecomm, Healthcare, and Others. Regionally, the market is classified into North America, Latin America, Western Europe, Eastern Europe, Balkan & Baltic Countries, Russia & Belarus, Central Asia, East Asia, South Asia & Pacific, and the Middle East & Africa.
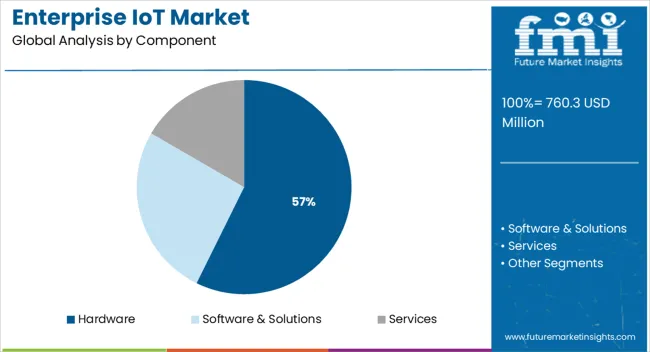
The hardware component segment is projected to contribute 57.30% of the total market revenue by 2025, making it the dominant category. Growth in this segment is driven by rising demand for sensors, controllers, and connected devices that form the foundation of enterprise IoT systems.
Hardware plays a critical role in data acquisition, device connectivity, and process monitoring, making it indispensable for IoT infrastructure. Increasing deployment of smart machinery and automated systems in enterprise operations has further strengthened reliance on hardware solutions.
As enterprises scale IoT adoption, investments in advanced and durable hardware remain a priority, reinforcing this segment’s leadership.
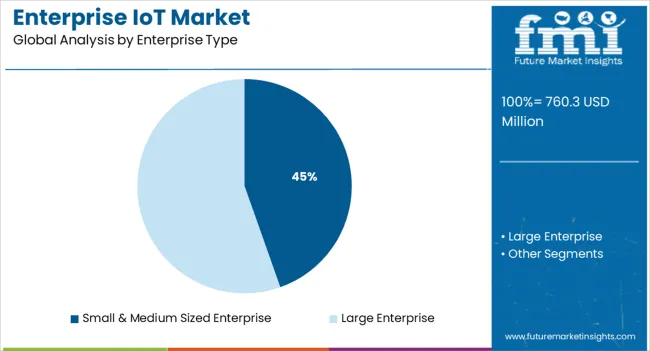
The small and medium sized enterprise segment is expected to hold 44.60% of market revenue by 2025 within the enterprise type category, establishing it as a key contributor. This prominence is driven by cost effective IoT solutions that improve operational agility, productivity, and competitive advantage for smaller businesses.
The availability of cloud based platforms, plug and play hardware, and subscription based models has enabled SMEs to deploy IoT at lower upfront costs. Additionally, IoT adoption is being encouraged by the need for process optimization, asset tracking, and real time insights, which are increasingly critical for scaling operations.
These drivers continue to support the significant share of SMEs in the enterprise IoT market.
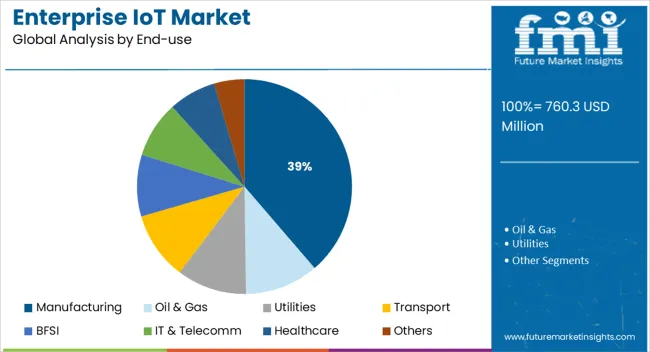
The manufacturing end use segment is projected to account for 38.70% of total market revenue by 2025, making it the largest vertical within the market. This growth is being fueled by the widespread adoption of IoT enabled automation, predictive maintenance, and supply chain optimization.
Manufacturers are leveraging IoT to enhance efficiency, reduce downtime, and ensure quality control through real time monitoring of production lines and equipment. The segment has also been supported by the emergence of Industry 4.0 initiatives and government incentives promoting smart factories.
As enterprises focus on cost reduction and digital transformation, the manufacturing sector remains at the forefront of IoT adoption, consolidating its position as the leading end use category.
The growing demand for connected devices is a major trend driving the growth of the enterprise IoT industry. The increasing adoption of IoT technology in various industries is leading to the proliferation of connected devices, which are being used to collect and transmit data, enabling real-time monitoring and control of various processes.
Big data analytics is another key trend driving the growth of the enterprise IoT industry. The vast amounts of data generated by connected devices are being used to gain insights and improve decision-making in various industries, including manufacturing, healthcare, and transportation.
Cloud computing is also playing a crucial role in the growth of the enterprise IoT industry. Cloud-based services are being used to store, process, and analyze the large amounts of data generated by connected devices, providing enterprises with the scalability and flexibility they need to manage the growth of their IoT deployments.
The increasing adoption of IoT technology in the healthcare and manufacturing industries is expected to drive the growth of the enterprise IoT industry. IoT-enabled devices and systems are being used to improve patient care and increase efficiency in healthcare, while in manufacturing, IoT-enabled systems are being used to optimize production processes and improve supply chain management.
| Report Attributes | Details |
|---|---|
| Enterprise IoT Market Value (2025) | USD 595.42 billion |
| Enterprise IoT Market CAGR (2025 to 2035) | 13% |
| Anticipated Enterprise IoT Market Value (2035) | USD 2,021.19 billion |
According to Future Market Insights, the enterprise IoTs industry has been on a steady growth trajectory, with a CAGR of 11% from USD 412.7 billion in 2020 to USD 760.3 billion in 2025.
Governments around the world are investing in smart city initiatives to improve the quality of life for citizens and increase the efficiency of public services. This includes the deployment of IoT-enabled systems for transportation, energy management, and public safety, which is likely to drive the growth of the enterprise IoT industry.
| Attribute | Valuation |
|---|---|
| 2025 | USD 760.29 billion |
| 2035 | USD 1097.02 billion |
| 2035 | USD 1788.66 billion |
The market is anticipated to rise at a CAGR of 13% from 2025 to 2035, surpassing USD 2,021.19 billion by 2035.
Short term (2025 to 2025): The retail sector is increasingly adopting IoT-enabled systems for inventory management, which allows them to track products in real time, improve supply chain management, and reduce costs. This trend is expected to continue in the short term, driving the growth of the enterprise IoT industry.
The hardware segment accounted for the largest revenue share of more than 45% in 2025 and is likely to dominate the market over the forecast period. The hardware for enterprise IoT includes sensors, switching, routers, gateways, embedded ICs, etc. The growth in the hardware segment is due to the increasing requirement for continuous access and control over IoT devices which is expected to fuel the segment's growth over the forecast period.
On the other hand, the software and solutions segment is expected to rise at the fastest rate with a CAGR of 15% during the forecast period. The widespread adoption of professional IoT services among enterprises, such as deployment and integration services, consulting services, and support and maintenance services, is one of the primary factors driving the market growth.
The small and medium-sized enterprise segment accounted for the largest market share of 68% in 2025 and is predicted to lead the market from 2025 to 2035. The segment recorded a notable market revenue of USD 760.3 billion in 2025. The increase is attributed to an increase in government initiatives to help small and medium-sized businesses expand digitally.
On the other hand, the large enterprise segment is expected to witness the highest CAGR of 15% from 2025 to 2035. The growth in this segment can be attributed to the rising use of big data and insight-based opportunistic markets for large enterprises. Furthermore, to meet the needs of multi-regional and multinational enterprises, IoT service providers are focusing on improving products and services through enhanced offerings such as business process integration and service management, which is expected to benefit the enterprise IoT industry in the long run.
The manufacturing segment registered the largest market share of 26% in 2025. The rise of the concept of industry 4.0 is a major driver of enterprise IoT manufacturing applications. The combination of cyber-physical systems, IoS (Internet of Services), and IoT creates the reality of industry 4.0 and smart factories, in which industries operate at full capacity while producing minimal waste, making it relatively sustainable.
On the other hand, the transport segment accounted for the highest CAGR of 18% over the forecast period. The enterprise IoT application is expected to transform the logistics and transport industry with the emerging use of online fleet management systems. The online fleet system provides access to onboard connectivity and real-time data, which ultimately improves transportation efficiency and safety. As a result, the benefits of IoT, such as eliminating potential delays, efficient inventory management, and improved safety through driver assistance features, among other things, drive demand in the transportation segment.
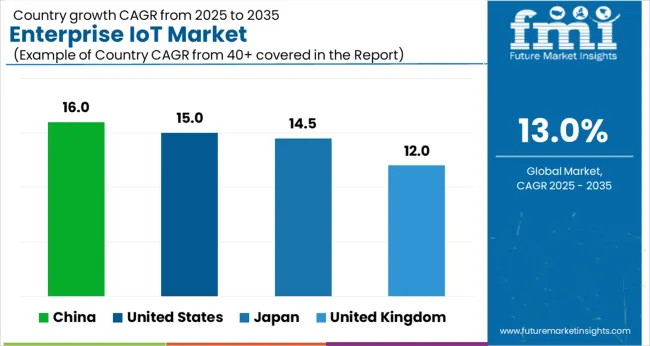
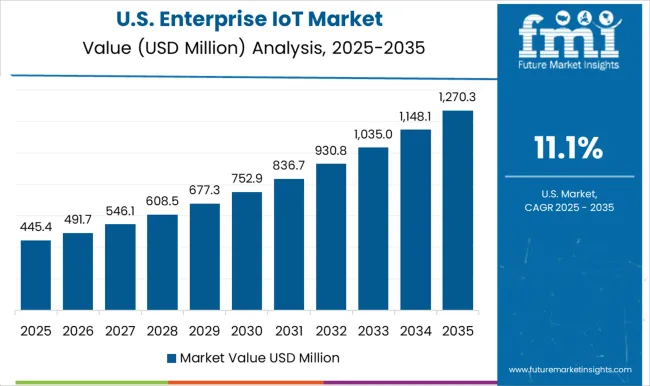
The United States enterprise IoT industry is projected to register a CAGR of over 15% from 2025 to 2035. The United States is a major player in the enterprise IoT market, with a large number of companies and organizations investing in IoT technology to improve operational efficiency and stay competitive. The US government is also promoting the adoption of IoT and other advanced technologies through various initiatives and investments, which is further propelling the market growth. The country is known for its strong technological infrastructure, which allows for the seamless integration and deployment of IoT solutions. In addition, the thriving startup ecosystem in the US is leading to the development of innovative IoT solutions and services, further driving the market growth.
The United Kingdom enterprise IoT industry is expected to register a CAGR of 12% from 2025 to 2035. The United Kingdom is a major player in the enterprise IoT market in Europe, with a large number of companies and organizations investing in IoT technology to improve operational efficiency and stay competitive. The UK government is also promoting the adoption of IoT and other advanced technologies through various initiatives and investments, which is further propelling the market growth. The country is known for its strong technological infrastructure and its desire to stay at the forefront of technological advancements. In addition, the UK's strong emphasis on data privacy and security regulations is leading to the development of secure and reliable IoT solutions.
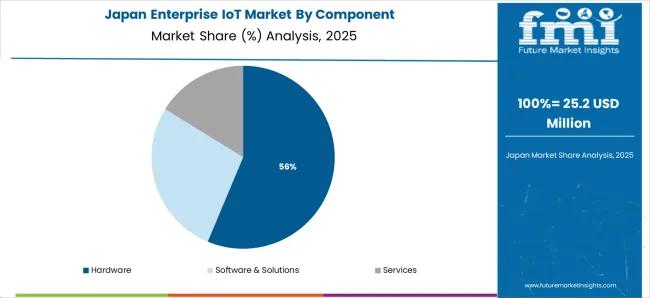
Japan's enterprise IoT industry is anticipated to rise at a CAGR of over 14.5% from 2025 to 2035. Japan is a major player in the enterprise IoT market in the Asia Pacific, with a large number of companies and organizations investing in IoT technology to improve operational efficiency and stay competitive. The country is known for its advanced technology infrastructure and its urge to adopt new technologies.
The government is also promoting the adoption of IoT and other advanced technologies through various initiatives and investments, which is further propelling the market growth. The country's industries, particularly manufacturing and transportation, have been early adopters of IoT-powered automation to improve efficiency and reduce costs. In addition, the aging population in Japan is driving the adoption of IoT in healthcare, as the technology is being used to improve patient care and monitor the health of the elderly population.
China's enterprise IoT industry is likely to register a CAGR of over 16% from 2025 to 2035. China is a major player in the enterprise IoT market in the Asia Pacific, with a large number of companies and organizations investing in IoT technology to improve operational efficiency and stay competitive. The country is known for its advanced technology infrastructure and its urge to adopt new technologies. The government is also promoting the adoption of IoT and other advanced technologies through various initiatives and investments, which is further propelling the market growth. The country's smart city initiatives, particularly in cities such as Beijing and Shanghai, are driving the adoption of IoT in transportation, energy management, and public safety. In addition, the Chinese government's "Made in China 2025" plan is promoting the adoption of IoT in manufacturing and other industries to improve efficiency and reduce costs.
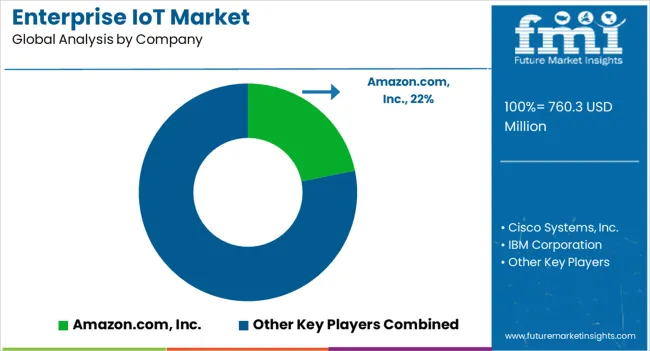
The enterprise IoT market is driven by leading technology providers offering scalable platforms that connect, monitor, and optimize industrial and business operations. Amazon Web Services, Inc. (AWS) leads with its IoT Core and Greengrass platforms, enabling secure device connectivity, edge computing, and analytics for manufacturing, logistics, and energy enterprises. Microsoft Corporation strengthens its position through Azure IoT, integrating AI, cloud, and digital twin capabilities to optimize operations and asset management.
Cisco Systems, Inc. focuses on IoT networking infrastructure and edge analytics, providing secure connectivity solutions for enterprises in transportation, energy, and smart building sectors. IBM Corporation delivers enterprise IoT through Watson IoT and Maximo platforms, combining AI and predictive analytics for equipment monitoring and maintenance. Intel Corporation contributes with edge computing hardware and IoT processors supporting industrial automation and real-time data processing.
Oracle Corporation integrates IoT with its enterprise cloud applications, enabling data-driven decision-making across supply chains and smart asset management. SAP SE offers its IoT platform as part of SAP Business Technology Suite, linking device data with enterprise resource planning and analytics systems. Siemens AG leverages its MindSphere platform to deliver industrial IoT solutions that enhance manufacturing efficiency and predictive maintenance. PTC Inc. provides the ThingWorx platform for industrial IoT, emphasizing digital twins, AR integration, and scalable connectivity for manufacturing and logistics.
The global enterprise iot market is estimated to be valued at USD 760.3 million in 2025.
The market size for the enterprise iot market is projected to reach USD 2,580.9 million by 2035.
The enterprise iot market is expected to grow at a 13.0% CAGR between 2025 and 2035.
The key product types in enterprise iot market are hardware, software & solutions and services.
In terms of enterprise type, small & medium sized enterprise segment to command 44.6% share in the enterprise iot market in 2025.


Full Research Suite comprises of:
Market outlook & trends analysis
Interviews & case studies
Strategic recommendations
Vendor profiles & capabilities analysis
5-year forecasts
8 regions and 60+ country-level data splits
Market segment data splits
12 months of continuous data updates
DELIVERED AS:
PDF EXCEL ONLINE
Enterprise Asset Management Market Size and Share Forecast Outlook 2025 to 2035
Enterprise A2P SMS Market Size and Share Forecast Outlook 2025 to 2035
Enterprise-Class Hybrid Storage Market Size and Share Forecast Outlook 2025 to 2035
Enterprise Feedback Management Market Size and Share Forecast Outlook 2025 to 2035
Enterprise Social Graph Market Size and Share Forecast Outlook 2025 to 2035
Enterprise File Sync And Share Platform Market Size and Share Forecast Outlook 2025 to 2035
Enterprise Mobility Market Size and Share Forecast Outlook 2025 to 2035
Enterprise Metadata Management Market Size and Share Forecast Outlook 2025 to 2035
Enterprise Rights Management Solution Market Size and Share Forecast Outlook 2025 to 2035
Enterprise LLM Market Size and Share Forecast Outlook 2025 to 2035
Enterprise VSAT Systems Market Size and Share Forecast Outlook 2025 to 2035
Enterprise AI Governance and Compliance Market Analysis - Size, Share, and Forecast Outlook 2025 to 2035
Enterprise Feedback Management Industry Analysis in Western Europe Size and Share Forecast Outlook 2025 to 2035
Enterprise Feedback Management Industry Analysis in Korea Size and Share Forecast Outlook 2025 to 2035
Enterprise Feedback Management Industry Analysis in Japan Size and Share Forecast Outlook 2025 to 2035
Enterprise Resource Planning (ERP) Software Market Size and Share Forecast Outlook 2025 to 2035
Enterprise Content Management Market Size and Share Forecast Outlook 2025 to 2035
Enterprise Data Management Market Size and Share Forecast Outlook 2025 to 2035
Enterprise WLAN Market Size and Share Forecast Outlook 2025 to 2035
Enterprise Network Equipment Market Size and Share Forecast Outlook 2025 to 2035

Thank you!
You will receive an email from our Business Development Manager. Please be sure to check your SPAM/JUNK folder too.
Chat With
MaRIA