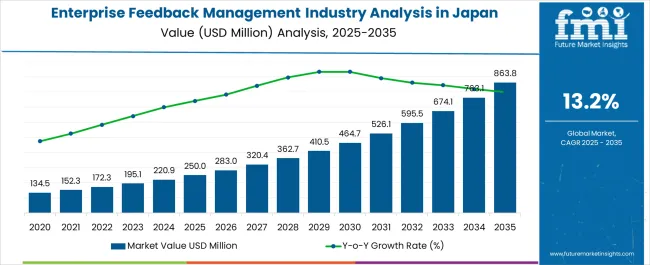
The Enterprise Feedback Management Industry Analysis in Japan is estimated to be valued at USD 250.0 million in 2025 and is projected to reach USD 863.8 million by 2035, registering a compound annual growth rate (CAGR) of 13.2% over the forecast period.

| Metric | Value |
|---|---|
| Enterprise Feedback Management Industry Analysis in Japan Estimated Value in (2025 E) | USD 250.0 million |
| Enterprise Feedback Management Industry Analysis in Japan Forecast Value in (2035 F) | USD 863.8 million |
| Forecast CAGR (2025 to 2035) | 13.2% |
The enterprise feedback management industry in Japan is expanding steadily. Growth is being influenced by rising demand for customer experience optimization, digital transformation initiatives, and the adoption of structured feedback collection tools. Current dynamics are marked by enterprises leveraging multi-channel platforms to capture actionable insights that drive service improvements and brand loyalty.
Regulatory emphasis on data privacy and compliance has encouraged organizations to adopt secure and standardized feedback systems. The future outlook is supported by increasing integration of artificial intelligence and analytics within feedback platforms, enabling faster interpretation and enhanced decision-making capabilities.
Market expansion is also being reinforced by the growing importance of real-time customer engagement and the alignment of feedback systems with enterprise resource planning and customer relationship management solutions Growth rationale is rooted in the continuous prioritization of customer satisfaction, rising investment in feedback technologies, and the scalability of digital touchpoints that ensure consistent adoption across sectors, positioning the industry for long-term sustainability and innovation-driven progress.

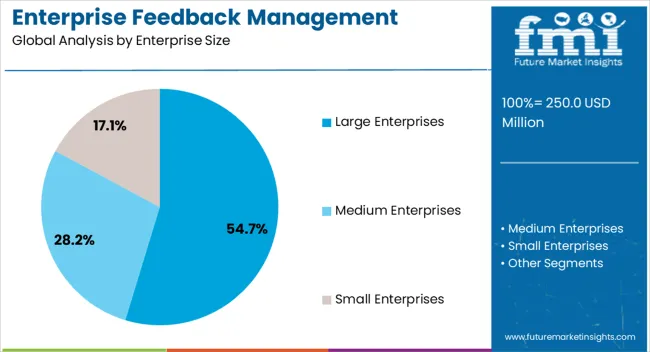
The large enterprises segment, holding 54.70% of the enterprise size category, has established dominance due to its strong capacity to invest in advanced feedback management platforms and its structured approach to customer engagement strategies. Market leadership has been sustained by the scale of operations, which necessitates sophisticated solutions to handle complex and diverse customer interactions.
Adoption has been reinforced by the need for compliance with strict regulatory frameworks and the drive to maintain competitive differentiation through data-driven decision-making. Technological integration has enabled large enterprises to customize platforms for improved functionality and better alignment with organizational goals.
The segment’s leadership is expected to persist, supported by continued investment in digital transformation and the pursuit of measurable improvements in customer experience outcomes.

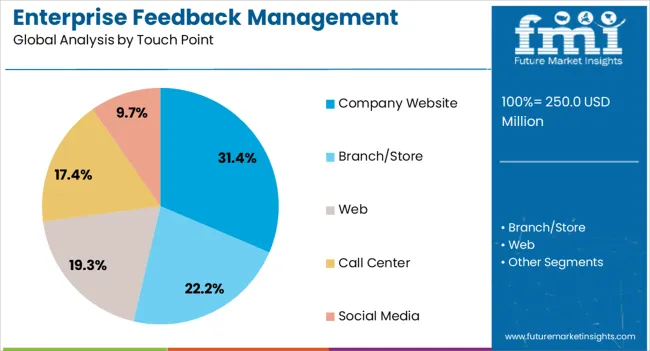
The company website segment, accounting for 31.40% of the touch point category, has remained the leading channel for feedback collection owing to its accessibility and central role in customer interaction. Its position has been reinforced by widespread digital adoption and consumer preference for direct engagement through online platforms.
Organizations have increasingly utilized integrated feedback forms, live chat systems, and interactive surveys embedded within websites to capture valuable customer insights. Reliability and scalability of website-based touchpoints have strengthened their prominence across industries.
Continuous improvements in user interface design, coupled with the integration of analytics tools, have enabled more effective data collection and interpretation This segment is expected to retain its leadership as digital-first strategies continue to dominate enterprise operations in Japan.

The BFSI segment, representing 27.80% of the industry category, has been driving significant adoption of enterprise feedback management systems due to the sector’s emphasis on trust, compliance, and customer-centric services. High-volume customer interactions across banking, financial services, and insurance operations have necessitated structured mechanisms to collect and analyze feedback efficiently.
Adoption has been supported by the critical importance of service quality, transparency, and responsiveness in shaping customer relationships. Technological integration has allowed BFSI organizations to monitor customer sentiment in real time, strengthening competitive positioning.
Regulatory compliance and the push for digital banking have further accelerated demand for advanced feedback solutions The segment’s continued dominance is expected as institutions prioritize customer satisfaction and operational efficiency to maintain market credibility and growth.
The section offers a detailed analysis of dominant segments within specific verticals and enterprise sizes. It furnishes detailed information on the industry shares held by each segment in 2025.
By zeroing in on key sectors like BFSI (Banking, Financial Services, and Insurance) and distinct enterprise sizes, particularly large enterprises, the insights delve into the demand outlook for enterprise feedback management in Japan. This highlights the significant influence of these segments and their respective industry shares.
| Dominant Segment by Verticals | BFSI |
|---|---|
| Share held by the Segment in 2025 | 22.5% |
The Banking, Financial Services, and Insurance (BFSI) sector maintained a significant share of 22.5% in 2025. Its dominance can be attributed to the increasing reliance on enterprise feedback management to enhance customer experiences and ensure regulatory compliance.
| Dominant Segment by Enterprise Size | Large Enterprises |
|---|---|
| Share held by the Segment in 2025 | 62.9% |
Large enterprises emerged as a dominant force, capturing a substantial 62.9% share in the Japan enterprise feedback management demand outlook in 2025.
Adoption of enterprise feedback management dominates in the Kanto region, primarily driven by its thriving technology landscape, with Tokyo leading in sales. Kanto's dynamic business environment, supported by extensive financial and technological resources, fuels the adoption of advanced enterprise feedback management systems.
Tokyo's emergence as a global financial and technological hub further encourages the incorporation of EFM tools for enhanced customer engagement and data-driven decision-making.
Chubu's enterprise feedback management sector witnessed a steady rise in sales, supported by Chubu's flourishing manufacturing sector. The automotive and electronics industries are key contributors to the growing demand for enterprise feedback management tools.
With Nagoya as a prominent industrial hub, the companies in Chubu focus on leveraging enterprise feedback management solutions to enhance product quality, customer satisfaction, and overall business operations.
Kinki's enterprise feedback management solutions experiences a notable upsurge in adoption, driven by Osaka's position as a prominent commercial and cultural center.
Kinki's diverse business landscape, encompassing retail, hospitality, and technology sectors, underscores the significance of enterprise feedback management in fostering customer engagement and loyalty. Osaka's dynamic business environment emphasizes the integration of EFM tools to enhance operational efficiency and deliver superior customer experiences.
Kyushu and Okinawa's enterprise feedback management sector witnessed a steady increase in sales, attributed to the thriving tourism and hospitality sectors. With Fukuoka and Okinawa serving as popular tourist destinations, the emphasis on delivering exceptional customer experiences drives the integration of enterprise feedback management tools.
Kyushu and Okinawa's hospitality industry leverages EFM solutions to collect valuable insights and feedback, enhancing service quality and visitor satisfaction.
Tohoku's enterprise feedback management services showcase a promising demand outlook, with Sendai as a key contributor to the growing adoption. The area's diverse industrial landscape, including manufacturing and technology sectors, underlines the significance of enterprise feedback management in improving operational efficiency and customer satisfaction.
Sendai's evolving business environment emphasizes the integration of EFM tools to drive data-driven decision-making and enhance business performance.

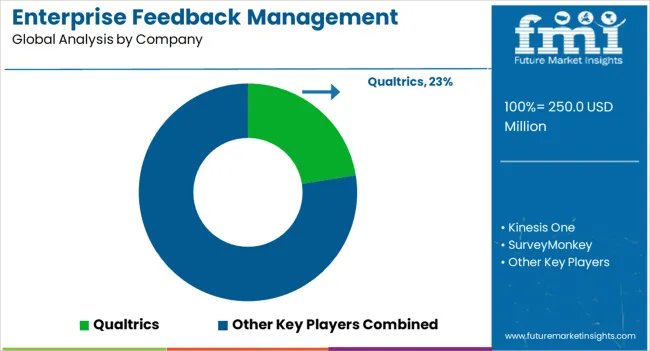
Japan's enterprise feedback management industry is highly competitive, with several established and new players vying for dominance. These players are taking several steps to stay at the top, including:
Top Challenges Faced by Key Players in Japan
Recent Developments Observed in Japan Enterprise Feedback Management Business
| Attributes | Details |
|---|---|
| Estimated Industry Size in 2025 | USD 250.0 million |
| Projected Industry Valuation in 2035 | USD 863.8 million |
| Value-based CAGR 2025 to 2035 | 13.2% |
| Historical Analysis of Enterprise Feedback Management in Japan | 2020 to 2025 |
| Demand Forecast for Enterprise Feedback Management in Japan | 2025 to 2035 |
| Report Coverage | Industry Size, Industry Trends, Analysis of key factors influencing Enterprise Feedback Management in Japan Insights on Global Players and their Industry Strategy in Japan, Ecosystem Analysis of Local and Regional Japan Providers |
| Key Cities Analyzed While Studying Opportunities in Enterprise Feedback Management in Japan | Kanto, Chubu, Kinki, Kyushu and Okinawa, Tohoku, Rest of Japan |
| Key Companies Profiled | Kinesis One; SurveyMonkey; Qualtrics; Freshservice; Zendesk; Gtmhub; Culture Amp; Perceptyx; Medallia |
The global enterprise feedback management industry analysis in japan is estimated to be valued at USD 250.0 million in 2025.
The market size for the enterprise feedback management industry analysis in japan is projected to reach USD 863.8 million by 2035.
The enterprise feedback management industry analysis in japan is expected to grow at a 13.2% CAGR between 2025 and 2035.
The key product types in enterprise feedback management industry analysis in japan are large enterprises, medium enterprises and small enterprises.
In terms of touch point, company website segment to command 31.4% share in the enterprise feedback management industry analysis in japan in 2025.


Full Research Suite comprises of:
Market outlook & trends analysis
Interviews & case studies
Strategic recommendations
Vendor profiles & capabilities analysis
5-year forecasts
8 regions and 60+ country-level data splits
Market segment data splits
12 months of continuous data updates
DELIVERED AS:
PDF EXCEL ONLINE
Enterprise A2P SMS Market Size and Share Forecast Outlook 2025 to 2035
Enterprise-Class Hybrid Storage Market Size and Share Forecast Outlook 2025 to 2035
Enterprise Social Graph Market Size and Share Forecast Outlook 2025 to 2035
Enterprise File Sync And Share Platform Market Size and Share Forecast Outlook 2025 to 2035
Enterprise Mobility Market Size and Share Forecast Outlook 2025 to 2035
Enterprise LLM Market Size and Share Forecast Outlook 2025 to 2035
Enterprise VSAT Systems Market Size and Share Forecast Outlook 2025 to 2035
Enterprise AI Governance and Compliance Market Analysis - Size, Share, and Forecast Outlook 2025 to 2035
Enterprise IoT Market Size and Share Forecast Outlook 2025 to 2035
Enterprise WLAN Market Size and Share Forecast Outlook 2025 to 2035
Enterprise Network Equipment Market Size and Share Forecast Outlook 2025 to 2035
Enterprise Social Networks Market Size and Share Forecast Outlook 2025 to 2035
Enterprise Video Market Analysis - Size, Share, and Forecast 2025 to 2035
Enterprise-Grade DLT Market Size and Share Forecast Outlook 2025 to 2035
Enterprise Flash Storage Market
Enterprise Information Archiving (EIA) Market Size and Share Forecast Outlook 2025 to 2035
Enterprise File Sharing And Synchronization Market
Enterprise Manufacturing Intelligence Market Analysis by Deployment Type, Offering, End-use Industry, and Region Through 2035
Enterprise Laboratory Informatics Market Analysis by Type of Solution, Component, Delivery, Industry, and Region Through 2035
Enterprise Resource Planning (ERP) Software Market Size and Share Forecast Outlook 2025 to 2035

Thank you!
You will receive an email from our Business Development Manager. Please be sure to check your SPAM/JUNK folder too.
Chat With
MaRIA