This site uses cookies, including third-party cookies, that help us to provide and improve our services.

Privacy Policy
- Global Locations -
Headquarters
Future Market Insights, Inc.
Christiana Corporate, 200 Continental Drive, Suite 401, Newark, Delaware - 19713, United States
T: +1-845-579-5705
MEA
Market Access DMCC

1602-6 Jumeirah Bay X2 Tower, Plot No: JLT-PH2-X2A,

Jumeirah Lakes Towers, Dubai,

United Arab Emirates

Americas
Future Market Insights
616 Corporate Way, Suite 2-9018,
Valley Cottage, NY 10989,
United States
T: +1-347-918-3531
Europe
Future Market Insights
3rd Floor, 207 Regent Street,
London W1B 3HH
United Kingdom
T: + 44 (0) 20 8123 9659
D: +44 (0) 20 3287 4268
APAC
Future Market Insights
Office No. 401-A, 4th Floor,
VANTAGE 9, S.No. 36/1/1,
Baner, Pune 411045 India

Enterprise A2P SMS Market

Demand for Potential Communication at Fingertips In the Era of Notification Barbs Through the Industry Potential of A2P SMS. Here’s More.

Enterprise A2P SMS Market Deployment, Application, End-User & Region | Forecast 2023 to 2033

A Summary of the Enterprise A2P SMS Market Developments (2023 to 2033)

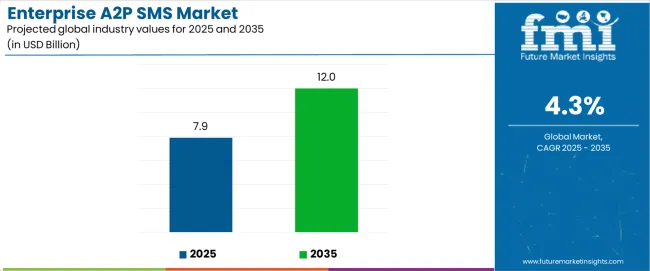
The global enterprise A2P SMS market is projected to have an average-paced CAGR of 5.3% during the forecast period. The current valuation of the market is US$ 77.29 Billion in 2023. The market value of the enterprise A2P SMS market is anticipated to surpass a market valuation of US$ 129.54 Billion by the year 2033. A historical market valuation of US$ 73.4 Billion has been recorded by the analysts of Future Market Insights for the concerned market during the base year. The growth is supported by:

  • The growing adoption of smartphones and mobile by people across the globe is likely to stagger the growth of the market.
  • The surge in competition among businesses is compelling them to adopt new and advanced technologies for the establishment of seamless communication with customers.
  • A high emphasis on customer engagement and acquisition is estimated to boost the growth of the enterprise A2P SMS market through 2033.
  • Advanced features like the authentication of active users and time-sensitive alerts are enabling smooth communication with the base of customers and are highly getting adopted across diverse end-use industries.
  • The ease of handling bulk messaging service instantly is leveraging the quality and expanding the market size of enterprise A2P SMS.
  • Rapid adoption of internet services and OTT messaging platform integrations like WhatsApp and Facebook Messenger, creating favorable environments for the industry expansion.

Don't pay for what you don't need

Customize your report by selecting specific countries or regions and save 30%!

Security Threats Hovers as a Shady Cloud Across the Enterprise A2P SMS Horizon

Although the market is projected to have healthy growth through the forecast period, it is estimated that certain aspects prevailing in the industry are likely to hamper the growth in the long run. An increased number of security and privacy threats is estimated to restrain the market expansion through the forecast period.

It is identified that the grey route threat is one of the most prominent threats witnessed across industries. Additionally, traffic blending is also anticipated to pose a threat to the service providers, and is likely to hinder the pace of advancement for the enterprise A2P SMS industry through 2033.

Growth of OTT Messaging Platforms - A Blessing to Boon

It is analyzed that the urban population across the globe is in tandem with the surging penetration of internet services. This in turn has boosted over-the-top (OTT) messaging platforms like iMessage, Facebook Messenger, and WhatsApp amongst the noteworthy platforms.

The rise in market share of OTT messaging platforms can be attributed to the facility of sharing enhanced communication services such as stickers, images, videos, sound clips, and more. This is largely contributing to the engagement of customers over messages. Therefore, the substantial adoption of OTT platforms is serving as a blessing, surging the market potential for enterprise A2P SMS.

Report Attribute

Details

Enterprise A2P SMS Market Value (2023)

US$ 77.29 Billion

Enterprise A2P SMS Market Anticipated Value (2033)

US$ 129.54 Billion

Enterprise A2P SMS Projected Growth Rate (2023 to 2033)

5.3%

Sudip Saha
Sudip Saha
Principal Consultant
LinkedIn
Talk to Analyst

Find your sweet spots for generating winning opportunities in this market.

Talk to Analyst

Contrast of the 2023 Dynamics with the Historical Market Scenario

It is identified that the enterprise A2P SMS market is witnessing an unprecedented surge in the recent few years. There has been an approximate rise of US$ 3.89 Billion from the base year to the current. This growth in market valuation can be highly attributed to the cost-effectiveness and extensive reaching capabilities of these messages globally. However, there is a minor drop of 0.2% in the CAGR, owing to a decrease in the demand for the hospitality and travel & transport industry in recent years.

Historical CAGR (2018 to 2022)

Forecast CAGR (2023 to 2033)

5.5%

5.3%

Market Value in 2022

Market Value in 2023

US$ 73.4 Billion

US$ 77.29 Million

It is identified that the cost associated with A2P SMS is very low in comparison to the other customer engagement methods. Start-up organizations and small enterprises are robustly adopting A2P SMS services for the creation of brand awareness and enhancement of customer experiences.

The centralized tool is aggregating all streams of business communications and has leveraged enterprise A2P SMS gateway during the period 2018 to 2022. Previously, the market was advancing at a CAGR of 5.5%. The demand of companies for delivering quality information in regard to their products to customers through a convenient medium has stirred up the dynamics of the enterprise A2P SMS market.

Comparative Analysis of Adjacent Markets

Enterprise A2P SMS Market:

Differentiating Aspects

Enterprise A2P SMS Market

CAGR

5.3%

Market Valuation in 2023

US$ 77.29 Billion

Projected Market Value in 2033

US$ 129.54 Billion

Drivers

  • The growing adoption of smartphones and penetration of the internet is fueling the market growth.
  • Enhanced customer attention and engagement are key factors aiding market growth for the enterprise A2P SMS market.

Cloud API Market:

Differentiating Aspects

Cloud API Market

CAGR

19%

Market Valuation in 2023

US$ 995.83 Million

Projected Market Value in 2033

US$ 5,670.91 Million

Drivers

  • Faster communication and ease of streamlining updates are aiding the growth of the cloud PI market.
  • Mandatory usage during the integration phase by ed-use industries is boosting market size for the same.

Managed Messaging Market:

Differentiating Aspects

Managed Messaging Market

CAGR

3.2%

Market Valuation in 2023

US$ 68.36 Billion

Projected Market Value in 2033

US$ 93.66 Billion

Drivers

  • The Surge in the prevalence of two-factor authentication services is fueling the market share for managed messaging services.
  • Demand for increased customer communication that is seamless is likely to stir up market demand for the same.

Get the data you need at a Fraction of the cost

Personalize your report by choosing insights you need
and save 40%!

Category-wise Insights

Better Connectivity and Expansion of Sales Leverage More Advances to the Domineering Segments

Platform - By Component Type

It is identified that the platform segment held the largest market share during the base year, surpassing the shares of the service segment. The platform segment accounted for a revenue share of 61% in 2022 and is anticipated to advance at a moderate pace, registering a CAGR of 4.2%.

The growth of the platform segment is owing to the robust use of enterprise A2P SMS services by the various industry verticals like travel and tourism, BFSI, healthcare, and media and entertainment. Additionally, there is a demand for enterprise A2P SMS services for alerts, notifications, and online transactions. Direct access platforms to multiple services and brands are catering several advantages to the users.

Furthermore, the development of chatbot services and AI has increased the number of virtual assistants, which is further leveraging the market shares for the platform segment.

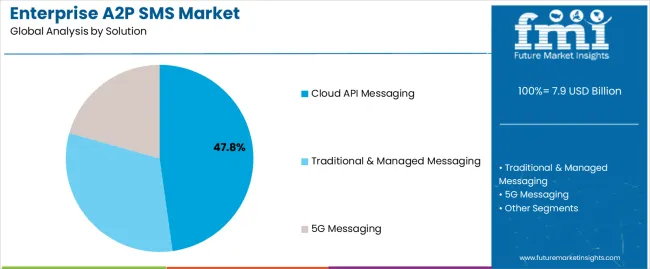
Cloud API Messaging - By Deployment Type

By the deployment mode category, the cloud segment is estimated to exert dominance through the forecast period. During the base year, the cloud segment accounted for the highest revenue share at 56%. This segment is projected to garner a CAGR of 5.4% through the projection period.

The cloud segment is gaining prominence over the on-premise segment owing to increased support towards client interactions. The cloud segment easily integrates phone, SMS, and other services, coupled with a secured mobile messaging experience. Hence, the segment is likely to accrue dominant shares through 2033.

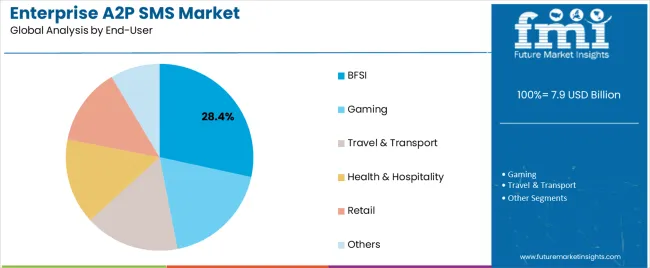
BFSI - By End-use Industry Type

It is projected that the BFSI segment is likely to exert influence through the forecast period. In 2022, the segment accounted for a revenue share of 29%, surpassing the shares of travel and tourism, healthcare, media & entertainment, and others. The segment is estimated to advance at a CAGR of 3.5%.

The expansion of this segment can be attributed to the surging number of payment transactions. The BFSI segment is largely using A2P SMS service for balance statements, payment reminders, anti-fraud alerts, and one-time passwords. This is helping in the strong establishment of relationships with the clients, aiding market growth through the foreseen years.

Overview of Segments Holding Significant Shares

Segment Platforms
Category Component Type
Revenue Share in 2022 61%
Growth Rate (CAGR) 4.2%
Segment Cloud API Messaging
Category Deployment Type
Revenue Share in 2022 56%
Growth Rate (CAGR) 5.4%
Segment Large Enterprises
Category Enterprise Size Type
Revenue Share in 2022 61%
Growth Rate (CAGR) 4%
Segment National
Category SMS Traffic Type
Revenue Share in 2022 55%
Growth Rate (CAGR) 4.2%
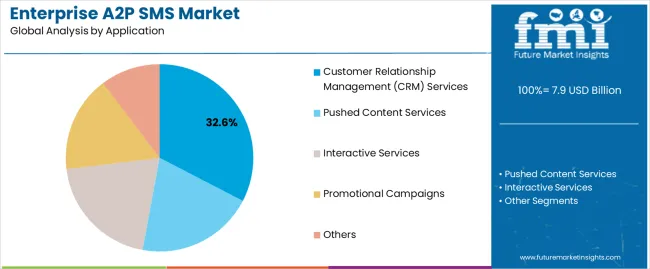
Segment Customer Relationship Management (CRM)
Category Application Type
Revenue Share in 2022 30%
Growth Rate (CAGR) 3.6%
Segment BFSI
Category Vertical type
Revenue Share in 2022 29%
Growth Rate (CAGR) 3.5%

Country-wise Insights

Demand for Identifying Consumer Trends and Behavior Fuel the Adoption of Enterprise A2P SMS Service Across Diverse Countries

Country/Region United States
Statistics

North America is projected is hold the maximum shares of the enterprise A2P SMS market through the forecast period.

The USA has emerged as the leading country and is estimated to advance at a CAGR of 2.6% through 2033.

Growth Propellants A large number of companies are investing heavily in the development of cloud-based platforms for messaging across the country. This is to make allowance for providing end-to-end encryption of messages and this aspect is making a significant contribution to the enterprise A2P SMS market.
Country/Region Europe
Statistics

Europe is projected to gain robust growth during the forecast period.

Germany has emerged as the leading country and is estimated to surpass a market valuation of US$ 873.7 million by the end of 2033.

Growth Propellants

The increasing prominence of industries like healthcare, BFSI, retail, and e-commerce is aiding the demand for enterprise A2P SMS across the region.

The augmentation of new policies for aiding further advancements in the regional economy is also likely to fuel the market share of enterprise A2P SMS in 2023.

Country/Region China
Statistics

China has emerged as a leading Asia Pacific country in the enterprise A2P SMS market.

It is advancing at a rapid pace and is estimated to surpass a valuation of US$ 3,501.7 Million in the current year.

Growth Propellants

The growing number of internet subscribers and the increased adoption of mobile phones are estimated to drive the market size of enterprise A2P SMS in China.

There is a growth in the number of mobile operators and the telecom industry is projected to advance rapidly accruing high shares of enterprise A2P SMS services through the estimated study period.

Start-up Ecosystem

Emerging Businesses Adopt Advanced Techniques to Increase Brand Awareness

The new entrants in the enterprise A2P SMS market are leveraging advancements in technology to launch new products and gain a competitive advantage. These firms are continually investing in research and development activities to keep themselves in tandem with the changing consumer preferences and end-use industry demands. Efforts are being made to strengthen their foothold in the market and aid the further progression of the enterprise A2P SMS market.

2 Top Start-ups to Watch For

Infobip - This firm is a Croatian telecommunications and information technology firm. They have made advances to provide full-stack A2P SMS services and communication platforms. Their programmable communication platforms are increasing assistance and client interaction, along with authentication and security. This firm is having a zero-hop connection and private cloud architecture for curating ease of communication between the brands and clients.

Vonage - This start-up organization has recently made medical links for addressing patients in real-time from any device or location for assistance while critical healthcare situations. This firm is a cloud communications company based in the United States and is offering services based on internet telephony.

Competitive Landscape

Biggies Revolutionize the Market Landscape by Indulging into Organic and Inorganic Growth Strategies

The manufacturers in the enterprise A2P SMS market are leveraging advancements in technology to make advances in the services and gain a competitive advantage. These firms are continually investing in research and development activities to keep themselves in tandem with the changing consumer preferences and end-use industry demands. Efforts are being made to comply with the safety regulations in the market and aid the further progression of the enterprise A2P SMS market. Thus, the market is likely to witness significant growth through 2033.

Recently, Pipeliner CRM announced the launch of an analytics and reporting solution for its CRM platform. This service has been designed in a way that it will provide insights into current, past, and future trends of performance. It will make allowance for consumers for interpreting data by making use of diagnostic, descriptive, and prescriptive analytics.

Recent Developments

  • In December 2021, Microsoft made an announcement to acquire Xandr from AT&T. This acquisition is likely to accelerate the delivery of advertising, digital marketing, and retail media solutions for the open web.
  • In March 2022, Infobip Ltd. made an announcement for the integration of WhatsApp messaging and SMS notifications into Adobe Commerce. This integration is likely to enable organizations and enterprises to bolster loyalty and improvise consumer experience through the addition of communication channels.
  • In January 2021, Mitto made an announcement for partnering with four mobile network operators in Tajikistan for A2P SMS. With the help of this partnership, the company planned on offering reliable A2P messages for the industries like commerce, logistics, entertainment, and social media players for enhanced engagement with customers.

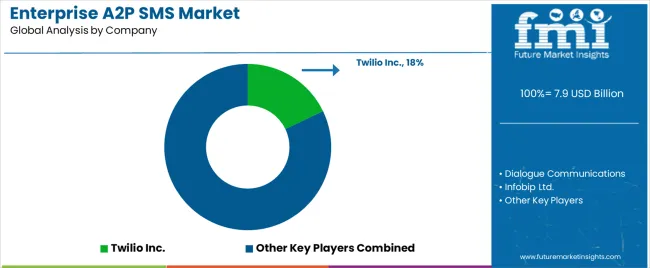
Some of the key players in the enterprise A2P SMS market are:

  • TWILIO INC.
  • Dialogue Communications
  • Infobip Ltd.
  • Sinch
  • Proximus
  • Tata Communications
  • AT&T
  • Chain Mobile Limited
  • Orange
  • Genesys

Key Segments in the Enterprise A2P SMS Market

By Tool:

  • Cloud API Messaging Platforms
  • Traditional &Managed Messaging Services

By Application:

  • Pushed Content Services
  • Interactive Services
  • Promotional Campaigns
  • Customer Relationship Management (CRM) Services
  • Others

By End User:

  • BFSI
  • Gaming
  • Travel & Transport
  • Health & Hospitality
  • Retail
  • Others

By Region:

  • North America
  • Latin America
  • Asia Pacific
  • Middle East and Africa (MEA)
  • Europe

Frequently Asked Questions

The growth outlook for the enterprise A2P SMS market is predicted to advance at a CAGR of 5.3% from 2023 to 2033.

The North American region is anticipated to lead the enterprise A2P SMS market during the forecast period.

The market valuation of the enterprise A2P SMS stands at US$ 77.29 Billion in 2023.

The enterprise A2P SMS market is likely to hold a valuation of US$ 129.54 Billion by 2033.

The information technology industry sector is the key driver in the enterprise A2P SMS market.

Table of Content

1. Executive Summary | Enterprise A2P SMS Market

    1.1. Global Market Outlook

    1.2. Demand-side Trends

    1.3. Supply-side Trends

    1.4. Technology Roadmap Analysis

    1.5. Analysis and Recommendations

2. Market Overview

    2.1. Market Coverage / Taxonomy

    2.2. Market Definition / Scope / Limitations

3. Market Background

    3.1. Market Dynamics

        3.1.1. Drivers

        3.1.2. Restraints

        3.1.3. Opportunity

        3.1.4. Trends

    3.2. Scenario Forecast

        3.2.1. Demand in Optimistic Scenario

        3.2.2. Demand in Likely Scenario

        3.2.3. Demand in Conservative Scenario

    3.3. Opportunity Map Analysis

    3.4. Investment Feasibility Matrix

    3.5. PESTLE and Porter’s Analysis

    3.6. Regulatory Landscape

        3.6.1. By Key Regions

        3.6.2. By Key Countries

    3.7. Regional Parent Market Outlook

4. Global Market Analysis 2017 to 2022 and Forecast, 2023 to 2033

    4.1. Historical Market Size Value (US$ million) Analysis, 2017 to 2022

    4.2. Current and Future Market Size Value (US$ million) Projections, 2023 to 2033

        4.2.1. Y-o-Y Growth Trend Analysis

        4.2.2. Absolute $ Opportunity Analysis

5. Global Market Analysis 2017 to 2022 and Forecast 2023 to 2033, By Tool

    5.1. Introduction / Key Findings

    5.2. Historical Market Size Value (US$ million) Analysis By Tool, 2017 to 2022

    5.3. Current and Future Market Size Value (US$ million) Analysis and Forecast By Tool, 2023 to 2033

        5.3.1. Cloud API Messaging Platforms

        5.3.2. Traditional & Managed Messaging Services

    5.4. Y-o-Y Growth Trend Analysis By Tool, 2017 to 2022

    5.5. Absolute $ Opportunity Analysis By Tool, 2023 to 2033

6. Global Market Analysis 2017 to 2022 and Forecast 2023 to 2033, By Application

    6.1. Introduction / Key Findings

    6.2. Historical Market Size Value (US$ million) Analysis By Application, 2017 to 2022

    6.3. Current and Future Market Size Value (US$ million) Analysis and Forecast By Application, 2023 to 2033

        6.3.1. Pushed Content Services

        6.3.2. Interactive Services

        6.3.3. Promotional Campaigns

        6.3.4. Customer Relationship Management Services

        6.3.5. Others

    6.4. Y-o-Y Growth Trend Analysis By Application, 2017 to 2022

    6.5. Absolute $ Opportunity Analysis By Application, 2023 to 2033

7. Global Market Analysis 2017 to 2022 and Forecast 2023 to 2033, By End User

    7.1. Introduction / Key Findings

    7.2. Historical Market Size Value (US$ million) Analysis By End User , 2017 to 2022

    7.3. Current and Future Market Size Value (US$ million) Analysis and Forecast By End User , 2023 to 2033

        7.3.1. BFSI

        7.3.2. Gaming

        7.3.3. Travel & Transport

        7.3.4. Health & Hospitality

        7.3.5. Retail

        7.3.6. Others

    7.4. Y-o-Y Growth Trend Analysis By End User , 2017 to 2022

    7.5. Absolute $ Opportunity Analysis By End User , 2023 to 2033

8. Global Market Analysis 2017 to 2022 and Forecast 2023 to 2033, By Region

    8.1. Introduction

    8.2. Historical Market Size Value (US$ million) Analysis By Region, 2017 to 2022

    8.3. Current Market Size Value (US$ million) Analysis and Forecast By Region, 2023 to 2033

        8.3.1. North America

        8.3.2. Latin America

        8.3.3. Western Europe

        8.3.4. Eastern Europe

        8.3.5. APEJ

        8.3.6. Japan

        8.3.7. Middle East and Africa (MEA)

    8.4. Market Attractiveness Analysis By Region

9. North America Market Analysis 2017 to 2022 and Forecast 2023 to 2033, By Country

    9.1. Historical Market Size Value (US$ million) Trend Analysis By Market Taxonomy, 2017 to 2022

    9.2. Market Size Value (US$ million) Forecast By Market Taxonomy, 2023 to 2033

        9.2.1. By Country

            9.2.1.1. The USA

            9.2.1.2. Canada

        9.2.2. By Tool

        9.2.3. By Application

        9.2.4. By End User

    9.3. Market Attractiveness Analysis

        9.3.1. By Country

        9.3.2. By Tool

        9.3.3. By Application

        9.3.4. By End User

    9.4. Key Takeaways

10. Latin America Market Analysis 2017 to 2022 and Forecast 2023 to 2033, By Country

    10.1. Historical Market Size Value (US$ million) Trend Analysis By Market Taxonomy, 2017 to 2022

    10.2. Market Size Value (US$ million) Forecast By Market Taxonomy, 2023 to 2033

        10.2.1. By Country

            10.2.1.1. Brazil

            10.2.1.2. Argentina

            10.2.1.3. Rest of Latin America

        10.2.2. By Tool

        10.2.3. By Application

        10.2.4. By End User

    10.3. Market Attractiveness Analysis

        10.3.1. By Country

        10.3.2. By Tool

        10.3.3. By Application

        10.3.4. By End User

    10.4. Key Takeaways

11. Western Europe Market Analysis 2017 to 2022 and Forecast 2023 to 2033, By Country

    11.1. Historical Market Size Value (US$ million) Trend Analysis By Market Taxonomy, 2017 to 2022

    11.2. Market Size Value (US$ million) Forecast By Market Taxonomy, 2023 to 2033

        11.2.1. By Country

            11.2.1.1. Germany

            11.2.1.2. France

            11.2.1.3. The United Kingdom

            11.2.1.4. Spain

            11.2.1.5. Italy

            11.2.1.6. Nordic

            11.2.1.7. Benelux

            11.2.1.8. Rest of Western Europe

        11.2.2. By Tool

        11.2.3. By Application

        11.2.4. By End User

    11.3. Market Attractiveness Analysis

        11.3.1. By Country

        11.3.2. By Tool

        11.3.3. By Application

        11.3.4. By End User

    11.4. Key Takeaways

12. Eastern Europe Market Analysis 2017 to 2022 and Forecast 2023 to 2033, By Country

    12.1. Historical Market Size Value (US$ million) Trend Analysis By Market Taxonomy, 2017 to 2022

    12.2. Market Size Value (US$ million) Forecast By Market Taxonomy, 2023 to 2033

        12.2.1. By Country

            12.2.1.1. Russia

            12.2.1.2. Poland

            12.2.1.3. Rest of Eastern Europe

        12.2.2. By Tool

        12.2.3. By Application

        12.2.4. By End User

    12.3. Market Attractiveness Analysis

        12.3.1. By Country

        12.3.2. By Tool

        12.3.3. By Application

        12.3.4. By End User

    12.4. Key Takeaways

13. APEJ Market Analysis 2017 to 2022 and Forecast 2023 to 2033, By Country

    13.1. Historical Market Size Value (US$ million) Trend Analysis By Market Taxonomy, 2017 to 2022

    13.2. Market Size Value (US$ million) Forecast By Market Taxonomy, 2023 to 2033

        13.2.1. By Country

            13.2.1.1. China

            13.2.1.2. India

            13.2.1.3. ASEAN

            13.2.1.4. Australia and New Zealand

            13.2.1.5. Rest of APEJ

        13.2.2. By Tool

        13.2.3. By Application

        13.2.4. By End User

    13.3. Market Attractiveness Analysis

        13.3.1. By Country

        13.3.2. By Tool

        13.3.3. By Application

        13.3.4. By End User

    13.4. Key Takeaways

14. Japan Market Analysis 2017 to 2022 and Forecast 2023 to 2033, By Country

    14.1. Historical Market Size Value (US$ million) Trend Analysis By Market Taxonomy, 2017 to 2022

    14.2. Market Size Value (US$ million) Forecast By Market Taxonomy, 2023 to 2033

        14.2.1. By Country

        14.2.2. By Tool

        14.2.3. By Application

        14.2.4. By End User

    14.3. Market Attractiveness Analysis

        14.3.1. By Country

        14.3.2. By Tool

        14.3.3. By Application

        14.3.4. By End User

    14.4. Key Takeaways

15. MEA Market Analysis 2017 to 2022 and Forecast 2023 to 2033, By Country

    15.1. Historical Market Size Value (US$ million) Trend Analysis By Market Taxonomy, 2017 to 2022

    15.2. Market Size Value (US$ million) Forecast By Market Taxonomy, 2023 to 2033

        15.2.1. By Country

            15.2.1.1. GCC Countries

            15.2.1.2. North Africa

            15.2.1.3. South Africa

            15.2.1.4. Rest of MEA

        15.2.2. By Tool

        15.2.3. By Application

        15.2.4. By End User

    15.3. Market Attractiveness Analysis

        15.3.1. By Country

        15.3.2. By Tool

        15.3.3. By Application

        15.3.4. By End User

    15.4. Key Takeaways

16. Key Countries Market Analysis

    16.1. The USA

        16.1.1. Pricing Analysis

        16.1.2. Market Share Analysis, 2022

            16.1.2.1. By Tool

            16.1.2.2. By Application

            16.1.2.3. By End User

    16.2. Canada

        16.2.1. Pricing Analysis

        16.2.2. Market Share Analysis, 2022

            16.2.2.1. By Tool

            16.2.2.2. By Application

            16.2.2.3. By End User

    16.3. Brazil

        16.3.1. Pricing Analysis

        16.3.2. Market Share Analysis, 2022

            16.3.2.1. By Tool

            16.3.2.2. By Application

            16.3.2.3. By End User

    16.4. Argentina

        16.4.1. Pricing Analysis

        16.4.2. Market Share Analysis, 2022

            16.4.2.1. By Tool

            16.4.2.2. By Application

            16.4.2.3. By End User

    16.5. Germany

        16.5.1. Pricing Analysis

        16.5.2. Market Share Analysis, 2022

            16.5.2.1. By Tool

            16.5.2.2. By Application

            16.5.2.3. By End User

    16.6. France

        16.6.1. Pricing Analysis

        16.6.2. Market Share Analysis, 2022

            16.6.2.1. By Tool

            16.6.2.2. By Application

            16.6.2.3. By End User

    16.7. The United Kingdom

        16.7.1. Pricing Analysis

        16.7.2. Market Share Analysis, 2022

            16.7.2.1. By Tool

            16.7.2.2. By Application

            16.7.2.3. By End User

    16.8. Spain

        16.8.1. Pricing Analysis

        16.8.2. Market Share Analysis, 2022

            16.8.2.1. By Tool

            16.8.2.2. By Application

            16.8.2.3. By End User

    16.9. Italy

        16.9.1. Pricing Analysis

        16.9.2. Market Share Analysis, 2022

            16.9.2.1. By Tool

            16.9.2.2. By Application

            16.9.2.3. By End User

    16.10. Nordic

        16.10.1. Pricing Analysis

        16.10.2. Market Share Analysis, 2022

            16.10.2.1. By Tool

            16.10.2.2. By Application

            16.10.2.3. By End User

    16.11. Benelux

        16.11.1. Pricing Analysis

        16.11.2. Market Share Analysis, 2022

            16.11.2.1. By Tool

            16.11.2.2. By Application

            16.11.2.3. By End User

    16.12. Russia

        16.12.1. Pricing Analysis

        16.12.2. Market Share Analysis, 2022

            16.12.2.1. By Tool

            16.12.2.2. By Application

            16.12.2.3. By End User

    16.13. Poland

        16.13.1. Pricing Analysis

        16.13.2. Market Share Analysis, 2022

            16.13.2.1. By Tool

            16.13.2.2. By Application

            16.13.2.3. By End User

    16.14. China

        16.14.1. Pricing Analysis

        16.14.2. Market Share Analysis, 2022

            16.14.2.1. By Tool

            16.14.2.2. By Application

            16.14.2.3. By End User

    16.15. India

        16.15.1. Pricing Analysis

        16.15.2. Market Share Analysis, 2022

            16.15.2.1. By Tool

            16.15.2.2. By Application

            16.15.2.3. By End User

    16.16. ASEAN

        16.16.1. Pricing Analysis

        16.16.2. Market Share Analysis, 2022

            16.16.2.1. By Tool

            16.16.2.2. By Application

            16.16.2.3. By End User

    16.17. Australia and New Zealand

        16.17.1. Pricing Analysis

        16.17.2. Market Share Analysis, 2022

            16.17.2.1. By Tool

            16.17.2.2. By Application

            16.17.2.3. By End User

    16.18. Japan

        16.18.1. Pricing Analysis

        16.18.2. Market Share Analysis, 2022

            16.18.2.1. By Tool

            16.18.2.2. By Application

            16.18.2.3. By End User

    16.19. GCC Countries

        16.19.1. Pricing Analysis

        16.19.2. Market Share Analysis, 2022

            16.19.2.1. By Tool

            16.19.2.2. By Application

            16.19.2.3. By End User

    16.20. North Africa

        16.20.1. Pricing Analysis

        16.20.2. Market Share Analysis, 2022

            16.20.2.1. By Tool

            16.20.2.2. By Application

            16.20.2.3. By End User

    16.21. South Africa

        16.21.1. Pricing Analysis

        16.21.2. Market Share Analysis, 2022

            16.21.2.1. By Tool

            16.21.2.2. By Application

            16.21.2.3. By End User

17. Market Structure Analysis

    17.1. Competition Dashboard

    17.2. Competition Benchmarking

    17.3. Market Share Analysis of Top Players

        17.3.1. By Regional

        17.3.2. By Tool

        17.3.3. By Application

        17.3.4. By End User

18. Competition Analysis

    18.1. Competition Deep Dive

        18.1.1. OpenMarket Inc.

            18.1.1.1. Overview

            18.1.1.2. Product Portfolio

            18.1.1.3. Profitability by Market Segments

            18.1.1.4. Sales Footprint

            18.1.1.5. Strategy Overview

                18.1.1.5.1. Marketing Strategy

        18.1.2. CLX Communications AB

            18.1.2.1. Overview

            18.1.2.2. Product Portfolio

            18.1.2.3. Profitability by Market Segments

            18.1.2.4. Sales Footprint

            18.1.2.5. Strategy Overview

                18.1.2.5.1. Marketing Strategy

        18.1.3. Nexmo Inc.

            18.1.3.1. Overview

            18.1.3.2. Product Portfolio

            18.1.3.3. Profitability by Market Segments

            18.1.3.4. Sales Footprint

            18.1.3.5. Strategy Overview

                18.1.3.5.1. Marketing Strategy

        18.1.4. Infobip Limited

            18.1.4.1. Overview

            18.1.4.2. Product Portfolio

            18.1.4.3. Profitability by Market Segments

            18.1.4.4. Sales Footprint

            18.1.4.5. Strategy Overview

                18.1.4.5.1. Marketing Strategy

        18.1.5. Twilio Inc.

            18.1.5.1. Overview

            18.1.5.2. Product Portfolio

            18.1.5.3. Profitability by Market Segments

            18.1.5.4. Sales Footprint

            18.1.5.5. Strategy Overview

                18.1.5.5.1. Marketing Strategy

        18.1.6. Mahindra Comviva

            18.1.6.1. Overview

            18.1.6.2. Product Portfolio

            18.1.6.3. Profitability by Market Segments

            18.1.6.4. Sales Footprint

            18.1.6.5. Strategy Overview

                18.1.6.5.1. Marketing Strategy

        18.1.7. Tata Communications

            18.1.7.1. Overview

            18.1.7.2. Product Portfolio

            18.1.7.3. Profitability by Market Segments

            18.1.7.4. Sales Footprint

            18.1.7.5. Strategy Overview

                18.1.7.5.1. Marketing Strategy

        18.1.8. Fortytwo Telecom AB

            18.1.8.1. Overview

            18.1.8.2. Product Portfolio

            18.1.8.3. Profitability by Market Segments

            18.1.8.4. Sales Footprint

            18.1.8.5. Strategy Overview

                18.1.8.5.1. Marketing Strategy

        18.1.9. AMD Telecom S.A.

            18.1.9.1. Overview

            18.1.9.2. Product Portfolio

            18.1.9.3. Profitability by Market Segments

            18.1.9.4. Sales Footprint

            18.1.9.5. Strategy Overview

                18.1.9.5.1. Marketing Strategy

        18.1.10. Syniverse Holdings Inc.

            18.1.10.1. Overview

            18.1.10.2. Product Portfolio

            18.1.10.3. Profitability by Market Segments

            18.1.10.4. Sales Footprint

            18.1.10.5. Strategy Overview

                18.1.10.5.1. Marketing Strategy

19. Assumptions & Acronyms Used

20. Research Methodology

Don't pay for what you don't need

Customize your report by selecting specific countries or regions and save 30%!

List of Tables

Table 1: Global Market Value (US$ million) Forecast by Region, 2017 to 2033

Table 2: Global Market Value (US$ million) Forecast by Tool, 2017 to 2033

Table 3: Global Market Value (US$ million) Forecast by Application, 2017 to 2033

Table 4: Global Market Value (US$ million) Forecast by End User, 2017 to 2033

Table 5: North America Market Value (US$ million) Forecast by Country, 2017 to 2033

Table 6: North America Market Value (US$ million) Forecast by Tool, 2017 to 2033

Table 7: North America Market Value (US$ million) Forecast by Application, 2017 to 2033

Table 8: North America Market Value (US$ million) Forecast by End User, 2017 to 2033

Table 9: Latin America Market Value (US$ million) Forecast by Country, 2017 to 2033

Table 10: Latin America Market Value (US$ million) Forecast by Tool, 2017 to 2033

Table 11: Latin America Market Value (US$ million) Forecast by Application, 2017 to 2033

Table 12: Latin America Market Value (US$ million) Forecast by End User, 2017 to 2033

Table 13: Western Europe Market Value (US$ million) Forecast by Country, 2017 to 2033

Table 14: Western Europe Market Value (US$ million) Forecast by Tool, 2017 to 2033

Table 15: Western Europe Market Value (US$ million) Forecast by Application, 2017 to 2033

Table 16: Western Europe Market Value (US$ million) Forecast by End User, 2017 to 2033

Table 17: Eastern Europe Market Value (US$ million) Forecast by Country, 2017 to 2033

Table 18: Eastern Europe Market Value (US$ million) Forecast by Tool, 2017 to 2033

Table 19: Eastern Europe Market Value (US$ million) Forecast by Application, 2017 to 2033

Table 20: Eastern Europe Market Value (US$ million) Forecast by End User, 2017 to 2033

Table 21: APEJ Market Value (US$ million) Forecast by Country, 2017 to 2033

Table 22: APEJ Market Value (US$ million) Forecast by Tool, 2017 to 2033

Table 23: APEJ Market Value (US$ million) Forecast by Application, 2017 to 2033

Table 24: APEJ Market Value (US$ million) Forecast by End User, 2017 to 2033

Table 25: Japan Market Value (US$ million) Forecast by Country, 2017 to 2033

Table 26: Japan Market Value (US$ million) Forecast by Tool, 2017 to 2033

Table 27: Japan Market Value (US$ million) Forecast by Application, 2017 to 2033

Table 28: Japan Market Value (US$ million) Forecast by End User, 2017 to 2033

Table 29: MEA Market Value (US$ million) Forecast by Country, 2017 to 2033

Table 30: MEA Market Value (US$ million) Forecast by Tool, 2017 to 2033

Table 31: MEA Market Value (US$ million) Forecast by Application, 2017 to 2033

Table 32: MEA Market Value (US$ million) Forecast by End User, 2017 to 2033
Sudip Saha
Sudip Saha
Principal Consultant
LinkedIn
Talk to Analyst

Find your sweet spots for generating winning opportunities in this market.

Talk to Analyst

List of Charts

Figure 1: Global Market Value (US$ million) by Tool, 2023 to 2033

Figure 2: Global Market Value (US$ million) by Application, 2023 to 2033

Figure 3: Global Market Value (US$ million) by End User, 2023 to 2033

Figure 4: Global Market Value (US$ million) by Region, 2023 to 2033

Figure 5: Global Market Value (US$ million) Analysis by Region, 2017 to 2033

Figure 6: Global Market Value Share (%) and BPS Analysis by Region, 2023 to 2033

Figure 7: Global Market Y-o-Y Growth (%) Projections by Region, 2023 to 2033

Figure 8: Global Market Value (US$ million) Analysis by Tool, 2017 to 2033

Figure 9: Global Market Value Share (%) and BPS Analysis by Tool, 2023 to 2033

Figure 10: Global Market Y-o-Y Growth (%) Projections by Tool, 2023 to 2033

Figure 11: Global Market Value (US$ million) Analysis by Application, 2017 to 2033

Figure 12: Global Market Value Share (%) and BPS Analysis by Application, 2023 to 2033

Figure 13: Global Market Y-o-Y Growth (%) Projections by Application, 2023 to 2033

Figure 14: Global Market Value (US$ million) Analysis by End User, 2017 to 2033

Figure 15: Global Market Value Share (%) and BPS Analysis by End User, 2023 to 2033

Figure 16: Global Market Y-o-Y Growth (%) Projections by End User, 2023 to 2033

Figure 17: Global Market Attractiveness by Tool, 2023 to 2033

Figure 18: Global Market Attractiveness by Application, 2023 to 2033

Figure 19: Global Market Attractiveness by End User, 2023 to 2033

Figure 20: Global Market Attractiveness by Region, 2023 to 2033

Figure 21: North America Market Value (US$ million) by Tool, 2023 to 2033

Figure 22: North America Market Value (US$ million) by Application, 2023 to 2033

Figure 23: North America Market Value (US$ million) by End User, 2023 to 2033

Figure 24: North America Market Value (US$ million) by Country, 2023 to 2033

Figure 25: North America Market Value (US$ million) Analysis by Country, 2017 to 2033

Figure 26: North America Market Value Share (%) and BPS Analysis by Country, 2023 to 2033

Figure 27: North America Market Y-o-Y Growth (%) Projections by Country, 2023 to 2033

Figure 28: North America Market Value (US$ million) Analysis by Tool, 2017 to 2033

Figure 29: North America Market Value Share (%) and BPS Analysis by Tool, 2023 to 2033

Figure 30: North America Market Y-o-Y Growth (%) Projections by Tool, 2023 to 2033

Figure 31: North America Market Value (US$ million) Analysis by Application, 2017 to 2033

Figure 32: North America Market Value Share (%) and BPS Analysis by Application, 2023 to 2033

Figure 33: North America Market Y-o-Y Growth (%) Projections by Application, 2023 to 2033

Figure 34: North America Market Value (US$ million) Analysis by End User, 2017 to 2033

Figure 35: North America Market Value Share (%) and BPS Analysis by End User, 2023 to 2033

Figure 36: North America Market Y-o-Y Growth (%) Projections by End User, 2023 to 2033

Figure 37: North America Market Attractiveness by Tool, 2023 to 2033

Figure 38: North America Market Attractiveness by Application, 2023 to 2033

Figure 39: North America Market Attractiveness by End User, 2023 to 2033

Figure 40: North America Market Attractiveness by Country, 2023 to 2033

Figure 41: Latin America Market Value (US$ million) by Tool, 2023 to 2033

Figure 42: Latin America Market Value (US$ million) by Application, 2023 to 2033

Figure 43: Latin America Market Value (US$ million) by End User, 2023 to 2033

Figure 44: Latin America Market Value (US$ million) by Country, 2023 to 2033

Figure 45: Latin America Market Value (US$ million) Analysis by Country, 2017 to 2033

Figure 46: Latin America Market Value Share (%) and BPS Analysis by Country, 2023 to 2033

Figure 47: Latin America Market Y-o-Y Growth (%) Projections by Country, 2023 to 2033

Figure 48: Latin America Market Value (US$ million) Analysis by Tool, 2017 to 2033

Figure 49: Latin America Market Value Share (%) and BPS Analysis by Tool, 2023 to 2033

Figure 50: Latin America Market Y-o-Y Growth (%) Projections by Tool, 2023 to 2033

Figure 51: Latin America Market Value (US$ million) Analysis by Application, 2017 to 2033

Figure 52: Latin America Market Value Share (%) and BPS Analysis by Application, 2023 to 2033

Figure 53: Latin America Market Y-o-Y Growth (%) Projections by Application, 2023 to 2033

Figure 54: Latin America Market Value (US$ million) Analysis by End User, 2017 to 2033

Figure 55: Latin America Market Value Share (%) and BPS Analysis by End User, 2023 to 2033

Figure 56: Latin America Market Y-o-Y Growth (%) Projections by End User, 2023 to 2033

Figure 57: Latin America Market Attractiveness by Tool, 2023 to 2033

Figure 58: Latin America Market Attractiveness by Application, 2023 to 2033

Figure 59: Latin America Market Attractiveness by End User, 2023 to 2033

Figure 60: Latin America Market Attractiveness by Country, 2023 to 2033

Figure 61: Western Europe Market Value (US$ million) by Tool, 2023 to 2033

Figure 62: Western Europe Market Value (US$ million) by Application, 2023 to 2033

Figure 63: Western Europe Market Value (US$ million) by End User, 2023 to 2033

Figure 64: Western Europe Market Value (US$ million) by Country, 2023 to 2033

Figure 65: Western Europe Market Value (US$ million) Analysis by Country, 2017 to 2033

Figure 66: Western Europe Market Value Share (%) and BPS Analysis by Country, 2023 to 2033

Figure 67: Western Europe Market Y-o-Y Growth (%) Projections by Country, 2023 to 2033

Figure 68: Western Europe Market Value (US$ million) Analysis by Tool, 2017 to 2033

Figure 69: Western Europe Market Value Share (%) and BPS Analysis by Tool, 2023 to 2033

Figure 70: Western Europe Market Y-o-Y Growth (%) Projections by Tool, 2023 to 2033

Figure 71: Western Europe Market Value (US$ million) Analysis by Application, 2017 to 2033

Figure 72: Western Europe Market Value Share (%) and BPS Analysis by Application, 2023 to 2033

Figure 73: Western Europe Market Y-o-Y Growth (%) Projections by Application, 2023 to 2033

Figure 74: Western Europe Market Value (US$ million) Analysis by End User, 2017 to 2033

Figure 75: Western Europe Market Value Share (%) and BPS Analysis by End User, 2023 to 2033

Figure 76: Western Europe Market Y-o-Y Growth (%) Projections by End User, 2023 to 2033

Figure 77: Western Europe Market Attractiveness by Tool, 2023 to 2033

Figure 78: Western Europe Market Attractiveness by Application, 2023 to 2033

Figure 79: Western Europe Market Attractiveness by End User, 2023 to 2033

Figure 80: Western Europe Market Attractiveness by Country, 2023 to 2033

Figure 81: Eastern Europe Market Value (US$ million) by Tool, 2023 to 2033

Figure 82: Eastern Europe Market Value (US$ million) by Application, 2023 to 2033

Figure 83: Eastern Europe Market Value (US$ million) by End User, 2023 to 2033

Figure 84: Eastern Europe Market Value (US$ million) by Country, 2023 to 2033

Figure 85: Eastern Europe Market Value (US$ million) Analysis by Country, 2017 to 2033

Figure 86: Eastern Europe Market Value Share (%) and BPS Analysis by Country, 2023 to 2033

Figure 87: Eastern Europe Market Y-o-Y Growth (%) Projections by Country, 2023 to 2033

Figure 88: Eastern Europe Market Value (US$ million) Analysis by Tool, 2017 to 2033

Figure 89: Eastern Europe Market Value Share (%) and BPS Analysis by Tool, 2023 to 2033

Figure 90: Eastern Europe Market Y-o-Y Growth (%) Projections by Tool, 2023 to 2033

Figure 91: Eastern Europe Market Value (US$ million) Analysis by Application, 2017 to 2033

Figure 92: Eastern Europe Market Value Share (%) and BPS Analysis by Application, 2023 to 2033

Figure 93: Eastern Europe Market Y-o-Y Growth (%) Projections by Application, 2023 to 2033

Figure 94: Eastern Europe Market Value (US$ million) Analysis by End User, 2017 to 2033

Figure 95: Eastern Europe Market Value Share (%) and BPS Analysis by End User, 2023 to 2033

Figure 96: Eastern Europe Market Y-o-Y Growth (%) Projections by End User, 2023 to 2033

Figure 97: Eastern Europe Market Attractiveness by Tool, 2023 to 2033

Figure 98: Eastern Europe Market Attractiveness by Application, 2023 to 2033

Figure 99: Eastern Europe Market Attractiveness by End User, 2023 to 2033

Figure 100: Eastern Europe Market Attractiveness by Country, 2023 to 2033

Figure 101: APEJ Market Value (US$ million) by Tool, 2023 to 2033

Figure 102: APEJ Market Value (US$ million) by Application, 2023 to 2033

Figure 103: APEJ Market Value (US$ million) by End User, 2023 to 2033

Figure 104: APEJ Market Value (US$ million) by Country, 2023 to 2033

Figure 105: APEJ Market Value (US$ million) Analysis by Country, 2017 to 2033

Figure 106: APEJ Market Value Share (%) and BPS Analysis by Country, 2023 to 2033

Figure 107: APEJ Market Y-o-Y Growth (%) Projections by Country, 2023 to 2033

Figure 108: APEJ Market Value (US$ million) Analysis by Tool, 2017 to 2033

Figure 109: APEJ Market Value Share (%) and BPS Analysis by Tool, 2023 to 2033

Figure 110: APEJ Market Y-o-Y Growth (%) Projections by Tool, 2023 to 2033

Figure 111: APEJ Market Value (US$ million) Analysis by Application, 2017 to 2033

Figure 112: APEJ Market Value Share (%) and BPS Analysis by Application, 2023 to 2033

Figure 113: APEJ Market Y-o-Y Growth (%) Projections by Application, 2023 to 2033

Figure 114: APEJ Market Value (US$ million) Analysis by End User, 2017 to 2033

Figure 115: APEJ Market Value Share (%) and BPS Analysis by End User, 2023 to 2033

Figure 116: APEJ Market Y-o-Y Growth (%) Projections by End User, 2023 to 2033

Figure 117: APEJ Market Attractiveness by Tool, 2023 to 2033

Figure 118: APEJ Market Attractiveness by Application, 2023 to 2033

Figure 119: APEJ Market Attractiveness by End User, 2023 to 2033

Figure 120: APEJ Market Attractiveness by Country, 2023 to 2033

Figure 121: Japan Market Value (US$ million) by Tool, 2023 to 2033

Figure 122: Japan Market Value (US$ million) by Application, 2023 to 2033

Figure 123: Japan Market Value (US$ million) by End User, 2023 to 2033

Figure 124: Japan Market Value (US$ million) by Country, 2023 to 2033

Figure 125: Japan Market Value (US$ million) Analysis by Country, 2017 to 2033

Figure 126: Japan Market Value Share (%) and BPS Analysis by Country, 2023 to 2033

Figure 127: Japan Market Y-o-Y Growth (%) Projections by Country, 2023 to 2033

Figure 128: Japan Market Value (US$ million) Analysis by Tool, 2017 to 2033

Figure 129: Japan Market Value Share (%) and BPS Analysis by Tool, 2023 to 2033

Figure 130: Japan Market Y-o-Y Growth (%) Projections by Tool, 2023 to 2033

Figure 131: Japan Market Value (US$ million) Analysis by Application, 2017 to 2033

Figure 132: Japan Market Value Share (%) and BPS Analysis by Application, 2023 to 2033

Figure 133: Japan Market Y-o-Y Growth (%) Projections by Application, 2023 to 2033

Figure 134: Japan Market Value (US$ million) Analysis by End User, 2017 to 2033

Figure 135: Japan Market Value Share (%) and BPS Analysis by End User, 2023 to 2033

Figure 136: Japan Market Y-o-Y Growth (%) Projections by End User, 2023 to 2033

Figure 137: Japan Market Attractiveness by Tool, 2023 to 2033

Figure 138: Japan Market Attractiveness by Application, 2023 to 2033

Figure 139: Japan Market Attractiveness by End User, 2023 to 2033

Figure 140: Japan Market Attractiveness by Country, 2023 to 2033

Figure 141: MEA Market Value (US$ million) by Tool, 2023 to 2033

Figure 142: MEA Market Value (US$ million) by Application, 2023 to 2033

Figure 143: MEA Market Value (US$ million) by End User, 2023 to 2033

Figure 144: MEA Market Value (US$ million) by Country, 2023 to 2033

Figure 145: MEA Market Value (US$ million) Analysis by Country, 2017 to 2033

Figure 146: MEA Market Value Share (%) and BPS Analysis by Country, 2023 to 2033

Figure 147: MEA Market Y-o-Y Growth (%) Projections by Country, 2023 to 2033

Figure 148: MEA Market Value (US$ million) Analysis by Tool, 2017 to 2033

Figure 149: MEA Market Value Share (%) and BPS Analysis by Tool, 2023 to 2033

Figure 150: MEA Market Y-o-Y Growth (%) Projections by Tool, 2023 to 2033

Figure 151: MEA Market Value (US$ million) Analysis by Application, 2017 to 2033

Figure 152: MEA Market Value Share (%) and BPS Analysis by Application, 2023 to 2033

Figure 153: MEA Market Y-o-Y Growth (%) Projections by Application, 2023 to 2033

Figure 154: MEA Market Value (US$ million) Analysis by End User, 2017 to 2033

Figure 155: MEA Market Value Share (%) and BPS Analysis by End User, 2023 to 2033

Figure 156: MEA Market Y-o-Y Growth (%) Projections by End User, 2023 to 2033

Figure 157: MEA Market Attractiveness by Tool, 2023 to 2033

Figure 158: MEA Market Attractiveness by Application, 2023 to 2033

Figure 159: MEA Market Attractiveness by End User, 2023 to 2033

Figure 160: MEA Market Attractiveness by Country, 2023 to 2033

Recommendations

Technology

Enterprise Rights Management Solution Market

Published : September 2022

Technology

Enterprise Asset Management Market

Published : June 2022

Explore Technology Insights

View Reports
Google translate

Enterprise A2P SMS Market