Hybrid Reactive Power and Harmonic Compensation Device Market Forecast and Outlook 2025 to 2035

The global hybrid reactive power and harmonic compensation device market is projected to grow from USD 419.2 million in 2025 to approximately USD 669.9 million by 2035, recording an absolute increase of USD 250.73 million over the forecast period. This translates into a total growth of 59.8%, with the market forecast to expand CAGR of 4.8% between 2025 and 2035. The overall market size is expected to grow by nearly 1.6X during the same period, supported by increasing power quality requirements in industrial facilities, growing adoption of renewable energy integration systems, and rising demand for harmonic mitigation solutions in complex electrical distribution networks.

The market expansion reflects fundamental shifts in power system management, where traditional passive compensation methods face limitations addressing dynamic power quality challenges. Modern hybrid devices combine active and passive compensation technologies, enabling simultaneous reactive power correction and harmonic filtering across varying load conditions. These systems support grid stability while protecting sensitive equipment from voltage disturbances and harmonic distortion that compromise operational efficiency and equipment lifespan.
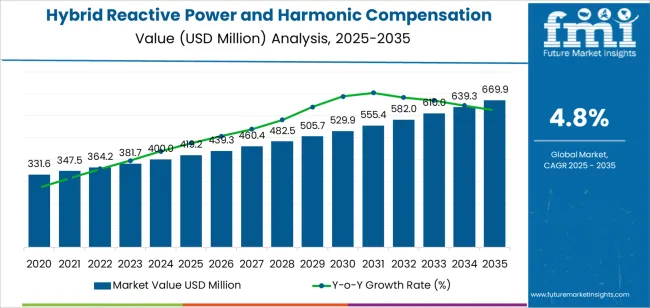
Quick Stats for Hybrid Reactive Power and Harmonic Compensation Device Market

  • Hybrid Reactive Power and Harmonic Compensation Device Market Value (2025): USD 419.2 million
  • Hybrid Reactive Power and Harmonic Compensation Device Market Forecast Value (2035): USD 669.9 million
  • Hybrid Reactive Power and Harmonic Compensation Device Market CAGR: 4.8%
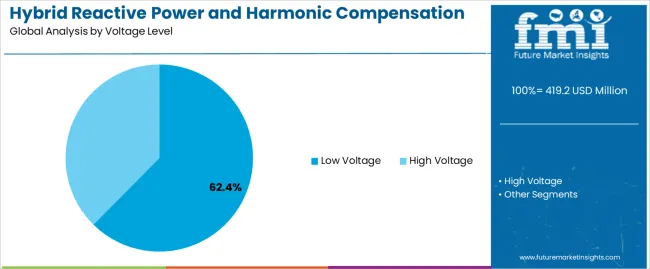
  • Leading Segment by Voltage Level (2025): Low Voltage (62.4%)
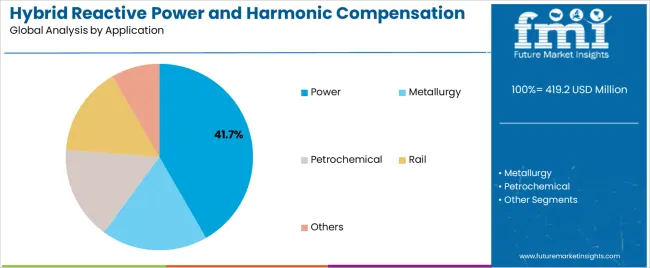
  • Leading Segment by Application (2025): Power (41.7%)
  • Key Growth Regions: Asia Pacific, North America, and Europe
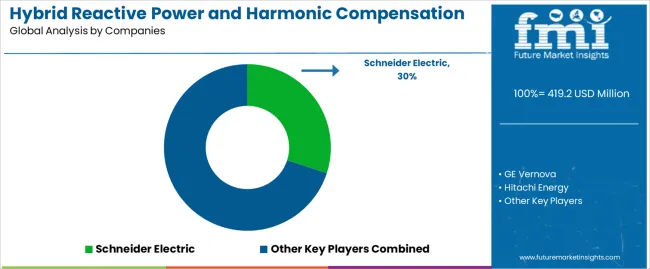
  • Top Companies by Market Share: Schneider Electric, GE Vernova, Hitachi Energy

Hybrid Reactive Power And Harmonic Compensation Device Market Market Value Analysis

Technological advancement continues to reshape product capabilities, with manufacturers developing intelligent control systems that monitor power quality parameters in real-time and adjust compensation dynamically. Advanced power electronics and digital signal processing enable precise harmonic cancellation and reactive power management across wide frequency ranges. Integration with building management systems and industrial automation platforms provides comprehensive power quality monitoring and predictive maintenance capabilities that reduce downtime and optimize energy consumption.

Regional dynamics demonstrate varied adoption patterns influenced by industrial base composition, power infrastructure maturity, and regulatory frameworks governing power quality standards. Developed markets show steady implementation driven by equipment protection requirements and energy efficiency initiatives, while emerging economies experience accelerated adoption as manufacturing capacity expands and power quality awareness increases. Grid modernization programs, renewable energy penetration, and industrial automation advancement create sustained demand across different geographies with varying power system characteristics.

Hybrid Reactive Power and Harmonic Compensation Device Market Key Takeaways

Metric Value
Market Value (2025) USD 419.2 million
Market Forecast Value (2035) USD 669.9 million
Forecast CAGR (2025-2035) 4.8%

Why is the Hybrid Reactive Power and Harmonic Compensation Device Market Growing?

POWER QUALITY DRIVERS INDUSTRIAL REQUIREMENTS GRID INFRASTRUCTURE
Equipment Protection Needs Automation Expansion Grid Modernization Programs
Growing awareness of power quality impact on sensitive equipment driving investments in harmonic mitigation and voltage stabilization solutions. Industrial automation and variable frequency drive proliferation creating harmonic distortion requiring comprehensive compensation systems. Smart grid development and distribution network upgrades incorporating advanced power quality management capabilities.
Energy Efficiency Standards Manufacturing Complexity Renewable Integration
Regulatory frameworks establishing power factor correction requirements and energy efficiency benchmarks for industrial facilities. Advanced manufacturing processes with precision equipment requiring stable power quality for optimal performance and product quality. Wind and solar power integration creating dynamic power quality challenges requiring sophisticated compensation technologies.
Operational Cost Reduction Process Continuity Requirements Distribution Network Stability
Focus on reducing energy costs through improved power factor and elimination of utility penalties for poor power quality. Critical industrial processes demanding uninterrupted operation and protection from power quality disturbances affecting production. Distribution system operators implementing voltage regulation and harmonic management to maintain network reliability.

Hybrid Reactive Power and Harmonic Compensation Device Market Segmentation

Category Segments Covered
By Voltage Level Low Voltage, High Voltage
By Application Power, Metallurgy, Petrochemical, Rail, Others
By Region North America, Europe, Asia Pacific, Latin America, Middle East & Africa

Hybrid Reactive Power and Harmonic Compensation Device Market Analysis by Voltage Level

Hybrid Reactive Power And Harmonic Compensation Device Market Analysis By Voltage Level

Segment 2025 to 2035 Outlook
Low Voltage
  • Leader in 2025 with 62.4% market share, maintaining dominance through 2035. Addresses power quality requirements in commercial buildings, light industrial facilities, and distribution network endpoints. Broader application base and higher installation volumes driven by equipment protection needs across diverse facility types. Cost-effective solutions enabling adoption in smaller facilities with limited power quality budgets.
  • Momentum: strong growth driven by industrial automation expansion and building management system integration.
  • Watchouts: competition from simpler passive compensation in basic applications, technical complexity limiting adoption in facilities lacking electrical engineering expertise.
High Voltage
  • Significant segment with 37.6% share in 2025, serving utility substations, heavy industrial facilities, and large commercial complexes. Higher power ratings and advanced compensation capabilities addressing complex harmonic environments in major industrial operations. Premium pricing reflects sophisticated control systems and specialized manufacturing requirements. Integration with SCADA systems and utility network management platforms.
  • Momentum: steady growth aligned with industrial capacity expansion and utility grid modernization programs.
  • Watchouts: long project cycles and utility approval requirements affecting implementation timelines, high capital costs limiting adoption to critical applications.

Hybrid Reactive Power and Harmonic Compensation Device Market Analysis by Application

Hybrid Reactive Power And Harmonic Compensation Device Market Analysis By Application

Segment 2025 to 2035 Outlook
Power
  • Dominant application at 41.7% market share in 2025, encompassing utility substations, power generation facilities, and transmission infrastructure. Grid stability requirements and voltage regulation needs driving systematic deployment. Integration with distribution management systems supporting network optimization. Large-scale implementations with comprehensive monitoring capabilities.
  • Momentum: strong growth aligned with grid modernization and renewable energy integration requirements.
  • Watchouts: regulatory approval complexity, long procurement cycles affecting market dynamics.
Metallurgy
  • Significant segment with 23.8% share in 2025, addressing severe harmonic environments in steel mills, aluminum smelters, and metal processing facilities. Arc furnaces and induction heating equipment creating intense harmonic distortion requiring robust compensation solutions. Critical equipment protection and process continuity driving investment decisions.
  • Momentum: moderate growth driven by manufacturing capacity expansion in emerging markets.
  • Watchouts: commodity price cycles affecting capital investment patterns, competition from alternative compensation technologies.
Petrochemical
  • Important application at 18.6% share serving refineries, chemical processing plants, and oil and gas facilities. Complex electrical loads and critical process requirements demanding reliable power quality management. Safety standards and operational continuity requirements supporting premium solution adoption. Integration with distributed control systems.
  • Momentum: steady growth aligned with petrochemical capacity additions and facility modernization programs.
  • Watchouts: project delays and budget constraints in volatile commodity markets.
Rail
  • Growing segment with 11.2% share addressing electrified rail systems, metro networks, and high-speed rail infrastructure. Traction power systems creating unique harmonic characteristics requiring specialized compensation approaches. Grid interaction requirements and power quality standards driving adoption.
  • Momentum: rising growth driven by urban transit expansion and rail electrification programs.
  • Watchouts: project-based demand creating revenue volatility, specialized requirements limiting supplier base.
Others
  • Residual applications at 4.7% including data centers, healthcare facilities, mining operations, and other specialized industrial environments with specific power quality requirements. Diverse application characteristics and niche technical specifications supporting selective adoption.

What are the Key Trends, Drivers, and Restraints in the Hybrid Reactive Power and Harmonic Compensation Device Market? 

DRIVERS RESTRAINTS KEY TRENDS
Industrial Automation Growth High Capital Investment Digital Integration
Expanding adoption of variable frequency drives and automation systems creating harmonic distortion requiring sophisticated compensation solutions. Substantial upfront costs and engineering requirements limiting adoption in cost-sensitive industrial facilities and smaller commercial operations. Integration with industrial Internet of Things platforms and cloud-based monitoring enabling predictive maintenance and remote diagnostics.
Power Quality Standards Technical Complexity Modular System Design
Regulatory frameworks establishing strict power factor and harmonic distortion limits driving systematic implementation across industrial facilities. Complex system design and commissioning requirements demanding specialized engineering expertise affecting implementation in resource-constrained markets. Development of scalable, modular architectures enabling flexible capacity expansion and simplified installation reducing project complexity.
Renewable Energy Integration Competition from Alternatives Advanced Control Algorithms
Grid-connected solar and wind installations requiring dynamic compensation capabilities managing variable power flows and voltage fluctuations. Static var compensators and other alternative technologies providing competitive solutions for specific applications affecting market segmentation. Artificial intelligence and machine learning algorithms optimizing compensation performance and adapting to changing load patterns automatically.

What is the Outlook for the Hybrid Reactive Power and Harmonic Compensation Device Market in Key Countries?

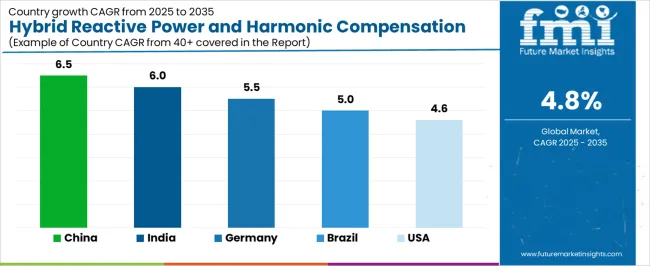
Hybrid Reactive Power And Harmonic Compensation Device Market Cagr Analysis By Country

Country CAGR (2025-2035)
China 6.5%
India 6.0%
Germany 5.5%
Brazil 5.0%
United States 4.6%

Why is China Leading Global Growth in Hybrid Reactive Power and Harmonic Compensation Devices?

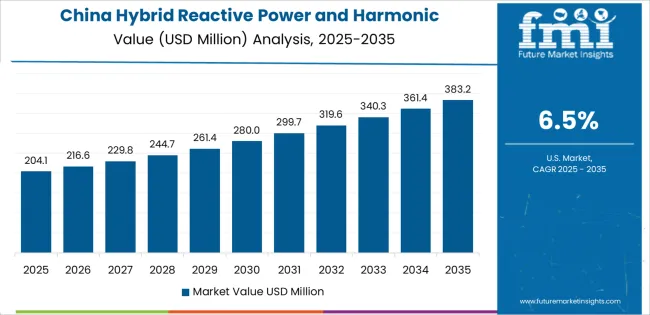
Hybrid Reactive Power And Harmonic Compensation Device Market Country Value Analysis

Hybrid reactive power and harmonic compensation device market in China is projected to grow at a CAGR of 6.5% from 2025 to 2035. Revenue from hybrid reactive power and harmonic compensation devices in China is expected to exhibit strong growth, with substantial market value by 2035, driven by comprehensive manufacturing capacity expansion and power infrastructure modernization creating sustained demand for power quality management solutions. The country's industrial development and grid upgrade programs are creating substantial opportunities for compensation device suppliers.

Major industrial zones in Guangdong, Jiangsu, Zhejiang, and inland manufacturing centers maintain complex electrical loads requiring sophisticated power quality management. Manufacturing sector growth and factory automation programs are supporting widespread adoption of harmonic compensation technologies addressing equipment protection requirements. Government initiatives promoting energy efficiency and industrial quality improvement are creating demand for advanced power quality solutions. Renewable energy integration programs and smart grid development are driving utility-scale compensation system deployment. Heavy industry expansion, including steel, petrochemical, and manufacturing facilities, is creating opportunities for high-voltage compensation systems throughout major industrial regions.

What is Driving the Demand for Hybrid Reactive Power and Harmonic Compensation Devices in India?

Demand for hybrid reactive power and harmonic compensation device in India is expanding at a CAGR of 6.0% from 2025 to 2035. Revenue from hybrid reactive power and harmonic compensation devices in India is expanding substantially by 2035, supported by industrial corridor development and power infrastructure modernization creating sustained demand across metropolitan and emerging manufacturing centers. The country's Make in India initiatives and industrial development programs are driving manufacturing capacity additions requiring power quality management systems.

Major industrial states including Maharashtra, Gujarat, Tamil Nadu, and Karnataka maintain growing electrical load complexity. Metro rail expansion and urban transit electrification programs are facilitating specialized compensation system deployment. Manufacturing sector development and industrial automation adoption are creating demand for harmonic mitigation solutions. Power distribution network upgrades and smart city initiatives are supporting utility-scale compensation system implementation. Industrial cluster development and special economic zone expansion are enhancing requirements for reliable power quality solutions throughout major manufacturing regions.

How is Germany Maintaining Leadership in Hybrid Reactive Power and Harmonic Compensation Devices?

Hybrid reactive power and harmonic compensation device market in Germany is anticipated to grow at a CAGR of 5.5% from 2025 to 2035. Demand for hybrid reactive power and harmonic compensation devices in Germany is expected to reach substantial levels by 2035, supported by advanced manufacturing infrastructure and stringent power quality standards requiring sophisticated compensation technologies. German industrial facilities maintain comprehensive power quality management systems supporting equipment protection and energy efficiency objectives. The market is characterized by an emphasis on system reliability, advanced control capabilities, and compliance with grid connection requirements.

Automotive manufacturing and precision engineering sectors prioritize power quality management supporting production equipment reliability. Renewable energy integration and distributed generation development are driving grid-connected compensation system adoption. Industrial facility modernization and Industry 4.0 implementation programs are creating demand for intelligent compensation systems with digital integration capabilities. Export-oriented manufacturing operations and industrial automation excellence are sustaining requirements for advanced power quality solutions throughout major industrial regions.

How is Brazil Expanding its Market for Hybrid Reactive Power and Harmonic Compensation Devices?

Hybrid reactive power and harmonic compensation device market in Brazil is forecasted to expand at a CAGR of 5.0% from 2025 to 2035. Revenue from hybrid reactive power and harmonic compensation devices in Brazil is growing substantially by 2035, driven by industrial development and power infrastructure investment creating opportunities for power quality management suppliers. The country's manufacturing base expansion and mining sector operations are creating demand for compensation systems. Major industrial centers in São Paulo, Minas Gerais, and Rio Grande do Sul maintain complex electrical loads requiring power quality management.

Petrochemical facility expansion and oil and gas infrastructure development are facilitating industrial-scale compensation system deployment. Manufacturing sector growth and industrial automation adoption are creating demand for harmonic mitigation technologies. Power distribution network modernization and utility grid upgrade programs are supporting compensation system implementation. Mining operations and heavy industrial facilities are creating opportunities for robust compensation solutions throughout resource extraction and processing regions.

What is Driving the Demand for Hybrid Reactive Power and Harmonic Compensation Devices in the United States?

Hybrid reactive power and harmonic compensation device market in the United States is expected to grow at a CAGR of 4.6% from 2025 to 2035. Demand for hybrid reactive power and harmonic compensation devices in the United States is expanding to reach substantial levels by 2035, driven by grid modernization initiatives and renewable energy integration creating sustained demand across utility and industrial sectors. The country's aging power infrastructure and smart grid development programs support systematic compensation system deployment.

Manufacturing facilities, data centers, and commercial complexes maintain comprehensive power quality management requirements. Renewable energy portfolio standards and distributed generation growth are driving grid-connected compensation system adoption. Industrial facility expansion and automation technology implementation are creating harmonic mitigation requirements. Utility distribution network upgrades and voltage regulation programs are supporting compensation system deployment. Electric vehicle charging infrastructure and electrification initiatives are creating new power quality challenges requiring advanced compensation capabilities across metropolitan and industrial regions.
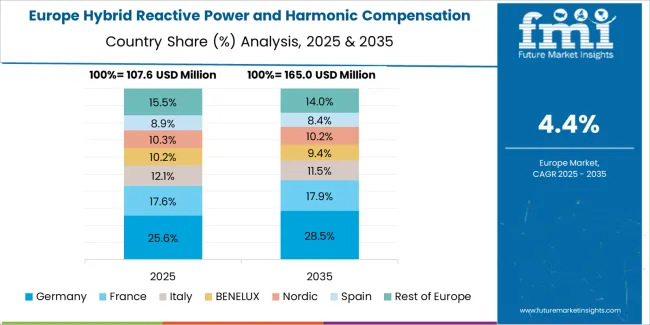
Europe Market Split by Country

Hybrid Reactive Power And Harmonic Compensation Device Market Europe Country Market Share Analysis, 2025 & 2035

The hybrid reactive power and harmonic compensation device market in Europe is projected to grow from USD 107.54 million in 2025 to USD 171.48 million by 2035, registering a CAGR of 4.8% over the forecast period. Germany is expected to maintain its leadership position with a 35.8% market share in 2025, growing to 36.2% by 2035, supported by advanced industrial infrastructure and comprehensive power quality standards across manufacturing facilities and utility networks.

France follows with a 22.7% share in 2025, projected to reach 23.0% by 2035, driven by industrial modernization programs and renewable energy integration requirements. The United Kingdom holds a 16.4% share in 2025, expected to maintain 16.2% through 2035 reflecting steady industrial activity and grid upgrade initiatives. Italy commands a 14.3% share in 2025, while Spain accounts for 10.8% in 2025, both maintaining stable positions through ongoing industrial operations and power infrastructure investments. The Rest of Europe region maintains approximately 10.0% share, attributed to manufacturing activity in Nordic countries and Eastern European industrial development supporting power quality management adoption.
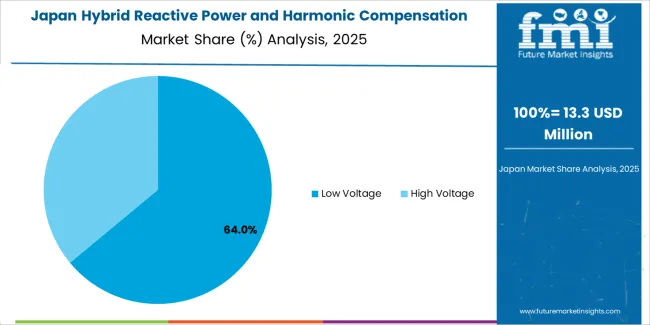
Premium Quality Standards Define Japanese Market Dynamics

Hybrid Reactive Power And Harmonic Compensation Device Market Japan Market Share Analysis By Voltage Level

Japanese hybrid reactive power and harmonic compensation device operations reflect the country's advanced manufacturing standards and comprehensive power quality management culture. Industrial facilities maintain sophisticated electrical systems with integrated power quality monitoring and compensation capabilities. The regulatory environment and utility grid connection standards establish stringent performance requirements for compensation equipment.

Manufacturing facilities prioritize system reliability and advanced control capabilities, with procurement decisions emphasizing proven technologies demonstrating consistent performance. Major industrial equipment suppliers provide comprehensive technical support and system integration services essential for complex power quality applications. The Japanese market demonstrates preference for compact, high-performance systems with advanced digital interfaces and remote monitoring capabilities. Industrial automation sophistication and precision manufacturing requirements create demand for intelligent compensation systems supporting equipment protection and operational continuity across automotive, electronics, and machinery manufacturing facilities.
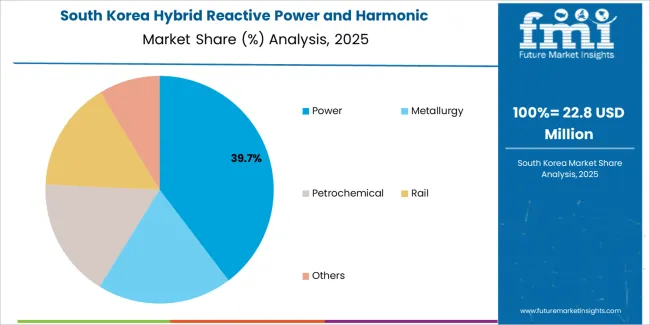
Market Dynamics Drive Innovation in South Korea

Hybrid Reactive Power And Harmonic Compensation Device Market South Korea Market Share Analysis By Application

South Korean hybrid reactive power and harmonic compensation device operations reflect the country's technologically advanced industrial sector and growing power quality awareness. Major industrial complexes including semiconductor fabrication, automotive manufacturing, and petrochemical facilities maintain comprehensive power quality management systems. Industrial supply chains provide efficient equipment procurement supporting manufacturing reliability requirements.

Manufacturing facilities prioritize advanced compensation capabilities and system integration with facility automation platforms. Procurement strategies emphasize technology leadership and compatibility with smart manufacturing initiatives. The market benefits from industrial development policies supporting manufacturing sector competitiveness and facility modernization. Local manufacturers and international suppliers compete across segments, with market dynamics favoring systems demonstrating superior performance and seamless integration with industrial control systems in high-value manufacturing environments.
What is the Competitive Landscape of the Hybrid Reactive Power and Harmonic Compensation Device Market?

Hybrid Reactive Power And Harmonic Compensation Device Market Analysis By Company

Market structure reflects concentration among established power electronics manufacturers and electrical equipment suppliers with comprehensive power quality portfolios. Value creation centers on technological innovation, system integration capabilities, and demonstrated performance in demanding industrial environments. Leading manufacturers maintain competitive positions through comprehensive offerings combining hardware, control software, and engineering services that establish long-term customer relationships extending across equipment lifecycle.

Profit pools concentrate in high-voltage segments and specialized industrial applications where complex harmonic environments and critical process requirements justify premium pricing. Custom-engineered solutions for unique applications generate higher margins compared to standardized low-voltage products. Service contracts and performance optimization programs provide recurring revenue streams supporting competitive equipment pricing. Emerging markets favor cost-competitive solutions, while developed markets prioritize advanced features and proven reliability.

Competitive dynamics demonstrate increasing emphasis on digital integration and intelligent control capabilities as product differentiation shifts beyond traditional power electronics specifications. Suppliers invest in software development and cloud connectivity enabling remote monitoring, predictive maintenance, and performance optimization services. System integration capabilities with building management platforms and industrial automation systems become essential differentiators. Cybersecurity features and data analytics capabilities enhance value propositions addressing connected infrastructure requirements.

Market consolidation occurs through acquisitions targeting complementary technologies and geographic expansion. Global electrical equipment manufacturers acquire specialized power quality technology providers to strengthen power management portfolios. Distribution partnerships and engineering collaboration agreements provide market access in regions requiring local technical support and utility relationship management. Vertical integration into power electronics component manufacturing and control system development supports technology leadership and cost competitiveness in competitive market segments.

Key Players in the Hybrid Reactive Power and Harmonic Compensation Device Market

  • Schneider Electric
  • GE Vernova
  • Hitachi Energy
  • Acrel
  • RENLE
  • LV BO JIE NENG

Scope of the Report

Items Values
Quantitative Units USD 419.2 million
Voltage Level Low Voltage, High Voltage
Application Power, Metallurgy, Petrochemical, Rail, Others
Regions Covered North America, Latin America, Europe, Asia Pacific, Middle East & Africa
Country Covered United States, Germany, China, India, Brazil, and other 40+ countries
Key Companies Profiled Schneider Electric, GE Vernova, Hitachi Energy, Acrel, RENLE, LV BO JIE NENG
Additional Attributes Dollar sales by voltage level and application, regional demand across North America, Europe, Asia Pacific, competitive landscape, digital integration advancement, modular system development, and industrial automation expansion driving power quality management enhancement, grid stability improvement, and equipment protection optimization


Hybrid Reactive Power and Harmonic Compensation Device Market Segmentation

By Voltage Level

  • Low Voltage
  • High Voltage

By Application

  • Power
  • Metallurgy
  • Petrochemical
  • Rail
  • Others

By Region

  • North America
  • Europe
  • Asia Pacific
  • Latin America
  • Middle East & Africa

Frequently Asked Questions

How big is the hybrid reactive power and harmonic compensation device market in 2025?

The global hybrid reactive power and harmonic compensation device market is estimated to be valued at USD 419.2 million in 2025.

What will be the size of hybrid reactive power and harmonic compensation device market in 2035?

The market size for the hybrid reactive power and harmonic compensation device market is projected to reach USD 669.9 million by 2035.

How much will be the hybrid reactive power and harmonic compensation device market growth between 2025 and 2035?

The hybrid reactive power and harmonic compensation device market is expected to grow at a 4.8% CAGR between 2025 and 2035.

What are the key product types in the hybrid reactive power and harmonic compensation device market?

The key product types in hybrid reactive power and harmonic compensation device market are low voltage and high voltage.

Which application segment to contribute significant share in the hybrid reactive power and harmonic compensation device market in 2025?

In terms of application, power segment to command 41.7% share in the hybrid reactive power and harmonic compensation device market in 2025.

Table of Content

  1. Executive Summary
    • Global Market Outlook
    • Demand to side Trends
    • Supply to side Trends
    • Technology Roadmap Analysis
    • Analysis and Recommendations
  2. Market Overview
    • Market Coverage / Taxonomy
    • Market Definition / Scope / Limitations
  3. Market Background
    • Market Dynamics
      • Drivers
      • Restraints
      • Opportunity
      • Trends
    • Scenario Forecast
      • Demand in Optimistic Scenario
      • Demand in Likely Scenario
      • Demand in Conservative Scenario
    • Opportunity Map Analysis
    • Product Life Cycle Analysis
    • Supply Chain Analysis
    • Investment Feasibility Matrix
    • Value Chain Analysis
    • PESTLE and Porter’s Analysis
    • Regulatory Landscape
    • Regional Parent Market Outlook
    • Production and Consumption Statistics
    • Import and Export Statistics
  4. Global Market Analysis 2020 to 2024 and Forecast, 2025 to 2035
    • Historical Market Size Value (USD Million) Analysis, 2020 to 2024
    • Current and Future Market Size Value (USD Million) Projections, 2025 to 2035
      • Y to o to Y Growth Trend Analysis
      • Absolute $ Opportunity Analysis
  5. Global Market Pricing Analysis 2020 to 2024 and Forecast 2025 to 2035
  6. Global Market Analysis 2020 to 2024 and Forecast 2025 to 2035, By Voltage Level
    • Introduction / Key Findings
    • Historical Market Size Value (USD Million) Analysis By Voltage Level , 2020 to 2024
    • Current and Future Market Size Value (USD Million) Analysis and Forecast By Voltage Level , 2025 to 2035
      • Low Voltage
      • High Voltage
    • Y to o to Y Growth Trend Analysis By Voltage Level , 2020 to 2024
    • Absolute $ Opportunity Analysis By Voltage Level , 2025 to 2035
  7. Global Market Analysis 2020 to 2024 and Forecast 2025 to 2035, By Application
    • Introduction / Key Findings
    • Historical Market Size Value (USD Million) Analysis By Application, 2020 to 2024
    • Current and Future Market Size Value (USD Million) Analysis and Forecast By Application, 2025 to 2035
      • Power
      • Metallurgy
      • Petrochemical
      • Rail
      • Others
    • Y to o to Y Growth Trend Analysis By Application, 2020 to 2024
    • Absolute $ Opportunity Analysis By Application, 2025 to 2035
  8. Global Market Analysis 2020 to 2024 and Forecast 2025 to 2035, By Region
    • Introduction
    • Historical Market Size Value (USD Million) Analysis By Region, 2020 to 2024
    • Current Market Size Value (USD Million) Analysis and Forecast By Region, 2025 to 2035
      • North America
      • Latin America
      • Western Europe
      • Eastern Europe
      • East Asia
      • South Asia and Pacific
      • Middle East & Africa
    • Market Attractiveness Analysis By Region
  9. North America Market Analysis 2020 to 2024 and Forecast 2025 to 2035, By Country
    • Historical Market Size Value (USD Million) Trend Analysis By Market Taxonomy, 2020 to 2024
    • Market Size Value (USD Million) Forecast By Market Taxonomy, 2025 to 2035
      • By Country
        • USA
        • Canada
        • Mexico
      • By Voltage Level
      • By Application
    • Market Attractiveness Analysis
      • By Country
      • By Voltage Level
      • By Application
    • Key Takeaways
  10. Latin America Market Analysis 2020 to 2024 and Forecast 2025 to 2035, By Country
    • Historical Market Size Value (USD Million) Trend Analysis By Market Taxonomy, 2020 to 2024
    • Market Size Value (USD Million) Forecast By Market Taxonomy, 2025 to 2035
      • By Country
        • Brazil
        • Chile
        • Rest of Latin America
      • By Voltage Level
      • By Application
    • Market Attractiveness Analysis
      • By Country
      • By Voltage Level
      • By Application
    • Key Takeaways
  11. Western Europe Market Analysis 2020 to 2024 and Forecast 2025 to 2035, By Country
    • Historical Market Size Value (USD Million) Trend Analysis By Market Taxonomy, 2020 to 2024
    • Market Size Value (USD Million) Forecast By Market Taxonomy, 2025 to 2035
      • By Country
        • Germany
        • UK
        • Italy
        • Spain
        • France
        • Nordic
        • BENELUX
        • Rest of Western Europe
      • By Voltage Level
      • By Application
    • Market Attractiveness Analysis
      • By Country
      • By Voltage Level
      • By Application
    • Key Takeaways
  12. Eastern Europe Market Analysis 2020 to 2024 and Forecast 2025 to 2035, By Country
    • Historical Market Size Value (USD Million) Trend Analysis By Market Taxonomy, 2020 to 2024
    • Market Size Value (USD Million) Forecast By Market Taxonomy, 2025 to 2035
      • By Country
        • Russia
        • Poland
        • Hungary
        • Balkan & Baltic
        • Rest of Eastern Europe
      • By Voltage Level
      • By Application
    • Market Attractiveness Analysis
      • By Country
      • By Voltage Level
      • By Application
    • Key Takeaways
  13. East Asia Market Analysis 2020 to 2024 and Forecast 2025 to 2035, By Country
    • Historical Market Size Value (USD Million) Trend Analysis By Market Taxonomy, 2020 to 2024
    • Market Size Value (USD Million) Forecast By Market Taxonomy, 2025 to 2035
      • By Country
        • China
        • Japan
        • South Korea
      • By Voltage Level
      • By Application
    • Market Attractiveness Analysis
      • By Country
      • By Voltage Level
      • By Application
    • Key Takeaways
  14. South Asia and Pacific Market Analysis 2020 to 2024 and Forecast 2025 to 2035, By Country
    • Historical Market Size Value (USD Million) Trend Analysis By Market Taxonomy, 2020 to 2024
    • Market Size Value (USD Million) Forecast By Market Taxonomy, 2025 to 2035
      • By Country
        • India
        • ASEAN
        • Australia & New Zealand
        • Rest of South Asia and Pacific
      • By Voltage Level
      • By Application
    • Market Attractiveness Analysis
      • By Country
      • By Voltage Level
      • By Application
    • Key Takeaways
  15. Middle East & Africa Market Analysis 2020 to 2024 and Forecast 2025 to 2035, By Country
    • Historical Market Size Value (USD Million) Trend Analysis By Market Taxonomy, 2020 to 2024
    • Market Size Value (USD Million) Forecast By Market Taxonomy, 2025 to 2035
      • By Country
        • Kingdom of Saudi Arabia
        • Other GCC Countries
        • Turkiye
        • South Africa
        • Other African Union
        • Rest of Middle East & Africa
      • By Voltage Level
      • By Application
    • Market Attractiveness Analysis
      • By Country
      • By Voltage Level
      • By Application
    • Key Takeaways
  16. Key Countries Market Analysis
    • USA
      • Pricing Analysis
      • Market Share Analysis, 2024
        • By Voltage Level
        • By Application
    • Canada
      • Pricing Analysis
      • Market Share Analysis, 2024
        • By Voltage Level
        • By Application
    • Mexico
      • Pricing Analysis
      • Market Share Analysis, 2024
        • By Voltage Level
        • By Application
    • Brazil
      • Pricing Analysis
      • Market Share Analysis, 2024
        • By Voltage Level
        • By Application
    • Chile
      • Pricing Analysis
      • Market Share Analysis, 2024
        • By Voltage Level
        • By Application
    • Germany
      • Pricing Analysis
      • Market Share Analysis, 2024
        • By Voltage Level
        • By Application
    • UK
      • Pricing Analysis
      • Market Share Analysis, 2024
        • By Voltage Level
        • By Application
    • Italy
      • Pricing Analysis
      • Market Share Analysis, 2024
        • By Voltage Level
        • By Application
    • Spain
      • Pricing Analysis
      • Market Share Analysis, 2024
        • By Voltage Level
        • By Application
    • France
      • Pricing Analysis
      • Market Share Analysis, 2024
        • By Voltage Level
        • By Application
    • India
      • Pricing Analysis
      • Market Share Analysis, 2024
        • By Voltage Level
        • By Application
    • ASEAN
      • Pricing Analysis
      • Market Share Analysis, 2024
        • By Voltage Level
        • By Application
    • Australia & New Zealand
      • Pricing Analysis
      • Market Share Analysis, 2024
        • By Voltage Level
        • By Application
    • China
      • Pricing Analysis
      • Market Share Analysis, 2024
        • By Voltage Level
        • By Application
    • Japan
      • Pricing Analysis
      • Market Share Analysis, 2024
        • By Voltage Level
        • By Application
    • South Korea
      • Pricing Analysis
      • Market Share Analysis, 2024
        • By Voltage Level
        • By Application
    • Russia
      • Pricing Analysis
      • Market Share Analysis, 2024
        • By Voltage Level
        • By Application
    • Poland
      • Pricing Analysis
      • Market Share Analysis, 2024
        • By Voltage Level
        • By Application
    • Hungary
      • Pricing Analysis
      • Market Share Analysis, 2024
        • By Voltage Level
        • By Application
    • Kingdom of Saudi Arabia
      • Pricing Analysis
      • Market Share Analysis, 2024
        • By Voltage Level
        • By Application
    • Turkiye
      • Pricing Analysis
      • Market Share Analysis, 2024
        • By Voltage Level
        • By Application
    • South Africa
      • Pricing Analysis
      • Market Share Analysis, 2024
        • By Voltage Level
        • By Application
  17. Market Structure Analysis
    • Competition Dashboard
    • Competition Benchmarking
    • Market Share Analysis of Top Players
      • By Regional
      • By Voltage Level
      • By Application
  18. Competition Analysis
    • Competition Deep Dive
      • Schneider Electric
        • Overview
        • Product Portfolio
        • Profitability by Market Segments (Product/Age /Sales Channel/Region)
        • Sales Footprint
        • Strategy Overview
          • Marketing Strategy
          • Product Strategy
          • Channel Strategy
      • GE Vernova
      • Hitachi Energy
      • Acrel
      • RENLE
      • LV BO JIE NENG
  19. Assumptions & Acronyms Used
  20. Research Methodology

List of Tables

  • Table 1: Global Market Value (USD Million) Forecast by Region, 2020 to 2035
  • Table 2: Global Market Value (USD Million) Forecast by Voltage Level , 2020 to 2035
  • Table 3: Global Market Value (USD Million) Forecast by Application, 2020 to 2035
  • Table 4: North America Market Value (USD Million) Forecast by Country, 2020 to 2035
  • Table 5: North America Market Value (USD Million) Forecast by Voltage Level , 2020 to 2035
  • Table 6: North America Market Value (USD Million) Forecast by Application, 2020 to 2035
  • Table 7: Latin America Market Value (USD Million) Forecast by Country, 2020 to 2035
  • Table 8: Latin America Market Value (USD Million) Forecast by Voltage Level , 2020 to 2035
  • Table 9: Latin America Market Value (USD Million) Forecast by Application, 2020 to 2035
  • Table 10: Western Europe Market Value (USD Million) Forecast by Country, 2020 to 2035
  • Table 11: Western Europe Market Value (USD Million) Forecast by Voltage Level , 2020 to 2035
  • Table 12: Western Europe Market Value (USD Million) Forecast by Application, 2020 to 2035
  • Table 13: Eastern Europe Market Value (USD Million) Forecast by Country, 2020 to 2035
  • Table 14: Eastern Europe Market Value (USD Million) Forecast by Voltage Level , 2020 to 2035
  • Table 15: Eastern Europe Market Value (USD Million) Forecast by Application, 2020 to 2035
  • Table 16: East Asia Market Value (USD Million) Forecast by Country, 2020 to 2035
  • Table 17: East Asia Market Value (USD Million) Forecast by Voltage Level , 2020 to 2035
  • Table 18: East Asia Market Value (USD Million) Forecast by Application, 2020 to 2035
  • Table 19: South Asia and Pacific Market Value (USD Million) Forecast by Country, 2020 to 2035
  • Table 20: South Asia and Pacific Market Value (USD Million) Forecast by Voltage Level , 2020 to 2035
  • Table 21: South Asia and Pacific Market Value (USD Million) Forecast by Application, 2020 to 2035
  • Table 22: Middle East & Africa Market Value (USD Million) Forecast by Country, 2020 to 2035
  • Table 23: Middle East & Africa Market Value (USD Million) Forecast by Voltage Level , 2020 to 2035
  • Table 24: Middle East & Africa Market Value (USD Million) Forecast by Application, 2020 to 2035

List of Figures

  • Figure 1: Global Market Pricing Analysis
  • Figure 2: Global Market Value (USD Million) Forecast 2020-2035
  • Figure 3: Global Market Value Share and BPS Analysis by Voltage Level , 2025 and 2035
  • Figure 4: Global Market Y to o to Y Growth Comparison by Voltage Level , 2025-2035
  • Figure 5: Global Market Attractiveness Analysis by Voltage Level
  • Figure 6: Global Market Value Share and BPS Analysis by Application, 2025 and 2035
  • Figure 7: Global Market Y to o to Y Growth Comparison by Application, 2025-2035
  • Figure 8: Global Market Attractiveness Analysis by Application
  • Figure 9: Global Market Value (USD Million) Share and BPS Analysis by Region, 2025 and 2035
  • Figure 10: Global Market Y to o to Y Growth Comparison by Region, 2025-2035
  • Figure 11: Global Market Attractiveness Analysis by Region
  • Figure 12: North America Market Incremental Dollar Opportunity, 2025-2035
  • Figure 13: Latin America Market Incremental Dollar Opportunity, 2025-2035
  • Figure 14: Western Europe Market Incremental Dollar Opportunity, 2025-2035
  • Figure 15: Eastern Europe Market Incremental Dollar Opportunity, 2025-2035
  • Figure 16: East Asia Market Incremental Dollar Opportunity, 2025-2035
  • Figure 17: South Asia and Pacific Market Incremental Dollar Opportunity, 2025-2035
  • Figure 18: Middle East & Africa Market Incremental Dollar Opportunity, 2025-2035
  • Figure 19: North America Market Value Share and BPS Analysis by Country, 2025 and 2035
  • Figure 20: North America Market Value Share and BPS Analysis by Voltage Level , 2025 and 2035
  • Figure 21: North America Market Y to o to Y Growth Comparison by Voltage Level , 2025-2035
  • Figure 22: North America Market Attractiveness Analysis by Voltage Level
  • Figure 23: North America Market Value Share and BPS Analysis by Application, 2025 and 2035
  • Figure 24: North America Market Y to o to Y Growth Comparison by Application, 2025-2035
  • Figure 25: North America Market Attractiveness Analysis by Application
  • Figure 26: Latin America Market Value Share and BPS Analysis by Country, 2025 and 2035
  • Figure 27: Latin America Market Value Share and BPS Analysis by Voltage Level , 2025 and 2035
  • Figure 28: Latin America Market Y to o to Y Growth Comparison by Voltage Level , 2025-2035
  • Figure 29: Latin America Market Attractiveness Analysis by Voltage Level
  • Figure 30: Latin America Market Value Share and BPS Analysis by Application, 2025 and 2035
  • Figure 31: Latin America Market Y to o to Y Growth Comparison by Application, 2025-2035
  • Figure 32: Latin America Market Attractiveness Analysis by Application
  • Figure 33: Western Europe Market Value Share and BPS Analysis by Country, 2025 and 2035
  • Figure 34: Western Europe Market Value Share and BPS Analysis by Voltage Level , 2025 and 2035
  • Figure 35: Western Europe Market Y to o to Y Growth Comparison by Voltage Level , 2025-2035
  • Figure 36: Western Europe Market Attractiveness Analysis by Voltage Level
  • Figure 37: Western Europe Market Value Share and BPS Analysis by Application, 2025 and 2035
  • Figure 38: Western Europe Market Y to o to Y Growth Comparison by Application, 2025-2035
  • Figure 39: Western Europe Market Attractiveness Analysis by Application
  • Figure 40: Eastern Europe Market Value Share and BPS Analysis by Country, 2025 and 2035
  • Figure 41: Eastern Europe Market Value Share and BPS Analysis by Voltage Level , 2025 and 2035
  • Figure 42: Eastern Europe Market Y to o to Y Growth Comparison by Voltage Level , 2025-2035
  • Figure 43: Eastern Europe Market Attractiveness Analysis by Voltage Level
  • Figure 44: Eastern Europe Market Value Share and BPS Analysis by Application, 2025 and 2035
  • Figure 45: Eastern Europe Market Y to o to Y Growth Comparison by Application, 2025-2035
  • Figure 46: Eastern Europe Market Attractiveness Analysis by Application
  • Figure 47: East Asia Market Value Share and BPS Analysis by Country, 2025 and 2035
  • Figure 48: East Asia Market Value Share and BPS Analysis by Voltage Level , 2025 and 2035
  • Figure 49: East Asia Market Y to o to Y Growth Comparison by Voltage Level , 2025-2035
  • Figure 50: East Asia Market Attractiveness Analysis by Voltage Level
  • Figure 51: East Asia Market Value Share and BPS Analysis by Application, 2025 and 2035
  • Figure 52: East Asia Market Y to o to Y Growth Comparison by Application, 2025-2035
  • Figure 53: East Asia Market Attractiveness Analysis by Application
  • Figure 54: South Asia and Pacific Market Value Share and BPS Analysis by Country, 2025 and 2035
  • Figure 55: South Asia and Pacific Market Value Share and BPS Analysis by Voltage Level , 2025 and 2035
  • Figure 56: South Asia and Pacific Market Y to o to Y Growth Comparison by Voltage Level , 2025-2035
  • Figure 57: South Asia and Pacific Market Attractiveness Analysis by Voltage Level
  • Figure 58: South Asia and Pacific Market Value Share and BPS Analysis by Application, 2025 and 2035
  • Figure 59: South Asia and Pacific Market Y to o to Y Growth Comparison by Application, 2025-2035
  • Figure 60: South Asia and Pacific Market Attractiveness Analysis by Application
  • Figure 61: Middle East & Africa Market Value Share and BPS Analysis by Country, 2025 and 2035
  • Figure 62: Middle East & Africa Market Value Share and BPS Analysis by Voltage Level , 2025 and 2035
  • Figure 63: Middle East & Africa Market Y to o to Y Growth Comparison by Voltage Level , 2025-2035
  • Figure 64: Middle East & Africa Market Attractiveness Analysis by Voltage Level
  • Figure 65: Middle East & Africa Market Value Share and BPS Analysis by Application, 2025 and 2035
  • Figure 66: Middle East & Africa Market Y to o to Y Growth Comparison by Application, 2025-2035
  • Figure 67: Middle East & Africa Market Attractiveness Analysis by Application
  • Figure 68: Global Market - Tier Structure Analysis
  • Figure 69: Global Market - Company Share Analysis
Dashboard
Dashboard
Dashboard
Dashboard
Dashboard
Dashboard

Full Research Suite comprises of:

Market outlook & trends analysis

Market outlook & trends analysis

Interviews & case studies

Interviews & case studies

Strategic recommendations

Strategic recommendations

Vendor profiles & capabilities analysis

Vendor profiles & capabilities analysis

5-year forecasts

5-year forecasts

8 regions and 60+ country-level data splits

8 regions and 60+ country-level data splits

Market segment data splits

Market segment data splits

12 months of continuous data updates

12 months of continuous data updates

DELIVERED AS:

PDF EXCEL ONLINE

Full Research Suite


$5000

$7500

$10000

Buy Report Now
Similar Industry Reports

Similar Industry Reports

Hybrid Vision Sensor Chips Market

Hybrid Vision Sensor Chips Market Size and Share Forecast Outlook 2025 to 2035

Hybrid Printing Market

Hybrid Printing Market Forecast Outlook 2025 to 2035

Hybrid Boat Market
Hybrid Boat Market

Hybrid Boat Market Size and Share Forecast Outlook 2025 to 2035

Hybrid Metal-Paper Seamers Market

Hybrid Metal-Paper Seamers Market Size and Share Forecast Outlook 2025 to 2035

Hybrid Sealing-Cut Machines Market

Hybrid Sealing-Cut Machines Market Analysis - Size and Share Forecast Outlook 2025 to 2035

Hybrid Additive Manufacturing Machines Market

Hybrid Additive Manufacturing Machines Market Size and Share Forecast Outlook 2025 to 2035

Hybrid Integration Platform Market

Hybrid Integration Platform Market Size and Share Forecast Outlook 2025 to 2035

Hybrid Marine Gensets Market

Hybrid Marine Gensets Market Size and Share Forecast Outlook 2025 to 2035

Hybrid Meat Products Market

Hybrid Meat Products Market Size and Share Forecast Outlook 2025 to 2035

Hybrid Generator Sets Market

Hybrid Generator Sets Market Size and Share Forecast Outlook 2025 to 2035

Hybrid Switchgear Market

Hybrid Switchgear Market Size and Share Forecast Outlook 2025 to 2035

Hybrid Rice Seeds Market

Hybrid Rice Seeds Market Size and Share Forecast Outlook 2025 to 2035

Hybrid Memory Cube Market

Hybrid Memory Cube Market Size and Share Forecast Outlook 2025 to 2035

Hybrid Aircraft Market

Hybrid Aircraft Market Size and Share Forecast Outlook 2025 to 2035

Hybrid Solar Wind Market

Hybrid Solar Wind Market Size and Share Forecast Outlook 2025 to 2035

Hybrid Cutters Market

Hybrid Cutters Market Analysis Size and Share Forecast Outlook 2025 to 2035

Hybrid Fabrics Market

Hybrid Fabrics Market Size and Share Forecast Outlook 2025 to 2035

Hybrid Train Market
Hybrid Train Market

Hybrid Train Market Analysis - Size, Share, and Forecast Outlook 2025 to 2035

Hybrid Solar Wind Energy Storage Market

Hybrid Solar Wind Energy Storage Market Size and Share Forecast Outlook 2025 to 2035

Hybrid Drivetrain Market

Hybrid Drivetrain Market Size and Share Forecast Outlook 2025 to 2035

Future Market Insights

Hybrid Reactive Power and Harmonic Compensation Device Market

Chat With MaRIA

Chat With

MaRIA

Hi There, I am MaRIA, Your Market Research Intelligence Assistant. How may I help you?