Hybrid Integration Platform Market Outlook (2023 to 2033)

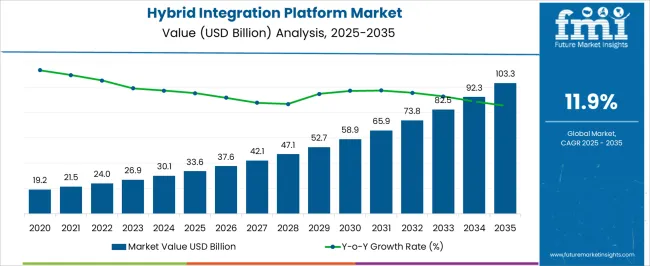
The global hybrid integration platform sector is likely to have a market value of US$ 26,576.4 million in 2023 and is expected to accumulate a market value of US$ 86,557.1 million by registering a CAGR of 12.5% in the forecast period. The growth of the hybrid integration platform sector is attributed to the increasing penetration of digitization and the need for securing data on cloud platforms.

The market for hybrid integration platforms registered a CAGR of 10.4% in the historical period 2018 to 2022. In the new mobile and cloud world, business decisions are driven by the convergence of social interaction, mobility, cloud, and information. Therefore, in order to increase business value, IT needs to connect cloud-based, mobile, and on-premises resources.

A hybrid integration platform is an evolutionary step in leveraging the cloud to its full potential. The hybrid integration platform is a combination of on-premise and cloud-based systems that are securely connected using transport layer security. A hybrid integration platform integrates data from on-premise systems with cloud data in order to provide a balance between enterprises.

The benefits of hybrid integration platforms such as reduced cost, rapid development, and deployment, and build-in scalability are playing an important role in supporting the rapid adoption of hybrid integration platforms and which ultimately helps in fuelling the growth of the hybrid integration platform business.

Don't pay for what you don't need

Customize your report by selecting specific countries or regions and save 30%!

Which are Some Prominent Drivers of the Hybrid Integration Platform Industry?

The growing need for integrating on-premise and cloud applications with existing systems in order to drive digital business transformation is the primary growth driver of a hybrid integration platform. Moreover, the advancement in cloud computing technology is playing an important role in driving the growth of the hybrid integration platform sector. Also, the digital era has greatly accelerated the change and evolution of new products, services, and business models.

A hybrid integration platform connects the network that is divided between enterprise and customers & suppliers, BYOD (enterprise mobile), and big data in order to allow the on-premises application to integrate with cloud-based applications ultimately due to this, the adoption of a hybrid integration platform is increasing. Also, the increasing demand for hosting apps, data, and services on the cloud is also one of the key factors due to which the demand for hybrid integration platforms is increasing.

Apart from this, the increase in the number of hybrid integration platform providers and the paradigm shift in the way of developing applications are some of the factors which are fuelling the growth of the hybrid integration platform industry.

Attributes Details
Hybrid Integration Platform Market CAGR (2023 to 2033) 12.5%
Hybrid Integration Platform Market Size (2023) US$ 26,576.4 million
Hybrid Integration Platform Market Size (2033) US$ 86,557.1 million

What are the Challenges Faced by the Hybrid Integration Platform Sector?

The lack of standardization and uniform integration type for hybrid integration platforms are some of the factors which hinder the growth of the hybrid integration platform business in near future. Also, high cost and security issues are the factors that are likely to restrain the growth of the market.

Sudip Saha
Sudip Saha

Principal Consultant

Talk to Analyst

Find your sweet spots for generating winning opportunities in this market.

Regional Insights

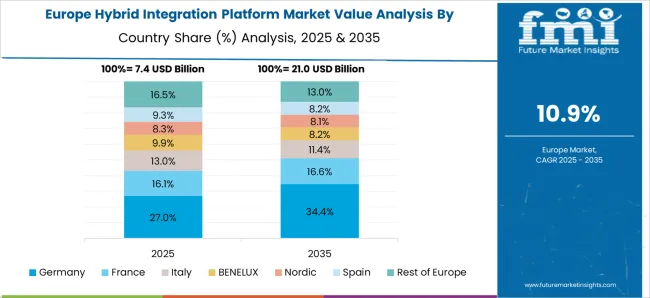
Country Market Share (2022)
United States 16.6%
Germany 8.1%
Japan 3.2%
Australia 2.1%

Increasing demand for Integrating Data on Cloud Systems Creating Lucrative Opportunities for Hybrid Integration Platform Industry in North America?

North America is anticipated to capture the leading market share regarding revenue, owing to the increasing need to integrate data and processes between the public cloud and on-premise applications and the presence of various key players in the region. In addition, nearly all end-user sectors are using cloud services for storing datasets and managing security threats.

Owing to the reasons mentioned above, North America held a market share of 29.1% for the hybrid integration platform in 2022.

Digitization Creating Lucrative Opportunities for Hybrid Integration Platform Sector in Asia Pacific?

Country CAGR
China 10.1%
India 14.3%

Asia Pacific is anticipated to be the second leading market in terms of revenue in the hybrid integration platform Industry over the next coming years due to high digitalization and the increasing spending of enterprises to improve infrastructure. Moreover, the increasing penetration of end-user sectors is easing the complex process of storing information in the Asia Pacific.

Due to the aforementioned above, Asia Pacific procured a 30% market share in 2022.

Advanced Cloud-Based Solutions Propelling Growth of the Market in Europe?

The hybrid integration platform sector in Europe is expected to witness high growth rates in the coming period due to the emergence of advanced and secured cloud-based solutions. Moreover, the strong presence of the healthcare and automotive industry is increasing the demand for hybrid integration platforms in the region. Europe possessed a 18.3% market share for the market in 2022.

Hybrid Integration Platform Start-ups

Key start-up players in the hybrid integration platform sector are Virtustream, Hewlett Packard Enterprise, Gigas, Stratoscale, and Quali
  • Virtustream, a key start-up player in the hybrid integration platform, is focusing on offering hybrid integration platforms to assist customers to migrate information and manage information on hybrid platforms.

Get the data you need at a Fraction of the cost

Personalize your report by choosing insights you need
and save 40%!

Market Competition

Many big corporations are contending for market dominance in the fiercely competitive market for hybrid integration platforms. In order to provide seamless integration between on-premises and cloud-based apps, systems, and data, these businesses provide a variety of solutions and services.

  • In March 2022, IBM Corporation announced that the company is working with Discover Financial Services to help the bank to transform its existing systems to cloud platforms.
  • By combining the edge, private, and public clouds in September 2022, Wipro and Cisco were able to offer a flexible, programmable, and adaptable hybrid cloud solution. AppDynamics, ThousandEyes, Cisco Workload Optimization Manager (CWOM), Intersight, and Secure Application technologies, as well as Cisco's Whole Stack Observability solution, power the full-stack IT-as-a-service platform.

Key Companies Profiled

  • Microsoft Corporation
  • IBM Corporation
  • Oracle Corporation
  • Software AG
  • Dell Boomi
  • MuleSoft
  • TIBCO Software
  • SnapLogic
  • Liaison Technologies
  • Informatica
  • Axway

Key Segments

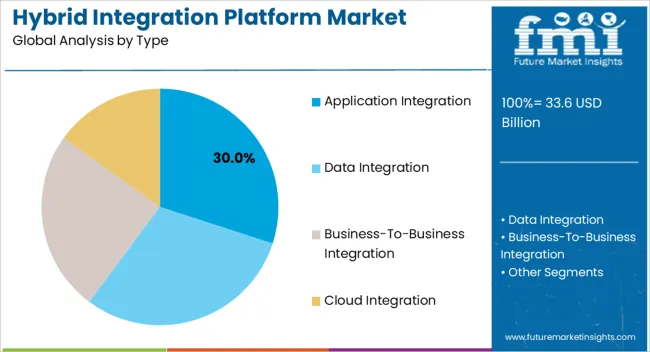
By Type :

  • Application Integration
  • Data integration
  • Business-to-business integration
  • Cloud integration

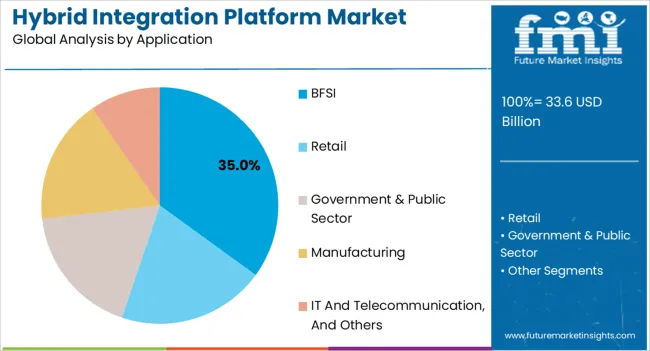
By Application :

  • BFSI
  • Retail
  • Government & public sector
  • Manufacturing
  • IT and Telecommunication, and others

By Region :

  • North America
  • Latin America
  • Western Europe
  • Eastern Europe
  • Asia Pacific Excluding Japan
  • Japan
  • Middle East & Africa

Frequently Asked Questions

How Big is the Hybrid Integration Platform Market?

The market is valued at US$ 26,576.4 million in 2023.

What is the Growth Potential of the Hybrid Integration Platform Market?

The growth potential of the market is 12.5% CAGR through 2033.

What Factors are Catalyzing Market Growth?

Surging need for digital business transformation and advances in cloud computing technology.

Which Factors Restrict Market Growth?

Lack of standardization and high cost of hybrid integration platform.

Who are the Leading Market Competitors?

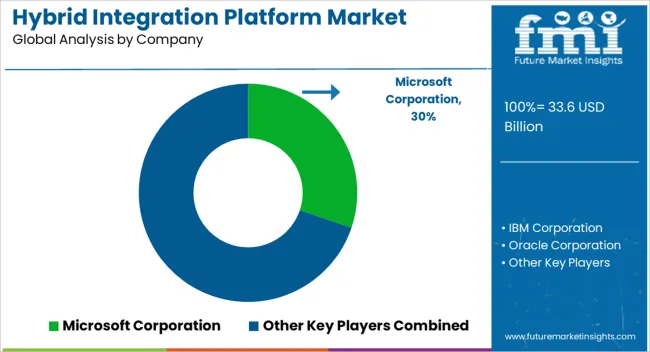
Microsoft Corporation, IBM Corporation, and Oracle Corporation are key players.

Table of Content
1. Executive Summary
    1.1. Global Market Outlook
    1.2. Demand-side Trends
    1.3. Supply-side Trends
    1.4. Technology Roadmap Analysis
    1.5. Analysis and Recommendations
2. Market Overview
    2.1. Market Coverage / Taxonomy
    2.2. Market Definition / Scope / Limitations
3. Market Background
    3.1. Market Dynamics
        3.1.1. Drivers
        3.1.2. Restraints
        3.1.3. Opportunity
        3.1.4. Trends
    3.2. Scenario Forecast
        3.2.1. Demand in Optimistic Scenario
        3.2.2. Demand in Likely Scenario
        3.2.3. Demand in Conservative Scenario
    3.3. Opportunity Map Analysis
    3.4. Investment Feasibility Matrix
    3.5. PESTLE and Porter’s Analysis
    3.6. Regulatory Landscape
        3.6.1. By Key Regions
        3.6.2. By Key Countries
    3.7. Regional Parent Market Outlook
4. Global Market Analysis 2018 to 2022 and Forecast, 2023 to 2033
    4.1. Historical Market Size Value (US$ Million) Analysis, 2018 to 2022
    4.2. Current and Future Market Size Value (US$ Million) Projections, 2023 to 2033
        4.2.1. Y-o-Y Growth Trend Analysis
        4.2.2. Absolute $ Opportunity Analysis
5. Global Market Analysis 2018 to 2022 and Forecast 2023 to 2033, By Type
    5.1. Introduction / Key Findings
    5.2. Historical Market Size Value (US$ Million) Analysis By Type, 2018 to 2022
    5.3. Current and Future Market Size Value (US$ Million) Analysis and Forecast By Type, 2023 to 2033
        5.3.1. Application Integration
        5.3.2. Data integration
        5.3.3. Business-to-business integration
        5.3.4. Data integration
    5.4. Y-o-Y Growth Trend Analysis By Type, 2018 to 2022
    5.5. Absolute $ Opportunity Analysis By Type, 2023 to 2033
6. Global Market Analysis 2018 to 2022 and Forecast 2023 to 2033, By Application
    6.1. Introduction / Key Findings
    6.2. Historical Market Size Value (US$ Million) Analysis By Application, 2018 to 2022
    6.3. Current and Future Market Size Value (US$ Million) Analysis and Forecast By Application, 2023 to 2033
        6.3.1. BFSI
        6.3.2. Retail
        6.3.3. Government & public sector
        6.3.4. Manufacturing
        6.3.5. IT and Telecommunication, and others
    6.4. Y-o-Y Growth Trend Analysis By Application, 2018 to 2022
    6.5. Absolute $ Opportunity Analysis By Application, 2023 to 2033
7. Global Market Analysis 2018 to 2022 and Forecast 2023 to 2033, By Region
    7.1. Introduction
    7.2. Historical Market Size Value (US$ Million) Analysis By Region, 2018 to 2022
    7.3. Current Market Size Value (US$ Million) Analysis and Forecast By Region, 2023 to 2033
        7.3.1. North America
        7.3.2. Latin America
        7.3.3. Western Europe
        7.3.4. Eastern Europe
        7.3.5. South Asia and Pacific
        7.3.6. East Asia
        7.3.7. Middle East and Africa
    7.4. Market Attractiveness Analysis By Region
8. North America Market Analysis 2018 to 2022 and Forecast 2023 to 2033, By Country
    8.1. Historical Market Size Value (US$ Million) Trend Analysis By Market Taxonomy, 2018 to 2022
    8.2. Market Size Value (US$ Million) Forecast By Market Taxonomy, 2023 to 2033
        8.2.1. By Country
            8.2.1.1. USA
            8.2.1.2. Canada
        8.2.2. By Type
        8.2.3. By Application
    8.3. Market Attractiveness Analysis
        8.3.1. By Country
        8.3.2. By Type
        8.3.3. By Application
    8.4. Key Takeaways
9. Latin America Market Analysis 2018 to 2022 and Forecast 2023 to 2033, By Country
    9.1. Historical Market Size Value (US$ Million) Trend Analysis By Market Taxonomy, 2018 to 2022
    9.2. Market Size Value (US$ Million) Forecast By Market Taxonomy, 2023 to 2033
        9.2.1. By Country
            9.2.1.1. Brazil
            9.2.1.2. Mexico
            9.2.1.3. Rest of Latin America
        9.2.2. By Type
        9.2.3. By Application
    9.3. Market Attractiveness Analysis
        9.3.1. By Country
        9.3.2. By Type
        9.3.3. By Application
    9.4. Key Takeaways
10. Western Europe Market Analysis 2018 to 2022 and Forecast 2023 to 2033, By Country
    10.1. Historical Market Size Value (US$ Million) Trend Analysis By Market Taxonomy, 2018 to 2022
    10.2. Market Size Value (US$ Million) Forecast By Market Taxonomy, 2023 to 2033
        10.2.1. By Country
            10.2.1.1. Germany
            10.2.1.2. UK
            10.2.1.3. France
            10.2.1.4. Spain
            10.2.1.5. Italy
            10.2.1.6. Rest of Western Europe
        10.2.2. By Type
        10.2.3. By Application
    10.3. Market Attractiveness Analysis
        10.3.1. By Country
        10.3.2. By Type
        10.3.3. By Application
    10.4. Key Takeaways
11. Eastern Europe Market Analysis 2018 to 2022 and Forecast 2023 to 2033, By Country
    11.1. Historical Market Size Value (US$ Million) Trend Analysis By Market Taxonomy, 2018 to 2022
    11.2. Market Size Value (US$ Million) Forecast By Market Taxonomy, 2023 to 2033
        11.2.1. By Country
            11.2.1.1. Poland
            11.2.1.2. RUSAa
            11.2.1.3. Czech Republic
            11.2.1.4. Romania
            11.2.1.5. Rest of Eastern Europe
        11.2.2. By Type
        11.2.3. By Application
    11.3. Market Attractiveness Analysis
        11.3.1. By Country
        11.3.2. By Type
        11.3.3. By Application
    11.4. Key Takeaways
12. South Asia and Pacific Market Analysis 2018 to 2022 and Forecast 2023 to 2033, By Country
    12.1. Historical Market Size Value (US$ Million) Trend Analysis By Market Taxonomy, 2018 to 2022
    12.2. Market Size Value (US$ Million) Forecast By Market Taxonomy, 2023 to 2033
        12.2.1. By Country
            12.2.1.1. India
            12.2.1.2. Bangladesh
            12.2.1.3. Australia
            12.2.1.4. New Zealand
            12.2.1.5. Rest of South Asia and Pacific
        12.2.2. By Type
        12.2.3. By Application
    12.3. Market Attractiveness Analysis
        12.3.1. By Country
        12.3.2. By Type
        12.3.3. By Application
    12.4. Key Takeaways
13. East Asia Market Analysis 2018 to 2022 and Forecast 2023 to 2033, By Country
    13.1. Historical Market Size Value (US$ Million) Trend Analysis By Market Taxonomy, 2018 to 2022
    13.2. Market Size Value (US$ Million) Forecast By Market Taxonomy, 2023 to 2033
        13.2.1. By Country
            13.2.1.1. China
            13.2.1.2. Japan
            13.2.1.3. South Korea
        13.2.2. By Type
        13.2.3. By Application
    13.3. Market Attractiveness Analysis
        13.3.1. By Country
        13.3.2. By Type
        13.3.3. By Application
    13.4. Key Takeaways
14. Middle East and Africa Market Analysis 2018 to 2022 and Forecast 2023 to 2033, By Country
    14.1. Historical Market Size Value (US$ Million) Trend Analysis By Market Taxonomy, 2018 to 2022
    14.2. Market Size Value (US$ Million) Forecast By Market Taxonomy, 2023 to 2033
        14.2.1. By Country
            14.2.1.1. GCC Countries
            14.2.1.2. South Africa
            14.2.1.3. Israel
            14.2.1.4. Rest of MEA
        14.2.2. By Type
        14.2.3. By Application
    14.3. Market Attractiveness Analysis
        14.3.1. By Country
        14.3.2. By Type
        14.3.3. By Application
    14.4. Key Takeaways
15. Key Countries Market Analysis
    15.1. USA
        15.1.1. Pricing Analysis
        15.1.2. Market Share Analysis, 2022
            15.1.2.1. By Type
            15.1.2.2. By Application
    15.2. Canada
        15.2.1. Pricing Analysis
        15.2.2. Market Share Analysis, 2022
            15.2.2.1. By Type
            15.2.2.2. By Application
    15.3. Brazil
        15.3.1. Pricing Analysis
        15.3.2. Market Share Analysis, 2022
            15.3.2.1. By Type
            15.3.2.2. By Application
    15.4. Mexico
        15.4.1. Pricing Analysis
        15.4.2. Market Share Analysis, 2022
            15.4.2.1. By Type
            15.4.2.2. By Application
    15.5. Germany
        15.5.1. Pricing Analysis
        15.5.2. Market Share Analysis, 2022
            15.5.2.1. By Type
            15.5.2.2. By Application
    15.6. UK
        15.6.1. Pricing Analysis
        15.6.2. Market Share Analysis, 2022
            15.6.2.1. By Type
            15.6.2.2. By Application
    15.7. France
        15.7.1. Pricing Analysis
        15.7.2. Market Share Analysis, 2022
            15.7.2.1. By Type
            15.7.2.2. By Application
    15.8. Spain
        15.8.1. Pricing Analysis
        15.8.2. Market Share Analysis, 2022
            15.8.2.1. By Type
            15.8.2.2. By Application
    15.9. Italy
        15.9.1. Pricing Analysis
        15.9.2. Market Share Analysis, 2022
            15.9.2.1. By Type
            15.9.2.2. By Application
    15.10. Poland
        15.10.1. Pricing Analysis
        15.10.2. Market Share Analysis, 2022
            15.10.2.1. By Type
            15.10.2.2. By Application
    15.11. RUSAa
        15.11.1. Pricing Analysis
        15.11.2. Market Share Analysis, 2022
            15.11.2.1. By Type
            15.11.2.2. By Application
    15.12. Czech Republic
        15.12.1. Pricing Analysis
        15.12.2. Market Share Analysis, 2022
            15.12.2.1. By Type
            15.12.2.2. By Application
    15.13. Romania
        15.13.1. Pricing Analysis
        15.13.2. Market Share Analysis, 2022
            15.13.2.1. By Type
            15.13.2.2. By Application
    15.14. India
        15.14.1. Pricing Analysis
        15.14.2. Market Share Analysis, 2022
            15.14.2.1. By Type
            15.14.2.2. By Application
    15.15. Bangladesh
        15.15.1. Pricing Analysis
        15.15.2. Market Share Analysis, 2022
            15.15.2.1. By Type
            15.15.2.2. By Application
    15.16. Australia
        15.16.1. Pricing Analysis
        15.16.2. Market Share Analysis, 2022
            15.16.2.1. By Type
            15.16.2.2. By Application
    15.17. New Zealand
        15.17.1. Pricing Analysis
        15.17.2. Market Share Analysis, 2022
            15.17.2.1. By Type
            15.17.2.2. By Application
    15.18. China
        15.18.1. Pricing Analysis
        15.18.2. Market Share Analysis, 2022
            15.18.2.1. By Type
            15.18.2.2. By Application
    15.19. Japan
        15.19.1. Pricing Analysis
        15.19.2. Market Share Analysis, 2022
            15.19.2.1. By Type
            15.19.2.2. By Application
    15.20. South Korea
        15.20.1. Pricing Analysis
        15.20.2. Market Share Analysis, 2022
            15.20.2.1. By Type
            15.20.2.2. By Application
    15.21. GCC Countries
        15.21.1. Pricing Analysis
        15.21.2. Market Share Analysis, 2022
            15.21.2.1. By Type
            15.21.2.2. By Application
    15.22. South Africa
        15.22.1. Pricing Analysis
        15.22.2. Market Share Analysis, 2022
            15.22.2.1. By Type
            15.22.2.2. By Application
    15.23. Israel
        15.23.1. Pricing Analysis
        15.23.2. Market Share Analysis, 2022
            15.23.2.1. By Type
            15.23.2.2. By Application
16. Market Structure Analysis
    16.1. Competition Dashboard
    16.2. Competition Benchmarking
    16.3. Market Share Analysis of Top Players
        16.3.1. By Regional
        16.3.2. By Type
        16.3.3. By Application
17. Competition Analysis
    17.1. Competition Deep Dive
        17.1.1. Microsoft Corporation
            17.1.1.1. Overview
            17.1.1.2. Product Portfolio
            17.1.1.3. Profitability by Market Segments
            17.1.1.4. Sales Footprint
            17.1.1.5. Strategy Overview
                17.1.1.5.1. Marketing Strategy
        17.1.2. IBM Corporation
            17.1.2.1. Overview
            17.1.2.2. Product Portfolio
            17.1.2.3. Profitability by Market Segments
            17.1.2.4. Sales Footprint
            17.1.2.5. Strategy Overview
                17.1.2.5.1. Marketing Strategy
        17.1.3. Oracle Corporation
            17.1.3.1. Overview
            17.1.3.2. Product Portfolio
            17.1.3.3. Profitability by Market Segments
            17.1.3.4. Sales Footprint
            17.1.3.5. Strategy Overview
                17.1.3.5.1. Marketing Strategy
        17.1.4. Software AG
            17.1.4.1. Overview
            17.1.4.2. Product Portfolio
            17.1.4.3. Profitability by Market Segments
            17.1.4.4. Sales Footprint
            17.1.4.5. Strategy Overview
                17.1.4.5.1. Marketing Strategy
        17.1.5. Dell Boomi
            17.1.5.1. Overview
            17.1.5.2. Product Portfolio
            17.1.5.3. Profitability by Market Segments
            17.1.5.4. Sales Footprint
            17.1.5.5. Strategy Overview
                17.1.5.5.1. Marketing Strategy
        17.1.6. MuleSoft
            17.1.6.1. Overview
            17.1.6.2. Product Portfolio
            17.1.6.3. Profitability by Market Segments
            17.1.6.4. Sales Footprint
            17.1.6.5. Strategy Overview
                17.1.6.5.1. Marketing Strategy
        17.1.7. TIBCO Software
            17.1.7.1. Overview
            17.1.7.2. Product Portfolio
            17.1.7.3. Profitability by Market Segments
            17.1.7.4. Sales Footprint
            17.1.7.5. Strategy Overview
                17.1.7.5.1. Marketing Strategy
        17.1.8. SnapLogic
            17.1.8.1. Overview
            17.1.8.2. Product Portfolio
            17.1.8.3. Profitability by Market Segments
            17.1.8.4. Sales Footprint
            17.1.8.5. Strategy Overview
                17.1.8.5.1. Marketing Strategy
        17.1.9. Liaison Technologies
            17.1.9.1. Overview
            17.1.9.2. Product Portfolio
            17.1.9.3. Profitability by Market Segments
            17.1.9.4. Sales Footprint
            17.1.9.5. Strategy Overview
                17.1.9.5.1. Marketing Strategy
        17.1.10. Informatica
            17.1.10.1. Overview
            17.1.10.2. Product Portfolio
            17.1.10.3. Profitability by Market Segments
            17.1.10.4. Sales Footprint
            17.1.10.5. Strategy Overview
                17.1.10.5.1. Marketing Strategy
        17.1.11. Axway
            17.1.11.1. Overview
            17.1.11.2. Product Portfolio
            17.1.11.3. Profitability by Market Segments
            17.1.11.4. Sales Footprint
            17.1.11.5. Strategy Overview
                17.1.11.5.1. Marketing Strategy
18. Assumptions & Acronyms Used
19. Research Methodology
Recommendations

Technology

Hybrid Fiber Coaxial Market

April 2023

REP-GB-17100

333 pages

Technology

Hybrid Cloud Storage Market

October 2022

REP-GB-5888

306 pages

Explore Technology Insights

View Reports
Future Market Insights

Hybrid Integration Platform Market

Schedule a Call