Hybrid Meat Products Market Size and Share Forecast Outlook 2025 to 2035

The global Hybrid Meat Products Market has been projected to be valued at USD 530.6 million in 2025 and is anticipated to reach approximately USD 1,314.9 million by 2035. A cumulative gain of USD 264.9 million is expected over the forecast decade, signaling a 9.5% CAGR.
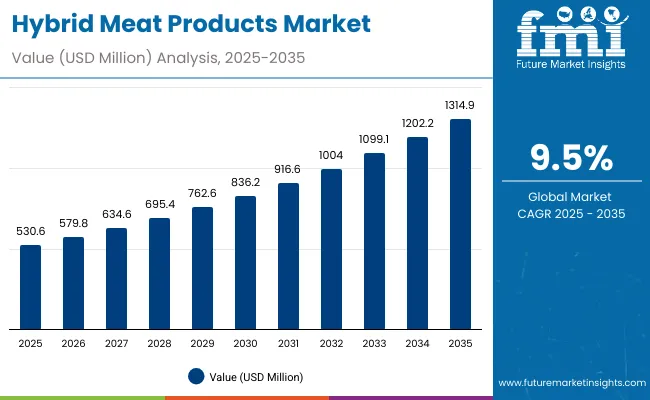
Hybrid Meat Products Market 1

Quick Stats for Hybrid Meat Products Market

  • Hybrid Meat Products Market Value (2025): USD 530.6 million
  • Hybrid Meat Products Market Forecast Value (2035): USD 1,314.9 million
  • Hybrid Meat Products Forecast CAGR: 9.5%
  • Leading Segment in Hybrid Meat Products in 2025, by Product Type: Burgers & Patties (26.7%)
  • Key Growth Regions in the Hybrid Meat Products: North America, Asia-Pacific, Europe
  • Top Key Players in Hybrid Meat Products: Tyson Foods, JBS S.A., Nestlé S.A., Perdue Farms, Maple Leaf Foods Inc., Hormel Foods Corporation, Conagra Brands, Eat Just (GOOD Meat), Bio Tech Foods, Mush Foods.

Hybrid Meat Products Market Key Takeaways
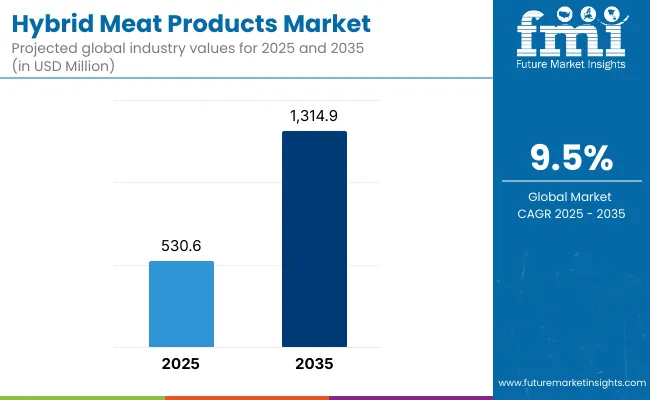
Hybrid Meat Products Market

Metric Value
Hybrid Meat Products Estimated Value in (2025E) USD 530.6 million
Hybrid Meat Products Forecast Value in (2035F) USD 1,314.9 million
Forecast CAGR (2025 to 2035) 9.5%

Adoption has been further encouraged as retailers, foodservice operators, and manufacturers prioritize offerings that balance familiarity with innovation, thereby reducing consumer hesitation often observed in fully plant-based categories. Strategic investments have been observed in supply chain optimization, product formulation, and marketing narratives emphasizing both taste and sustainability. This direction is expected to strengthen brand trust and expand penetration into mainstream consumption patterns.

During the first half of the assessment period from 2025 to 2030, the market is forecast to grow steadily from USD 530.6 million to levels exceeding USD 836 million. This early stage of growth is expected to be supported by consumer curiosity, gradual mainstreaming of hybrid formats, and the entry of established meat and plant-protein companies into this space. The adoption during this phase is anticipated to be driven by premium positioning, marketing emphasis on sustainability, and the ability of hybrid solutions to offer both taste familiarity and nutritional balance.

In the second half of the period, from 2030 to 2035, accelerated expansion is projected, with the market surging from approximately USD 836 million to USD 1,314.9 million. This later-stage growth is expected to account for the larger share of decade-long gains, reflecting enhanced scalability, improved affordability, and stronger penetration into emerging economies. Regulatory clarity, advances in protein technologies, and greater consumer trust are anticipated to reinforce hybrid meat products as a mainstream category, firmly positioning them within the global protein landscape.

From 2020 to 2024, the Hybrid Meat Products Market expanded from a niche innovation space into a structured growth category, supported by early product launches and consumer curiosity toward blended protein options. During this period, traditional meat companies dominated visibility by integrating hybrid lines into established retail and foodservice networks, while plant-based innovators focused on premium offerings.

By 2025, demand is expected to accelerate, reaching USD 530.6 million, with burgers and patties driving adoption through their consumer familiarity and mainstream positioning. Over the next decade, growth will be reinforced by diversification into ready-to-eat meals, deli slices, and snackable hybrids, enabling penetration across multiple consumption occasions. Regional expansion will be shaped by North America and Europe’s early leadership, while Asia-Pacific is projected to deliver the fastest relative growth.

Competitive advantage is expected to shift from first-mover novelty toward scalability, affordability, and trust-building. Partnerships between meat processors and food-tech innovators are projected to define the next phase of hybrid market leadership.

Why the Hybrid Meat Products Market is growing?

Growth in the Hybrid Meat Products Market is being driven by a convergence of sustainability, health, and consumer preference dynamics. Increasing awareness of climate impact from livestock production has been translated into demand for products that reduce environmental footprints while retaining the taste and texture of conventional meat. This alignment with sustainability goals has been reinforced by policy initiatives, corporate commitments to carbon reduction, and investments in sustainable food technologies.

Consumer interest in healthier dietary choices has also been observed as a strong catalyst. Hybrid meat products have been positioned as solutions that deliver familiar sensory experiences while incorporating plant-based proteins and functional ingredients that enhance nutritional profiles. This positioning has been amplified through marketing strategies focused on clean labels, high protein claims, and balanced fat compositions.

The involvement of established meat companies alongside plant-based pioneers has accelerated category legitimacy. Strategic collaborations, co-branding initiatives, and product innovations have expanded retail presence and normalized consumer trial. Parallel advances in protein processing, flavor enhancement, and binding technologies have improved texture, affordability, and scalability, creating a more competitive offering. As adoption broadens across mainstream retail, foodservice, and online channels, the hybrid meat products market is expected to solidify its position as a critical bridge in the transition toward sustainable protein consumption.

Segmental Analysis

The Hybrid Meat Products Market has been segmented by product type, distribution channel, source, ingredient functionality, nutritional positioning, and region. Each segment reflects a distinct dimension of consumer demand, production innovation, and retail strategy shaping the trajectory of this emerging category. Product type segmentation highlights the formats through which hybrid proteins are most readily introduced to consumers, aligning with familiarity and convenience. Distribution channel segmentation emphasizes the critical role of retail touchpoints, ranging from mainstream supermarkets to online platforms, in expanding accessibility and awareness. Source segmentation underscores the evolving composition of hybrid formulations, with animal and plant-derived proteins combined to balance sensory expectations with sustainability imperatives. Together, these dimensions illustrate the multi-layered growth potential of hybrid meat products.
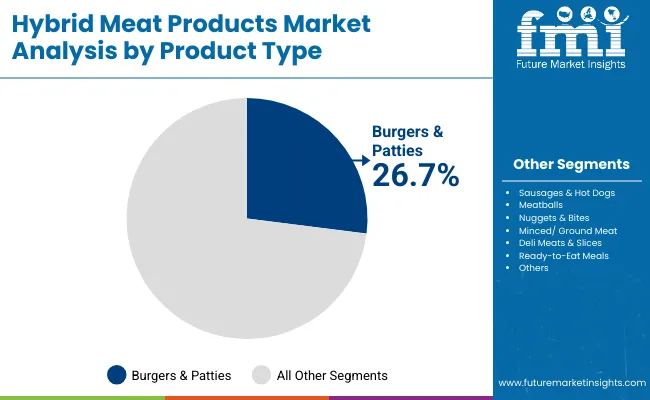
Insights into the Product Type Segment with Burgers & Patties Leading in Market Share

Hybrid Meat Products Market By Product Type

Product Type Segment Market Value Share, 2025
Burgers & Patties 26.70%
Minced/ Ground Meat 16.80%

Burgers & Patties are projected to lead the product type segment with a 26.7% share in 2025, supported by their widespread consumer acceptance and ease of integration into fast food and retail formats. Growth has been sustained by their positioning as familiar entry points for hybrid proteins, allowing consumers to trial without altering established eating habits. Although the CAGR is moderate at 6.5%, their scale and visibility are expected to drive significant absolute gains over the decade. Minced and ground meat formats are forecasted to grow faster at 7.8%, reflecting demand for versatile cooking applications. Over time, product diversity and innovation in ready-to-eat hybrids are anticipated to strengthen the overall segment outlook.
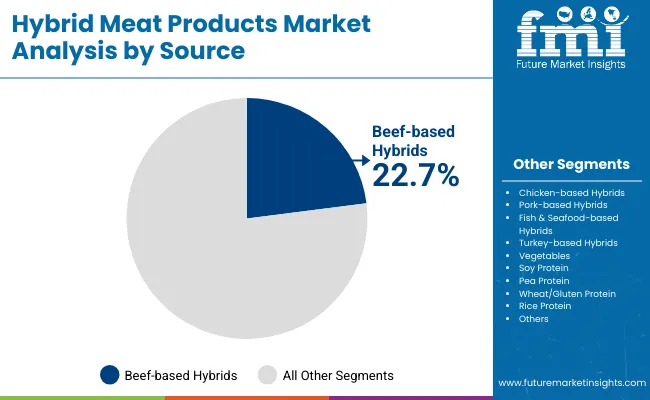
Insights into the Source Segment with Beef-based Hybrids Dominating the Demand

Hybrid Meat Products Market By Source

Source 2025 Share%
Beef-based Hybrids 22.70%
Chicken-based Hybrids 18.40%
Soy Protein 9.80%

Beef-based hybrids are forecasted to hold the leading position with 22.7% share in 2025, reflecting consumer preference for beef flavor profiles in burgers and ground formats. However, their CAGR of 4.5% suggests slower growth due to environmental concerns and rising popularity of alternative sources. Chicken-based hybrids follow with 18.4% share and modest growth at 5.0%, favored for versatility in processed and ready-to-cook formats. Plant-based sources such as soy protein, accounting for 9.8% share, are anticipated to grow faster at 6.2%, supported by sustainability credentials and adaptability in diverse formulations. The gradual diversification into pea, rice, and mycoprotein is expected to further shift share toward plant-forward hybrids, strengthening long-term growth prospects.
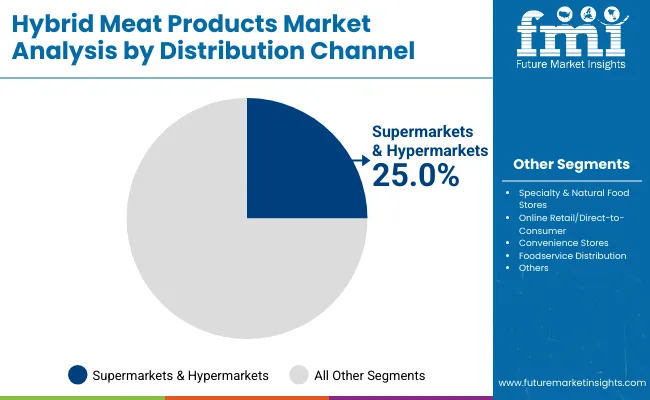
Insights into the Distribution Channel Segment with Focus on Supermarkets & Hypermarkets

Hybrid Meat Products Market Distribution Channel

Distribution Channel 2025 Share%
Supermarkets & Hypermarkets 25.0%
Convenience Stores 22.0%
Specialty & Natural Food Stores 20.0%

Supermarkets & Hypermarkets are expected to command the largest share of distribution at 25% in 2025, reflecting their central role in consumer access and visibility of hybrid products. Shelf placement within mainstream grocery outlets has been leveraged as a key trust-building factor, enabling hybrid products to be positioned alongside conventional meat. Growth at 7.0% CAGR reflects steady penetration rather than rapid acceleration. Online retail, with a CAGR of 8.3%, is anticipated to be the fastest-growing channel as direct-to-consumer models expand through subscription services and digital-native brands. Convenience stores are also forecasted to contribute meaningfully, supported by ready-to-eat hybrid offerings suited to on-the-go consumption. Together, these channels are expected to strengthen hybrid product accessibility across consumer groups.

What are the Drivers, Restraints, and Key Trends of the Hybrid Meat Products Market?

Adoption of hybrid meat products has been shaped by a balance of growth drivers, structural restraints, and emerging trends. While consumer health awareness and sustainability imperatives are strengthening demand, challenges related to cost competitiveness and consumer perception are moderating the pace of expansion. At the same time, evolving retail strategies and protein innovation are redefining the market’s long-term trajectory.

Sustainability and Environmental Impact

Market growth has been strongly influenced by rising concerns over the environmental footprint of livestock production. Hybrid meat products have been positioned as pragmatic solutions that combine familiar taste profiles with reduced reliance on animal proteins, thereby lowering greenhouse gas emissions and resource intensity. Growing alignment with corporate sustainability commitments and governmental climate policies has further reinforced adoption. Food companies have increasingly highlighted reduced carbon and water footprints in their branding, strengthening trust and driving consumer trial. Over the forecast period, environmental positioning is expected to act as a primary driver, solidifying hybrid meat products as a bridge to sustainable consumption.

Price Competitiveness and Cost Barriers

Despite strong momentum, hybrid meat products have faced challenges in achieving parity with conventional meat pricing. Higher production costs have been observed due to reliance on advanced processing technologies, premium plant-protein inputs, and specialized formulations to ensure texture and flavor alignment. These costs have limited affordability, particularly in price-sensitive markets where meat remains a staple protein. Retailers and foodservice operators have been cautious in scaling shelf presence when pricing premiums exceed consumer willingness to pay. Unless cost efficiencies are realized through economies of scale and technological optimization, affordability constraints are expected to act as a restraint on widespread adoption.
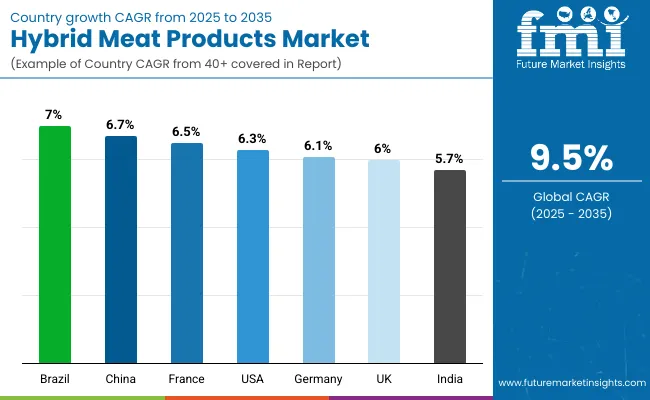
Analysis of Hybrid Meat Products Market by Key Countries

Country Wise Hybrid Meat Products Market

Countries CAGR (2025 to 2035)
China 6.7%
India 7.0%
Germany 6.1%
France 6.5%
UK 6.0%
USA 6.3%
Brazil 5.7%

The global Hybrid Meat Products Market is expected to show distinct country-level dynamics, with adoption influenced by consumer health trends, sustainability imperatives, and retail penetration strategies. China, projected at a 6.7% CAGR, is anticipated to lead Asia-Pacific growth, supported by strong government backing for sustainable food systems, rapid urbanization, and consumer receptiveness to protein diversification. India, with a 7.0% CAGR, is expected to expand steadily, as affordability concerns are balanced against increasing awareness of plant-forward diets and growing acceptance in metropolitan foodservice channels.

In Europe, Germany at 6.1% CAGR, France at 6.5%, and the UK at 6.0% are projected to maintain robust momentum, shaped by stringent sustainability regulations, strong retail infrastructure, and the high visibility of hybrid offerings in mainstream supermarkets. These markets are expected to benefit from cultural openness to food innovation and a rising focus on reducing meat consumption without compromising taste.

The USA, growing at 6.3% CAGR, is anticipated to remain a cornerstone of market expansion in North America, driven by strong retail and e-commerce penetration, alongside active participation of major food companies. Brazil, at 5.7% CAGR, is forecasted to outpace other Latin American markets, benefiting from a shift toward premium protein innovation and export-oriented opportunities.
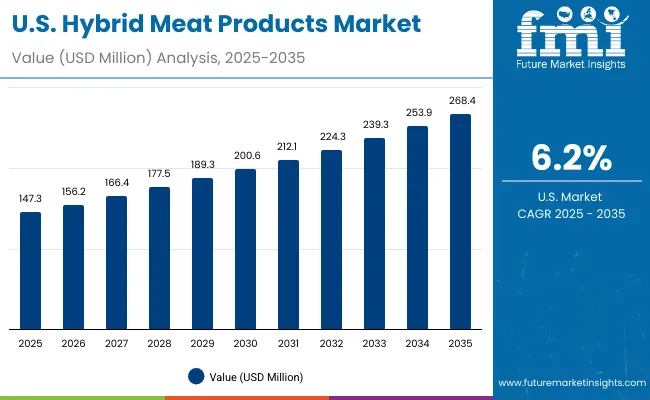
Sales Outlook for Hybrid Meat Products in the United States

Usa Hybrid Meat Products Market

Year USA Hybrid Meat Products Market (USD Million)
2025 147.3
2026 156.2
2027 166.4
2028 177.5
2029 189.3
2030 200.6
2031 212.1
2032 224.3
2033 239.3
2034 253.9
2035 268.4

The Hybrid Meat Products Market in the United States is projected to grow from USD 147.3 million in 2025 to USD 268.4 million in 2035, reflecting a strong CAGR of 6.3%. Expansion has been reinforced by increasing consumer interest in sustainable protein solutions that balance familiarity with nutritional innovation. Retail shelf presence in supermarkets and hypermarkets has been prioritized to normalize hybrid formats and stimulate mainstream adoption.

Demand growth has also been supported by rising interest from younger demographics seeking high-protein and clean-label food options. Strategic partnerships between established meat processors and plant-based companies have been observed, accelerating category legitimacy and improving product accessibility. Online retail channels are forecasted to expand at a faster pace, aligning with direct-to-consumer subscription trends.

  • Hybrid burgers and ground meat formats are expected to remain central to adoption, serving as entry points for trial.
  • Retail and e-commerce integration is anticipated to accelerate consumer exposure, enhancing sales momentum across the forecast horizon

Growth and Expansion Outlook for Hybrid Meat Products Market in the United Kingdom

The Hybrid Meat Products Market in the United Kingdom is projected to expand steadily at a 6.0% CAGR during 2025-2035, supported by strong consumer engagement with sustainable and healthier food choices. Growth has been reinforced by the country’s high retail penetration, where hybrid products are increasingly positioned alongside plant-based and conventional meat offerings in supermarkets. Regulatory alignment with sustainability targets is expected to further drive awareness and adoption.

  • Supermarkets and specialty stores are anticipated to remain the largest distribution platforms, with online channels strengthening reach.
  • Burgers and patties are expected to dominate early adoption, while ready-to-eat formats are projected to gain traction in urban markets.
  • Marketing narratives linking hybrids to environmental benefits are anticipated to resonate with younger and environmentally conscious demographics.
  • Premium positioning and collaborations with foodservice operators are projected to expand consumer trial and repeat purchases.

Growth and Expansion Outlook for Hybrid Meat Products in India

The Hybrid Meat Products Market in India is forecasted to grow at a 7.0% CAGR between 2025 and 2035, reflecting the dual impact of rising health awareness and persistent price sensitivity. Expansion is expected to be anchored in metropolitan areas, where exposure to plant-forward diets and innovative foodservice offerings is higher. Affordability remains a critical factor shaping adoption rates, particularly outside Tier-1 cities.

  • Ready-to-eat meals and snackable hybrids are expected to gain traction due to urban lifestyle shifts.
  • Retail expansion into specialty stores and e-commerce channels is projected to enhance accessibility.
  • Cost competitiveness relative to conventional meat is anticipated to act as both a challenge and a catalyst for innovation.
  • Nutritional positioning with fortified protein and clean-label claims is expected to attract younger and health-oriented consumers.

Sales Outlook for Hybrid Meat Products in China

The Hybrid Meat Products Market in China is projected to grow at a 6.7% CAGR through 2025-2035, making it the fastest-growing market in Asia-Pacific. Expansion is expected to be driven by strong government support for sustainable food systems, rapid urbanization, and consumer openness to protein diversification. Scaling opportunities are being reinforced by investments in retail integration and foodservice partnerships.
  • Beef and chicken hybrids are anticipated to dominate early adoption due to cultural preferences.
  • Online retail and direct-to-consumer channels are projected to expand rapidly, driven by China’s strong e-commerce ecosystem.
  • Government-backed sustainability campaigns are expected to accelerate consumer acceptance of alternative proteins.
  • Foodservice collaborations with quick-service restaurants (QSRs) are forecasted to strengthen trial and mainstream visibility.

In-depth Analysis of Hybrid Meat Products in Germany

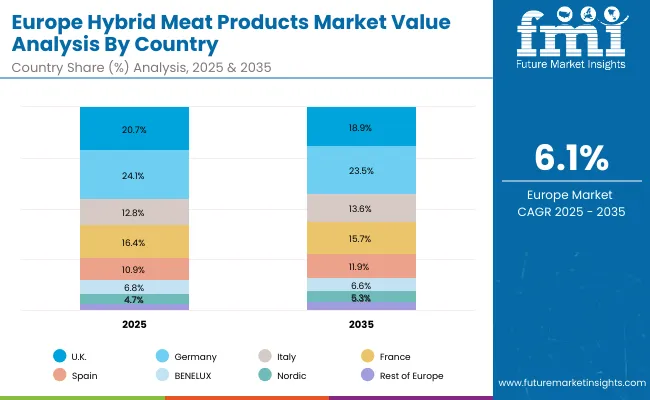
Europe Hybrid Meat Products Market

Countries 2025
UK 20.7%
Germany 24.1%
Italy 12.8%
France 16.4%
Spain 10.9%
BENELUX 6.8%
Nordic 4.7%
Rest of Europe 3.6%
Countries 2035
UK 18.9%
Germany 23.5%
Italy 13.6%
France 15.7%
Spain 11.9%
BENELUX 6.6%
Nordic 5.3%
Rest of Europe 4.5%

The Hybrid Meat Products Market in Germany is forecasted to record a 6.1% CAGR during 2025-2035, supported by high consumer openness to plant-forward diets and robust regulatory frameworks on sustainability. Supermarkets and hypermarkets are expected to drive early penetration, while online retail continues to gain momentum among younger consumers. Strong demand for fortified and clean-label hybrids is anticipated to define product differentiation.
  • Burgers, minced formats, and deli slices are projected to remain central to German adoption patterns.
  • Sustainability-focused marketing and eco-labeling are expected to enhance trust and drive repeat purchases.
  • Foodservice integration, especially in premium dining and QSR formats, is anticipated to accelerate exposure.
  • Germany’s role as a European innovation hub is projected to foster rapid new product development and consumer trial.

Growth Outlook for Hybrid Meat Products in Japan

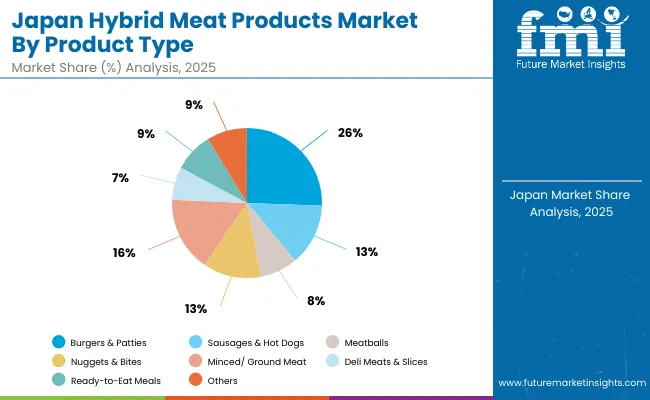
Japan Hybrid Meat Products Market

Product Type Market Value Share, 2025
Burgers & Patties 26.7%
Sausages & Hot Dogs 14.3%
Meatballs 8.6%
Nuggets & Bites 13.9%
Minced/ Ground Meat 16.8%
Deli Meats & Slices 7.4%
Ready-to-Eat Meals (curries, pasta, pizzas, etc.) 8.7%
Others (jerky, strips, schnitzels, etc.) 3.6%

The Hybrid Meat Products Market in Japan is projected at USD 34.5 million in 2025, with burgers and patties contributing the largest share at 25.6%. Growth has been underpinned by strong demand for familiar formats, yet faster acceleration is being observed in ready-to-eat hybrids and “others” such as jerky and schnitzels, reflecting urban convenience preferences. Premiumization trends and health claims are shaping positioning, with hybrid products marketed as balanced choices that blend taste familiarity with nutritional and sustainability advantages. Over the decade, adoption is expected to broaden through foodservice collaborations and increased visibility in convenience retail formats, aligning with Japan’s evolving dietary patterns.
  • Market in Japan is expected to hold a significant share of the Asia-Pacific landscape by 2025.
  • Burgers & patties dominate with 25.6% share, while ready-to-eat formats record the fastest CAGR at 8.2%.
  • Growth is reinforced by strong urban convenience culture, premium positioning, and rising sustainability awareness.

Opportunity Analysis of South Korea Hybrid Meat Products Market

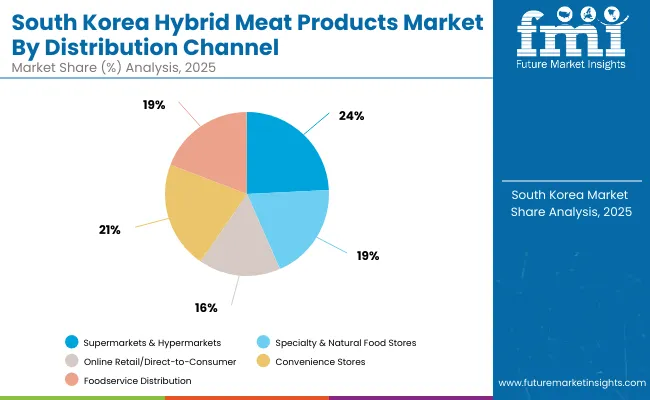
South Korea Hybrid Meat Products Market

Distribution Channel Market Value Share, 2025
Supermarkets & Hypermarkets 25.0%
Specialty & Natural Food Stores 20.0%
Online Retail/Direct-to-Consumer 18.0%
Convenience Stores 22.0%
Foodservice Distribution 15.0%

The Hybrid Meat Products Market in South Korea is projected at USD 19.7 million in 2025, with distribution dynamics strongly influenced by the country’s dense retail network and tech-driven consumer culture. Supermarkets and hypermarkets are expected to contribute the largest share at 24%, providing mainstream exposure and consumer trust. However, the fastest momentum is anticipated in foodservice distribution (8.0% CAGR), reflecting the rising role of hybrid proteins in quick-service restaurants and premium dining formats. Convenience stores, integral to South Korea’s food culture, are also forecasted to expand rapidly, supported by ready-to-eat hybrid meal solutions tailored for on-the-go consumption. Over the decade, digital-native retail and direct-to-consumer models are expected to deepen reach among younger demographics, driven by advanced e-commerce platforms and subscription models.
  • Supermarkets retain dominance with 24% share, reinforcing mainstream visibility.
  • Foodservice distribution leads growth with 8.0% CAGR, supported by QSR and dining integration.
  • Convenience stores strengthen adoption through urban lifestyle alignment and snackable hybrid formats.

Competitive Landscape of Hybrid Meat Products Market

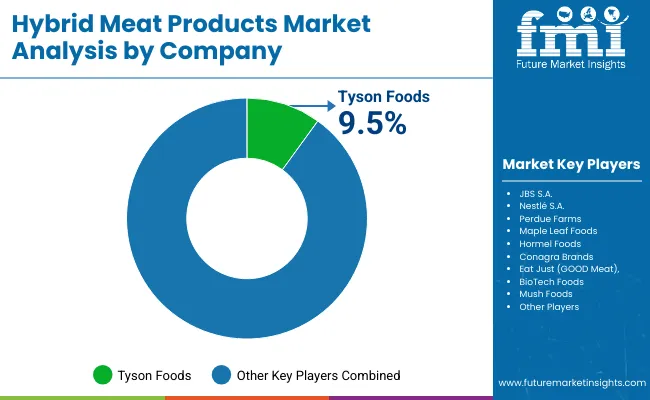
Hybrid Meat Products Market By Company

Company Global Value Share 2025
Tyson Foods 9.5%
Others 90 .5%

The Hybrid Meat Products Market is moderately fragmented, with global leaders, established mid-sized players, and innovation-driven specialists competing across product formats and distribution channels. Major global leaders such as Tyson Foods, JBS S.A., Nestlé S.A., and Perdue Farms have been leveraging scale, brand trust, and strong retail partnerships to dominate early adoption. Their strategies have emphasized diversification into hybrid categories to balance traditional meat portfolios with sustainable protein alternatives.

Established mid-sized innovators such as Maple Leaf Foods Inc., Hormel Foods Corporation, and Conagra Brands, Inc. have been focusing on product development agility, co-branding initiatives, and hybrid positioning strategies. These companies are accelerating adoption by aligning formulations with nutritional claims such as high-protein, fortified, and clean-label benefits. Their growing presence across supermarkets and foodservice has reinforced mainstream penetration.

Specialized pioneers such as Eat Just, Inc. (GOOD Meat), BioTech Foods, and Mush Foods are expected to reshape competition through advanced protein engineering, fermentation-driven innovations, and plant-based blends. Their strengths lie in customization, sustainability narratives, and appeal to younger consumer segments seeking ethical choices.

Competitive differentiation is shifting toward ecosystem building, with emphasis on taste innovation, cost efficiency, and scalable partnerships across retail and foodservice. Over time, hybrid meat players are anticipated to compete less on product novelty and more on supply chain resilience, affordability, and consumer trust.

Key Developments in Hybrid Meat Products Market

  • In August 2025, Launch of Hillshire Farm Sandwich Style Lunch Meats in three new bold flavors. These are more flavor extensions rather than explicitly hybrid meat + plant blends.
  • In 2024, Nestlé- “Maggi Rindecarne”: Plant-based meat extender product (soy + seasonings) launched in Chile, designed to be blended with meat; this is related to hybrid meat notions but precedes 2025.

Scope of the Report

Item Value
Quantitative Units USD 530.6 million
Product Type Burgers & Patties, Sausages & Hot Dogs, Meatballs, Nuggets & Bites, Minced/Ground Meat, Deli Meats & Slices, Ready-to-Eat Meals, Others (jerky, schnitzels, strips)
Source Beef-based Hybrids, Chicken-based Hybrids, Pork-based Hybrids, Fish & Seafood-based Hybrids, Turkey-based Hybrids, Vegetables, Soy Protein, Pea Protein, Wheat/Gluten Protein, Rice Protein, Faba Bean & Lentil Protein, Mycoprotein, Potato Protein, Chickpea, Hemp
Ingredient Functionality Protein Enhancers, Fiber & Binders, Flavor Enhancers, Fat/Oil Blends, Additives for Texture & Juiciness
Nutritional Positioning High-Protein Hybrids, Low-Fat/Reduced Calorie Hybrids, Fortified (vitamins, minerals, omega-3), Clean-Label, Conventional
Distribution Channel Supermarkets & Hypermarkets, Specialty & Natural Food Stores, Online Retail/Direct-to-Consumer, Convenience Stores, Foodservice Distribution
Regions Covered North America, Europe, Asia-Pacific, Latin America, Middle East & Africa
Country Covered United States, Canada, Germany, France, United Kingdom, China, Japan, India, Brazil, South Africa
Key Companies Profiled Tyson Foods, JBS S.A., Nestlé S.A., Perdue Farms, Maple Leaf Foods, Hormel Foods, Conagra Brands, Eat Just (GOOD Meat), BioTech Foods, Mush Foods
Additional Attributes Dollar sales by product type, source, and channel; adoption trends in mainstream retail and foodservice; price competitiveness vs. conventional meat; health and sustainability positioning; influence of government sustainability targets; innovation in hybrid protein formulations; regional growth drivers shaped by consumer culture and regulatory environment

Key Segments

By Product Type:

  • Burgers & Patties
  • Sausages & Hot Dogs
  • Meatballs
  • Nuggets & Bites
  • Minced/ Ground Meat
  • Deli Meats & Slices
  • Ready-to-Eat Meals
  • Others

By Source:

  • Beef-based Hybrids
  • Chicken-based Hybrids
  • Pork-based Hybrids
  • Fish & Seafood-based Hybrids
  • Turkey-based Hybrids
  • Plant-based Protein
    • Soy Protein
    • Pea Protein
    • Wheat/Gluten Protein
    • Rice Protein
    • Faba Bean & Lentil Protein
  • Potato Protein
  • Chickpea
  • Mycoprotein (fermentation-derived)
  • Hemp

By Functionality:

  • Protein Enhancers
  • Fiber & Binders
  • Flavor Enhancers & Seasonings
  • Fat/Oil Blends
  • Additives for Texture & Juiciness

By Nutritional Positioning:

  • High-Protein Hybrid Products
  • Low-Fat/Reduced Calorie Hybrids
  • Fortified
  • Clean-Label/Minimal Additives
  • Conventional

By Distribution Channel:

  • Supermarkets & Hypermarkets
  • Specialty & Natural Food Stores
  • Online Retail/Direct-to-Consumer
  • Convenience Stores
  • Foodservice Distribution

By Region:

  • North America
  • Latin America
  • Europe
  • East Asia
  • South Asia & Pacific
  • MEA

Table of Content

  1. Executive Summary
    • Global Market Outlook
    • Demand-side Trends
    • Supply-side Trends
    • Technology Roadmap Analysis
    • Analysis and Recommendations
  2. Market Overview
    • Market Coverage / Taxonomy
    • Market Definition / Scope / Limitations
  3. Market Background
    • Market Dynamics
      • Drivers
      • Restraints
      • Opportunity
      • Trends
    • Scenario Forecast
      • Demand in Optimistic Scenario
      • Demand in Likely Scenario
      • Demand in Conservative Scenario
    • Opportunity Map Analysis
    • Product Life Cycle Analysis
    • Supply Chain Analysis
    • Investment Feasibility Matrix
    • Value Chain Analysis
    • PESTLE and Porter’s Analysis
    • Regulatory Landscape
    • Regional Parent Market Outlook
    • Production and Consumption Statistics
    • Import and Export Statistics
  4. Global Market Analysis 2020 to 2024 and Forecast, 2025 to 2035
    • Historical Market Size Value (USD Million) & Volume (MT) Analysis, 2020 to 2024
    • Current and Future Market Size Value (USD Million) & Volume (MT) Projections, 2025 to 2035
      • Y-o-Y Growth Trend Analysis
      • Absolute $ Opportunity Analysis
  5. Global Market Pricing Analysis 2020 to 2024 and Forecast 2025 to 2035
  6. Global Market Analysis 2020 to 2024 and Forecast 2025 to 2035, By Product Type
    • Introduction / Key Findings
    • Historical Market Size Value (USD Million) & Volume (MT) Analysis By Product Type, 2020 to 2024
    • Current and Future Market Size Value (USD Million) & Volume (MT) Analysis and Forecast By Product Type, 2025 to 2035
      • Burgers & Patties
      • Sausages & Hot Dogs
      • Meatballs
      • Nuggets & Bites
      • Minced/ Ground Meat
      • Deli Meats & Slices
      • Ready-to-Eat Meals
      • Others
    • Y-o-Y Growth Trend Analysis By Product Type, 2020 to 2024
    • Absolute $ Opportunity Analysis By Product Type, 2025 to 2035
  7. Global Market Analysis 2020 to 2024 and Forecast 2025 to 2035, By Source
    • Introduction / Key Findings
    • Historical Market Size Value (USD Million) & Volume (MT) Analysis By Source, 2020 to 2024
    • Current and Future Market Size Value (USD Million) & Volume (MT) Analysis and Forecast By Source, 2025 to 2035
      • Beef-based Hybrids
      • Chicken-based Hybrids
      • Pork-based Hybrids
      • Fish & Seafood-based Hybrids
      • Turkey-based Hybrids
      • Plant-based Protein
        • Soy Protein
        • Pea Protein
        • Wheat/Gluten Protein
        • Rice Protein
        • Faba Bean & Lentil Protein
      • Potato Protein
      • Chickpea
      • Mycoprotein (fermentation-derived)
      • Hemp
    • Y-o-Y Growth Trend Analysis By Source, 2020 to 2024
    • Absolute $ Opportunity Analysis By Source, 2025 to 2035
  8. Global Market Analysis 2020 to 2024 and Forecast 2025 to 2035, By Functionality
    • Introduction / Key Findings
    • Historical Market Size Value (USD Million) & Volume (MT) Analysis By Functionality, 2020 to 2024
    • Current and Future Market Size Value (USD Million) & Volume (MT) Analysis and Forecast By Functionality, 2025 to 2035
      • Protein Enhancers
      • Fiber & Binders
      • Flavor Enhancers & Seasonings
      • Fat/Oil Blends
      • Additives for Texture & Juiciness
    • Y-o-Y Growth Trend Analysis By Functionality, 2020 to 2024
    • Absolute $ Opportunity Analysis By Functionality, 2025 to 2035
  9. Global Market Analysis 2020 to 2024 and Forecast 2025 to 2035, By Nutritional Positioning
    • Introduction / Key Findings
    • Historical Market Size Value (USD Million) & Volume (MT) Analysis By Nutritional Positioning, 2020 to 2024
    • Current and Future Market Size Value (USD Million) & Volume (MT) Analysis and Forecast By Nutritional Positioning, 2025 to 2035
      • High-Protein Hybrid Products
      • Low-Fat/Reduced Calorie Hybrids
      • Fortified
      • Clean-Label/Minimal Additives
      • Conventional
    • Y-o-Y Growth Trend Analysis By Nutritional Positioning, 2020 to 2024
    • Absolute $ Opportunity Analysis By Nutritional Positioning, 2025 to 2035
  10. Global Market Analysis 2020 to 2024 and Forecast 2025 to 2035, By Distribution Channel
    • Introduction / Key Findings
    • Historical Market Size Value (USD Million) & Volume (MT) Analysis By Distribution Channel, 2020 to 2024
    • Current and Future Market Size Value (USD Million) & Volume (MT) Analysis and Forecast By Distribution Channel, 2025 to 2035
      • Supermarkets & Hypermarkets
      • Specialty & Natural Food Stores
      • Online Retail/Direct-to-Consumer
      • Convenience Stores
      • Foodservice Distribution
    • Y-o-Y Growth Trend Analysis By Distribution Channel, 2020 to 2024
    • Absolute $ Opportunity Analysis By Distribution Channel, 2025 to 2035
  11. Global Market Analysis 2020 to 2024 and Forecast 2025 to 2035, By Region
    • Introduction
    • Historical Market Size Value (USD Million) & Volume (MT) Analysis By Region, 2020 to 2024
    • Current Market Size Value (USD Million) & Volume (MT) Analysis and Forecast By Region, 2025 to 2035
      • North America
      • Latin America
      • Europe
      • East Asia
      • South Asia & Pacific
      • MEA
    • Market Attractiveness Analysis By Region
  12. North America Market Analysis 2020 to 2024 and Forecast 2025 to 2035, By Country
    • Historical Market Size Value (USD Million) & Volume (MT) Trend Analysis By Market Taxonomy, 2020 to 2024
    • Market Size Value (USD Million) & Volume (MT) Forecast By Market Taxonomy, 2025 to 2035
      • By Country
        • U.S.
        • Canada
      • By Product Type
      • By Source
      • By Functionality
      • By Nutritional Positioning
      • By Distribution Channel
    • Market Attractiveness Analysis
      • By Country
      • By Product Type
      • By Source
      • By Functionality
      • By Nutritional Positioning
      • By Distribution Channel
    • Key Takeaways
  13. Latin America Market Analysis 2020 to 2024 and Forecast 2025 to 2035, By Country
    • Historical Market Size Value (USD Million) & Volume (MT) Trend Analysis By Market Taxonomy, 2020 to 2024
    • Market Size Value (USD Million) & Volume (MT) Forecast By Market Taxonomy, 2025 to 2035
      • By Country
        • Brazil
        • Mexico
        • Colombia
        • Rest of Latin America
      • By Product Type
      • By Source
      • By Functionality
      • By Nutritional Positioning
      • By Distribution Channel
    • Market Attractiveness Analysis
      • By Country
      • By Product Type
      • By Source
      • By Functionality
      • By Nutritional Positioning
      • By Distribution Channel
    • Key Takeaways
  14. Europe Market Analysis 2020 to 2024 and Forecast 2025 to 2035, By Country
    • Historical Market Size Value (USD Million) & Volume (MT) Trend Analysis By Market Taxonomy, 2020 to 2024
    • Market Size Value (USD Million) & Volume (MT) Forecast By Market Taxonomy, 2025 to 2035
      • By Country
        • Germany
        • U.K.
        • France
        • Italy
        • Spain
        • Belgium
        • Netherlands
        • Nordic
        • Switzerland
        • Russia
        • Poland
        • Rest of Europe
      • By Product Type
      • By Source
      • By Functionality
      • By Nutritional Positioning
      • By Distribution Channel
    • Market Attractiveness Analysis
      • By Country
      • By Product Type
      • By Source
      • By Functionality
      • By Nutritional Positioning
      • By Distribution Channel
    • Key Takeaways
  15. East Asia Market Analysis 2020 to 2024 and Forecast 2025 to 2035, By Country
    • Historical Market Size Value (USD Million) & Volume (MT) Trend Analysis By Market Taxonomy, 2020 to 2024
    • Market Size Value (USD Million) & Volume (MT) Forecast By Market Taxonomy, 2025 to 2035
      • By Country
        • China
        • Japan
        • South Korea
      • By Product Type
      • By Source
      • By Functionality
      • By Nutritional Positioning
      • By Distribution Channel
    • Market Attractiveness Analysis
      • By Country
      • By Product Type
      • By Source
      • By Functionality
      • By Nutritional Positioning
      • By Distribution Channel
    • Key Takeaways
  16. South Asia & Pacific Market Analysis 2020 to 2024 and Forecast 2025 to 2035, By Country
    • Historical Market Size Value (USD Million) & Volume (MT) Trend Analysis By Market Taxonomy, 2020 to 2024
    • Market Size Value (USD Million) & Volume (MT) Forecast By Market Taxonomy, 2025 to 2035
      • By Country
        • India
        • Thailand
        • Malaysia
        • Indonesia
        • Singapore
        • Vietnam
        • Australia
        • New Zealand
        • Rest of South Asia & Pacific
      • By Product Type
      • By Source
      • By Functionality
      • By Nutritional Positioning
      • By Distribution Channel
    • Market Attractiveness Analysis
      • By Country
      • By Product Type
      • By Source
      • By Functionality
      • By Nutritional Positioning
      • By Distribution Channel
    • Key Takeaways
  17. MEA Market Analysis 2020 to 2024 and Forecast 2025 to 2035, By Country
    • Historical Market Size Value (USD Million) & Volume (MT) Trend Analysis By Market Taxonomy, 2020 to 2024
    • Market Size Value (USD Million) & Volume (MT) Forecast By Market Taxonomy, 2025 to 2035
      • By Country
        • Turkey
        • UAE
        • Saudi Arabia
        • Israel
        • Other GCC Countries
        • North Africa
        • South Africa
        • Central Africa
      • By Product Type
      • By Source
      • By Functionality
      • By Nutritional Positioning
      • By Distribution Channel
    • Market Attractiveness Analysis
      • By Country
      • By Product Type
      • By Source
      • By Functionality
      • By Nutritional Positioning
      • By Distribution Channel
    • Key Takeaways
  18. Key Countries Market Analysis
    • U.S.
      • Pricing Analysis
      • Market Share Analysis, 2024
        • By Product Type
        • By Source
        • By Functionality
        • By Nutritional Positioning
        • By Distribution Channel
    • Canada
      • Pricing Analysis
      • Market Share Analysis, 2024
        • By Product Type
        • By Source
        • By Functionality
        • By Nutritional Positioning
        • By Distribution Channel
    • Brazil
      • Pricing Analysis
      • Market Share Analysis, 2024
        • By Product Type
        • By Source
        • By Functionality
        • By Nutritional Positioning
        • By Distribution Channel
    • Mexico
      • Pricing Analysis
      • Market Share Analysis, 2024
        • By Product Type
        • By Source
        • By Functionality
        • By Nutritional Positioning
        • By Distribution Channel
    • Colombia
      • Pricing Analysis
      • Market Share Analysis, 2024
        • By Product Type
        • By Source
        • By Functionality
        • By Nutritional Positioning
        • By Distribution Channel
    • Germany
      • Pricing Analysis
      • Market Share Analysis, 2024
        • By Product Type
        • By Source
        • By Functionality
        • By Nutritional Positioning
        • By Distribution Channel
    • U.K.
      • Pricing Analysis
      • Market Share Analysis, 2024
        • By Product Type
        • By Source
        • By Functionality
        • By Nutritional Positioning
        • By Distribution Channel
    • France
      • Pricing Analysis
      • Market Share Analysis, 2024
        • By Product Type
        • By Source
        • By Functionality
        • By Nutritional Positioning
        • By Distribution Channel
    • Italy
      • Pricing Analysis
      • Market Share Analysis, 2024
        • By Product Type
        • By Source
        • By Functionality
        • By Nutritional Positioning
        • By Distribution Channel
    • Spain
      • Pricing Analysis
      • Market Share Analysis, 2024
        • By Product Type
        • By Source
        • By Functionality
        • By Nutritional Positioning
        • By Distribution Channel
    • Belgium
      • Pricing Analysis
      • Market Share Analysis, 2024
        • By Product Type
        • By Source
        • By Functionality
        • By Nutritional Positioning
        • By Distribution Channel
    • Netherlands
      • Pricing Analysis
      • Market Share Analysis, 2024
        • By Product Type
        • By Source
        • By Functionality
        • By Nutritional Positioning
        • By Distribution Channel
    • Nordic
      • Pricing Analysis
      • Market Share Analysis, 2024
        • By Product Type
        • By Source
        • By Functionality
        • By Nutritional Positioning
        • By Distribution Channel
    • Switzerland
      • Pricing Analysis
      • Market Share Analysis, 2024
        • By Product Type
        • By Source
        • By Functionality
        • By Nutritional Positioning
        • By Distribution Channel
    • Russia
      • Pricing Analysis
      • Market Share Analysis, 2024
        • By Product Type
        • By Source
        • By Functionality
        • By Nutritional Positioning
        • By Distribution Channel
    • Poland
      • Pricing Analysis
      • Market Share Analysis, 2024
        • By Product Type
        • By Source
        • By Functionality
        • By Nutritional Positioning
        • By Distribution Channel
    • China
      • Pricing Analysis
      • Market Share Analysis, 2024
        • By Product Type
        • By Source
        • By Functionality
        • By Nutritional Positioning
        • By Distribution Channel
    • Japan
      • Pricing Analysis
      • Market Share Analysis, 2024
        • By Product Type
        • By Source
        • By Functionality
        • By Nutritional Positioning
        • By Distribution Channel
    • South Korea
      • Pricing Analysis
      • Market Share Analysis, 2024
        • By Product Type
        • By Source
        • By Functionality
        • By Nutritional Positioning
        • By Distribution Channel
    • India
      • Pricing Analysis
      • Market Share Analysis, 2024
        • By Product Type
        • By Source
        • By Functionality
        • By Nutritional Positioning
        • By Distribution Channel
    • Thailand
      • Pricing Analysis
      • Market Share Analysis, 2024
        • By Product Type
        • By Source
        • By Functionality
        • By Nutritional Positioning
        • By Distribution Channel
    • Indonesia
      • Pricing Analysis
      • Market Share Analysis, 2024
        • By Product Type
        • By Source
        • By Functionality
        • By Nutritional Positioning
        • By Distribution Channel
    • Australia
      • Pricing Analysis
      • Market Share Analysis, 2024
        • By Product Type
        • By Source
        • By Functionality
        • By Nutritional Positioning
        • By Distribution Channel
    • New Zealand
      • Pricing Analysis
      • Market Share Analysis, 2024
        • By Product Type
        • By Source
        • By Functionality
        • By Nutritional Positioning
        • By Distribution Channel
    • Turkey
      • Pricing Analysis
      • Market Share Analysis, 2024
        • By Product Type
        • By Source
        • By Functionality
        • By Nutritional Positioning
        • By Distribution Channel
    • UAE
      • Pricing Analysis
      • Market Share Analysis, 2024
        • By Product Type
        • By Source
        • By Functionality
        • By Nutritional Positioning
        • By Distribution Channel
    • Saudi Arabia
      • Pricing Analysis
      • Market Share Analysis, 2024
        • By Product Type
        • By Source
        • By Functionality
        • By Nutritional Positioning
        • By Distribution Channel
    • Israel
      • Pricing Analysis
      • Market Share Analysis, 2024
        • By Product Type
        • By Source
        • By Functionality
        • By Nutritional Positioning
        • By Distribution Channel
    • North Africa
      • Pricing Analysis
      • Market Share Analysis, 2024
        • By Product Type
        • By Source
        • By Functionality
        • By Nutritional Positioning
        • By Distribution Channel
    • South Africa
      • Pricing Analysis
      • Market Share Analysis, 2024
        • By Product Type
        • By Source
        • By Functionality
        • By Nutritional Positioning
        • By Distribution Channel
  19. Market Structure Analysis
    • Competition Dashboard
    • Competition Benchmarking
    • Market Share Analysis of Top Players
      • By Regional
      • By Product Type
      • By Source
      • By Functionality
      • By Nutritional Positioning
      • By Distribution Channel
  20. Competition Analysis
    • Competition Deep Dive
      • Perdue Farms
        • Overview
        • Product Portfolio
        • Profitability by Market Segments (Product Type/Source Distribution Channel/Region)
        • Sales Footprint
        • Strategy Overview
      • Tyson Foods, Inc.
      • JBS S.A.
      • Nestlé S.A.
      • Maple Leaf Foods Inc.
      • Hormel Foods Corporation
      • Conagra Brands, Inc.
      • Eat Just, Inc. (GOOD Meat)
      • BioTech Foods
      • Mush Foods
        • Others
    • Assumptions & Acronyms Used
    • Research Methodology

List of Tables

  • Table 1: Global Market Value (USD Million) Forecast by Region, 2020-2035
  • Table 2: Global Market Volume (MT) Forecast by Region, 2020-2035
  • Table 3: Global Market Value (USD Million) Forecast by Product Type, 2020-2035
  • Table 4: Global Market Volume (MT) Forecast by Product Type, 2020-2035
  • Table 5: Global Market Value (USD Million) Forecast by Source, 2020-2035
  • Table 6: Global Market Volume (MT) Forecast by Source, 2020-2035
  • Table 7: Global Market Value (USD Million) Forecast by Functionality, 2020-2035
  • Table 8: Global Market Volume (MT) Forecast by Functionality, 2020-2035
  • Table 9: Global Market Value (USD Million) Forecast by Nutritional Positioning, 2020-2035
  • Table 10: Global Market Volume (MT) Forecast by Nutritional Positioning, 2020-2035
  • Table 11: Global Market Value (USD Million) Forecast by Distribution Channel, 2020-2035
  • Table 12: Global Market Volume (MT) Forecast by Distribution Channel, 2020-2035
  • Table 13: North America Market Value (USD Million) Forecast by Country, 2020-2035
  • Table 14: North America Market Volume (MT) Forecast by Country, 2020-2035
  • Table 15: North America Market Value (USD Million) Forecast by Product Type, 2020-2035
  • Table 16: North America Market Volume (MT) Forecast by Product Type, 2020-2035
  • Table 17: North America Market Value (USD Million) Forecast by Source, 2020-2035
  • Table 18: North America Market Volume (MT) Forecast by Source, 2020-2035
  • Table 19: North America Market Value (USD Million) Forecast by Functionality, 2020-2035
  • Table 20: North America Market Volume (MT) Forecast by Functionality, 2020-2035
  • Table 21: North America Market Value (USD Million) Forecast by Nutritional Positioning, 2020-2035
  • Table 22: North America Market Volume (MT) Forecast by Nutritional Positioning, 2020-2035
  • Table 23: North America Market Value (USD Million) Forecast by Distribution Channel, 2020-2035
  • Table 24: North America Market Volume (MT) Forecast by Distribution Channel, 2020-2035
  • Table 25: Latin America Market Value (USD Million) Forecast by Country, 2020-2035
  • Table 26: Latin America Market Volume (MT) Forecast by Country, 2020-2035
  • Table 27: Latin America Market Value (USD Million) Forecast by Product Type, 2020-2035
  • Table 28: Latin America Market Volume (MT) Forecast by Product Type, 2020-2035
  • Table 29: Latin America Market Value (USD Million) Forecast by Source, 2020-2035
  • Table 30: Latin America Market Volume (MT) Forecast by Source, 2020-2035
  • Table 31: Latin America Market Value (USD Million) Forecast by Functionality, 2020-2035
  • Table 32: Latin America Market Volume (MT) Forecast by Functionality, 2020-2035
  • Table 33: Latin America Market Value (USD Million) Forecast by Nutritional Positioning, 2020-2035
  • Table 34: Latin America Market Volume (MT) Forecast by Nutritional Positioning, 2020-2035
  • Table 35: Latin America Market Value (USD Million) Forecast by Distribution Channel, 2020-2035
  • Table 36: Latin America Market Volume (MT) Forecast by Distribution Channel, 2020-2035
  • Table 37: Europe Market Value (USD Million) Forecast by Country, 2020-2035
  • Table 38: Europe Market Volume (MT) Forecast by Country, 2020-2035
  • Table 39: Europe Market Value (USD Million) Forecast by Product Type, 2020-2035
  • Table 40: Europe Market Volume (MT) Forecast by Product Type, 2020-2035
  • Table 41: Europe Market Value (USD Million) Forecast by Source, 2020-2035
  • Table 42: Europe Market Volume (MT) Forecast by Source, 2020-2035
  • Table 43: Europe Market Value (USD Million) Forecast by Functionality, 2020-2035
  • Table 44: Europe Market Volume (MT) Forecast by Functionality, 2020-2035
  • Table 45: Europe Market Value (USD Million) Forecast by Nutritional Positioning, 2020-2035
  • Table 46: Europe Market Volume (MT) Forecast by Nutritional Positioning, 2020-2035
  • Table 47: Europe Market Value (USD Million) Forecast by Distribution Channel, 2020-2035
  • Table 48: Europe Market Volume (MT) Forecast by Distribution Channel, 2020-2035
  • Table 49: East Asia Market Value (USD Million) Forecast by Country, 2020-2035
  • Table 50: East Asia Market Volume (MT) Forecast by Country, 2020-2035
  • Table 51: East Asia Market Value (USD Million) Forecast by Product Type, 2020-2035
  • Table 52: East Asia Market Volume (MT) Forecast by Product Type, 2020-2035
  • Table 53: East Asia Market Value (USD Million) Forecast by Source, 2020-2035
  • Table 54: East Asia Market Volume (MT) Forecast by Source, 2020-2035
  • Table 55: East Asia Market Value (USD Million) Forecast by Functionality, 2020-2035
  • Table 56: East Asia Market Volume (MT) Forecast by Functionality, 2020-2035
  • Table 57: East Asia Market Value (USD Million) Forecast by Nutritional Positioning, 2020-2035
  • Table 58: East Asia Market Volume (MT) Forecast by Nutritional Positioning, 2020-2035
  • Table 59: East Asia Market Value (USD Million) Forecast by Distribution Channel, 2020-2035
  • Table 60: East Asia Market Volume (MT) Forecast by Distribution Channel, 2020-2035
  • Table 61: South Asia & Pacific Market Value (USD Million) Forecast by Country, 2020-2035
  • Table 62: South Asia & Pacific Market Volume (MT) Forecast by Country, 2020-2035
  • Table 63: South Asia & Pacific Market Value (USD Million) Forecast by Product Type, 2020-2035
  • Table 64: South Asia & Pacific Market Volume (MT) Forecast by Product Type, 2020-2035
  • Table 65: South Asia & Pacific Market Value (USD Million) Forecast by Source, 2020-2035
  • Table 66: South Asia & Pacific Market Volume (MT) Forecast by Source, 2020-2035
  • Table 67: South Asia & Pacific Market Value (USD Million) Forecast by Functionality, 2020-2035
  • Table 68: South Asia & Pacific Market Volume (MT) Forecast by Functionality, 2020-2035
  • Table 69: South Asia & Pacific Market Value (USD Million) Forecast by Nutritional Positioning, 2020-2035
  • Table 70: South Asia & Pacific Market Volume (MT) Forecast by Nutritional Positioning, 2020-2035
  • Table 71: South Asia & Pacific Market Value (USD Million) Forecast by Distribution Channel, 2020-2035
  • Table 72: South Asia & Pacific Market Volume (MT) Forecast by Distribution Channel, 2020-2035
  • Table 73: MEA Market Value (USD Million) Forecast by Country, 2020-2035
  • Table 74: MEA Market Volume (MT) Forecast by Country, 2020-2035
  • Table 75: MEA Market Value (USD Million) Forecast by Product Type, 2020-2035
  • Table 76: MEA Market Volume (MT) Forecast by Product Type, 2020-2035
  • Table 77: MEA Market Value (USD Million) Forecast by Source, 2020-2035
  • Table 78: MEA Market Volume (MT) Forecast by Source, 2020-2035
  • Table 79: MEA Market Value (USD Million) Forecast by Functionality, 2020-2035
  • Table 80: MEA Market Volume (MT) Forecast by Functionality, 2020-2035
  • Table 81: MEA Market Value (USD Million) Forecast by Nutritional Positioning, 2020-2035
  • Table 82: MEA Market Volume (MT) Forecast by Nutritional Positioning, 2020-2035
  • Table 83: MEA Market Value (USD Million) Forecast by Distribution Channel, 2020-2035
  • Table 84: MEA Market Volume (MT) Forecast by Distribution Channel, 2020-2035

List of Figures

  • Figure 1: Global Market Volume (MT) Forecast 2020-2035
  • Figure 2: Global Market Pricing Analysis
  • Figure 3: Global Market Value (USD Million) Forecast 2020-2035
  • Figure 4: Global Market Value Share and BPS Analysis by Product Type, 2025 and 2035
  • Figure 5: Global Market Y-o-Y Growth Comparison by Product Type, 2025-2035
  • Figure 6: Global Market Attractiveness Analysis by Product Type
  • Figure 7: Global Market Value Share and BPS Analysis by Source, 2025 and 2035
  • Figure 8: Global Market Y-o-Y Growth Comparison by Source, 2025-2035
  • Figure 9: Global Market Attractiveness Analysis by Source
  • Figure 10: Global Market Value Share and BPS Analysis by Functionality, 2025 and 2035
  • Figure 11: Global Market Y-o-Y Growth Comparison by Functionality, 2025-2035
  • Figure 12: Global Market Attractiveness Analysis by Functionality
  • Figure 13: Global Market Value Share and BPS Analysis by Nutritional Positioning, 2025 and 2035
  • Figure 14: Global Market Y-o-Y Growth Comparison by Nutritional Positioning, 2025-2035
  • Figure 15: Global Market Attractiveness Analysis by Nutritional Positioning
  • Figure 16: Global Market Value Share and BPS Analysis by Distribution Channel, 2025 and 2035
  • Figure 17: Global Market Y-o-Y Growth Comparison by Distribution Channel, 2025-2035
  • Figure 18: Global Market Attractiveness Analysis by Distribution Channel
  • Figure 19: Global Market Value (USD Million) Share and BPS Analysis by Region, 2025 and 2035
  • Figure 20: Global Market Y-o-Y Growth Comparison by Region, 2025-2035
  • Figure 21: Global Market Attractiveness Analysis by Region
  • Figure 22: North America Market Incremental $ Opportunity, 2025-2035
  • Figure 23: Latin America Market Incremental $ Opportunity, 2025-2035
  • Figure 24: Europe Market Incremental $ Opportunity, 2025-2035
  • Figure 25: East Asia Market Incremental $ Opportunity, 2025-2035
  • Figure 26: South Asia & Pacific Market Incremental $ Opportunity, 2025-2035
  • Figure 27: MEA Market Incremental $ Opportunity, 2025-2035
  • Figure 28: North America Market Value Share and BPS Analysis by Country, 2025 and 2035
  • Figure 29: North America Market Value Share and BPS Analysis by Product Type, 2025 and 2035
  • Figure 30: North America Market Y-o-Y Growth Comparison by Product Type, 2025-2035
  • Figure 31: North America Market Attractiveness Analysis by Product Type
  • Figure 32: North America Market Value Share and BPS Analysis by Source, 2025 and 2035
  • Figure 33: North America Market Y-o-Y Growth Comparison by Source, 2025-2035
  • Figure 34: North America Market Attractiveness Analysis by Source
  • Figure 35: North America Market Value Share and BPS Analysis by Functionality, 2025 and 2035
  • Figure 36: North America Market Y-o-Y Growth Comparison by Functionality, 2025-2035
  • Figure 37: North America Market Attractiveness Analysis by Functionality
  • Figure 38: North America Market Value Share and BPS Analysis by Nutritional Positioning, 2025 and 2035
  • Figure 39: North America Market Y-o-Y Growth Comparison by Nutritional Positioning, 2025-2035
  • Figure 40: North America Market Attractiveness Analysis by Nutritional Positioning
  • Figure 41: North America Market Value Share and BPS Analysis by Distribution Channel, 2025 and 2035
  • Figure 42: North America Market Y-o-Y Growth Comparison by Distribution Channel, 2025-2035
  • Figure 43: North America Market Attractiveness Analysis by Distribution Channel
  • Figure 44: Latin America Market Value Share and BPS Analysis by Country, 2025 and 2035
  • Figure 45: Latin America Market Value Share and BPS Analysis by Product Type, 2025 and 2035
  • Figure 46: Latin America Market Y-o-Y Growth Comparison by Product Type, 2025-2035
  • Figure 47: Latin America Market Attractiveness Analysis by Product Type
  • Figure 48: Latin America Market Value Share and BPS Analysis by Source, 2025 and 2035
  • Figure 49: Latin America Market Y-o-Y Growth Comparison by Source, 2025-2035
  • Figure 50: Latin America Market Attractiveness Analysis by Source
  • Figure 51: Latin America Market Value Share and BPS Analysis by Functionality, 2025 and 2035
  • Figure 52: Latin America Market Y-o-Y Growth Comparison by Functionality, 2025-2035
  • Figure 53: Latin America Market Attractiveness Analysis by Functionality
  • Figure 54: Latin America Market Value Share and BPS Analysis by Nutritional Positioning, 2025 and 2035
  • Figure 55: Latin America Market Y-o-Y Growth Comparison by Nutritional Positioning, 2025-2035
  • Figure 56: Latin America Market Attractiveness Analysis by Nutritional Positioning
  • Figure 57: Latin America Market Value Share and BPS Analysis by Distribution Channel, 2025 and 2035
  • Figure 58: Latin America Market Y-o-Y Growth Comparison by Distribution Channel, 2025-2035
  • Figure 59: Latin America Market Attractiveness Analysis by Distribution Channel
  • Figure 60: Europe Market Value Share and BPS Analysis by Country, 2025 and 2035
  • Figure 61: Europe Market Value Share and BPS Analysis by Product Type, 2025 and 2035
  • Figure 62: Europe Market Y-o-Y Growth Comparison by Product Type, 2025-2035
  • Figure 63: Europe Market Attractiveness Analysis by Product Type
  • Figure 64: Europe Market Value Share and BPS Analysis by Source, 2025 and 2035
  • Figure 65: Europe Market Y-o-Y Growth Comparison by Source, 2025-2035
  • Figure 66: Europe Market Attractiveness Analysis by Source
  • Figure 67: Europe Market Value Share and BPS Analysis by Functionality, 2025 and 2035
  • Figure 68: Europe Market Y-o-Y Growth Comparison by Functionality, 2025-2035
  • Figure 69: Europe Market Attractiveness Analysis by Functionality
  • Figure 70: Europe Market Value Share and BPS Analysis by Nutritional Positioning, 2025 and 2035
  • Figure 71: Europe Market Y-o-Y Growth Comparison by Nutritional Positioning, 2025-2035
  • Figure 72: Europe Market Attractiveness Analysis by Nutritional Positioning
  • Figure 73: Europe Market Value Share and BPS Analysis by Distribution Channel, 2025 and 2035
  • Figure 74: Europe Market Y-o-Y Growth Comparison by Distribution Channel, 2025-2035
  • Figure 75: Europe Market Attractiveness Analysis by Distribution Channel
  • Figure 76: East Asia Market Value Share and BPS Analysis by Country, 2025 and 2035
  • Figure 77: East Asia Market Value Share and BPS Analysis by Product Type, 2025 and 2035
  • Figure 78: East Asia Market Y-o-Y Growth Comparison by Product Type, 2025-2035
  • Figure 79: East Asia Market Attractiveness Analysis by Product Type
  • Figure 80: East Asia Market Value Share and BPS Analysis by Source, 2025 and 2035
  • Figure 81: East Asia Market Y-o-Y Growth Comparison by Source, 2025-2035
  • Figure 82: East Asia Market Attractiveness Analysis by Source
  • Figure 83: East Asia Market Value Share and BPS Analysis by Functionality, 2025 and 2035
  • Figure 84: East Asia Market Y-o-Y Growth Comparison by Functionality, 2025-2035
  • Figure 85: East Asia Market Attractiveness Analysis by Functionality
  • Figure 86: East Asia Market Value Share and BPS Analysis by Nutritional Positioning, 2025 and 2035
  • Figure 87: East Asia Market Y-o-Y Growth Comparison by Nutritional Positioning, 2025-2035
  • Figure 88: East Asia Market Attractiveness Analysis by Nutritional Positioning
  • Figure 89: East Asia Market Value Share and BPS Analysis by Distribution Channel, 2025 and 2035
  • Figure 90: East Asia Market Y-o-Y Growth Comparison by Distribution Channel, 2025-2035
  • Figure 91: East Asia Market Attractiveness Analysis by Distribution Channel
  • Figure 92: South Asia & Pacific Market Value Share and BPS Analysis by Country, 2025 and 2035
  • Figure 93: South Asia & Pacific Market Value Share and BPS Analysis by Product Type, 2025 and 2035
  • Figure 94: South Asia & Pacific Market Y-o-Y Growth Comparison by Product Type, 2025-2035
  • Figure 95: South Asia & Pacific Market Attractiveness Analysis by Product Type
  • Figure 96: South Asia & Pacific Market Value Share and BPS Analysis by Source, 2025 and 2035
  • Figure 97: South Asia & Pacific Market Y-o-Y Growth Comparison by Source, 2025-2035
  • Figure 98: South Asia & Pacific Market Attractiveness Analysis by Source
  • Figure 99: South Asia & Pacific Market Value Share and BPS Analysis by Functionality, 2025 and 2035
  • Figure 100: South Asia & Pacific Market Y-o-Y Growth Comparison by Functionality, 2025-2035
  • Figure 101: South Asia & Pacific Market Attractiveness Analysis by Functionality
  • Figure 102: South Asia & Pacific Market Value Share and BPS Analysis by Nutritional Positioning, 2025 and 2035
  • Figure 103: South Asia & Pacific Market Y-o-Y Growth Comparison by Nutritional Positioning, 2025-2035
  • Figure 104: South Asia & Pacific Market Attractiveness Analysis by Nutritional Positioning
  • Figure 105: South Asia & Pacific Market Value Share and BPS Analysis by Distribution Channel, 2025 and 2035
  • Figure 106: South Asia & Pacific Market Y-o-Y Growth Comparison by Distribution Channel, 2025-2035
  • Figure 107: South Asia & Pacific Market Attractiveness Analysis by Distribution Channel
  • Figure 108: MEA Market Value Share and BPS Analysis by Country, 2025 and 2035
  • Figure 109: MEA Market Value Share and BPS Analysis by Product Type, 2025 and 2035
  • Figure 110: MEA Market Y-o-Y Growth Comparison by Product Type, 2025-2035
  • Figure 111: MEA Market Attractiveness Analysis by Product Type
  • Figure 112: MEA Market Value Share and BPS Analysis by Source, 2025 and 2035
  • Figure 113: MEA Market Y-o-Y Growth Comparison by Source, 2025-2035
  • Figure 114: MEA Market Attractiveness Analysis by Source
  • Figure 115: MEA Market Value Share and BPS Analysis by Functionality, 2025 and 2035
  • Figure 116: MEA Market Y-o-Y Growth Comparison by Functionality, 2025-2035
  • Figure 117: MEA Market Attractiveness Analysis by Functionality
  • Figure 118: MEA Market Value Share and BPS Analysis by Nutritional Positioning, 2025 and 2035
  • Figure 119: MEA Market Y-o-Y Growth Comparison by Nutritional Positioning, 2025-2035
  • Figure 120: MEA Market Attractiveness Analysis by Nutritional Positioning
  • Figure 121: MEA Market Value Share and BPS Analysis by Distribution Channel, 2025 and 2035
  • Figure 122: MEA Market Y-o-Y Growth Comparison by Distribution Channel, 2025-2035
  • Figure 123: MEA Market Attractiveness Analysis by Distribution Channel
  • Figure 124: Global Market - Tier Structure Analysis
  • Figure 125: Global Market - Company Share Analysis

Frequently Asked Questions

How big is the Hybrid Meat Products Market in 2025?

The global Hybrid Meat Products is estimated to be valued at USD 530.6 million in 2025.

What will be the size of Hybrid Meat Products Market in 2035?

The market size for the Hybrid Meat Products is projected to reach USD 1,314.9 million by 2035.

How much will be the Hybrid Meat Products Market growth between 2025 and 2035?

The Hybrid Meat Products is expected to grow at a 9.5% CAGR between 2025 and 2035.

What are the key product type in the Hybrid Meat Products Market?

The key product types in the Hybrid Meat Products Market are burgers & patties, sausages & hot dogs, meatballs, nuggets & bites, minced/ground meat, deli meats & slices, ready-to-eat meals, and other formats such as jerky and schnitzels.

Which product type segment to contribute significant share in the Hybrid Meat Products Market in 2025?

In terms of product type, burgers & patties are projected to command the largest share at 26.7% in the Hybrid Meat Products Market in 2025.

Explore Similar Insights

Future Market Insights

Hybrid Meat Products Market

Chat With

MaRIA

Hi There, I am MaRIA, Your Market Research Intelligence Assistant. How may I help you?