Reports

- Global Locations -

Headquarters

Future Market Insights, Inc.

Christiana Corporate, 200
Continental Drive, Suite 401,
Newark, Delaware - 19713,
United States

T: +1-845-579-5705

Americas

Future Market Insights, Inc.

616 Corporate Way, Suite 2-9018,
Valley Cottage, NY 10989, United States

T: +1-347-918-3531

MEA

Future Market Insights

1602-6 Jumeirah Bay X2 Tower, Plot No: JLT-PH2-X2A,
Jumeirah Lakes Towers, Dubai,
United Arab Emirates

Europe

Future Market Insights

3rd Floor, 207 Regent Street,
W1B 3HH London
United Kingdom

T: + 44 (0) 20 8123 9659
D: +44 (0) 20 3287 4268

Asia Pacific

Future Market Insights

IndiaLand Global Tech Park, Unit UG-1, Behind Grand HighStreet, Phase 1, Hinjawadi, MH, Pune – 411057, India

Cloud ERP Market Outlook (2023 to 2033)

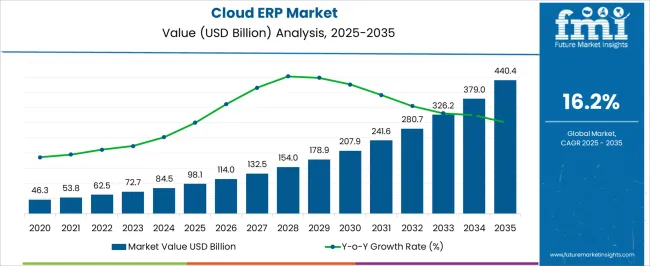
The global cloud ERP market size is poised to showcase monumental growth from 2023 to 2033. According to the research report published by Future Market Insights, the global market is slated to exceed a valuation of US$ 72,679.4 million in 2023. It is predicted to reach a valuation of US$ 327,126.8 million by 2033. The market is foreseen to thrive at a CAGR of 16.2% from 2023 to 2033.

Increasing focus on workforce efficiency through improved technologies, and demand for mobility solutions, prompting the growth of the market. Moreover, the growing desire among businesses to improve operational efficiency and optimize business operations, and the increasing use of cloud-based solutions are driving the expansion of the cloud ERP sector.

The market is further expected to grow at a significant pace throughout the forecast period due to the increased adoption of cloud computing, enhanced digitization techniques, and financial applications.

Attribute Details
Cloud ERP Market Share (2022) US$ 63,420.1 million
Cloud ERP Market Share (2023) US$ 72,679.4 million
Cloud ERP Market Share (2033) US$ 327,126.8 million
Cloud ERP Market Share (2023 to 2033) 16.2%

Don't pay for what you don't need

Customize your report by selecting specific countries or regions and save 30%!

What is Propelling the Growth of the Market?

Businesses all around the world are focusing on improving their business processes to boost operational efficiency while keeping expenses under control. Businesses are looking for a centralized solution to manage a variety of business activities, including finance and accounting, sales and marketing, procurement, and supply chain management.

Cloud ERP provides businesses with the flexibility and scalability they need to improve productivity and streamline processes. Cloud ERP is one of the most important tools a company can utilize to stay ahead of the competition by assisting them in running their organization and enhancing the demand for the market. Cloud ERP ensures many things such as:

  • Fast supply of accurate financial data
  • Increased financial performance
  • Quick data-driven choices
  • Improved quality and inventory management
  • Streamlined software, hardware, and network architecture

What Restrains the Market?

Although cloud-based solutions give businesses huge flexibility and scale, they often limit customized choices. The core product set of SaaS-based models now includes customizations. Enterprises that require substantial customization, especially concerning key functions, may find it challenging to do so with a SaaS-based ERP system.

The majority of cloud ERP vendors offer apps such as human capital management or CRM. However, just a few vendors offer a single suite of solutions that meets most of the user’s needs. These limitations are stifling cloud ERP adoption and stunting the industry's expansion.

Sudip Saha
Sudip Saha

Principal Consultant

Talk to Analyst

Find your sweet spots for generating winning opportunities in this market.

What are the Opportunities in the Market?

Every business operation generates specialized data in a certain format, and businesses collect enormous amounts of data daily. Enterprises are using analytics-based solutions to draw conclusions and make data-driven decisions to handle such a fluctuating and massive stream of data, In turn, it promotes the adoption of cloud ERP.

Big data and analytics create a new income stream for cloud ERP vendors as enterprises seek analytics-based solutions. Analytics tools are used by professionals all around the world to improve asset utilization and increase operational agility and reliability.

What are the Stumbling Blocks in the Market?

Few firms continue to rely on their present systems due to a lack of resources, which are based on outdated technology and include manual processes. Consequently, it results in a high rate of mistakes and a long turnaround time, hampering the efficiency of the Market.

There may be several legacy programs that are incompatible with new systems or require additional integration effort. Organizations continue to oppose considerable hurdles in integrating these solutions with their existing systems due to system complexities and implementation costs.

Get the data you need at a Fraction of the cost

Personalize your report by choosing insights you need
and save 40%!

Cloud ERP Market Historical Analysis (2018 to 2022) Vs. Forecast Outlook (2023 to 2033)

The global cloud ERP industry size expanded at a CAGR of 14.1% from 2018 to 2022. In 2018, the global market size stood at US$ 37,352.9 million. In the following years, the market witnessed tremendous growth, accounting for US$ 63,420.1 million in 2022. An important factor that greatly contributes toward the growth of the market is the rising incorporation of modern technologies such as:

  • Artificial Intelligence (AI)
  • The Internet of Things (IoT)
  • 3D printing/additive manufacturing
  • advanced sensors
  • others by end customers

Several sectors, including accounting and manufacturing, are deploying AI and other advanced technology-powered solutions to automate common activities.

Category-wise Insights

What is the Segmentation Outlook of the Market?

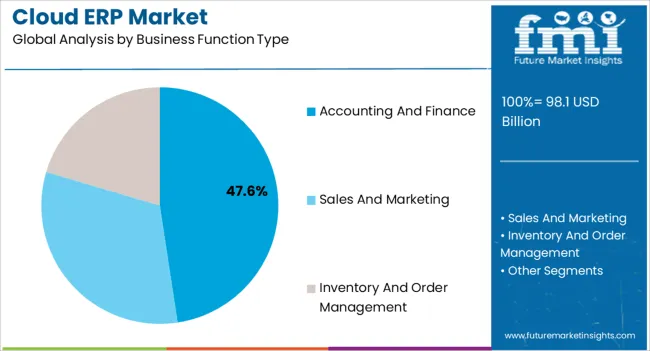
The market is segmented into components, organizational size, business function type, service type, application, and region. Accounting and finance are two of the most important business operations in any company. When it comes to financial data, businesses exercise extreme caution.

For worldwide enterprises in a wide range of industries, cloud ERP for finance and accounting is meant to be comprehensive, integrated, and highly scalable. It has a ledger and analytics, as well as payables and assets. It centralizes client data, recognizes revenues and invoices, generates customer invoices, receives and processes customer payments, processes customer payments, manages customer balances, and tracks bankrupt customers.

Which Application Has the Maximum Potential in the Market?

The BFSI sector is expected to see significant growth in the overall market since these solutions are primarily employed to improve the customer experience. Meanwhile, with features such as live operational tracking, secure transactions, and assessment and investigation, it is also being utilized to manage sensitive and critical data of consumers.

Which Enterprise is Leading the Market?

Large enterprises are likely to boost their demand for cloud ERP during the forecast period. Large enterprises are significantly adopting cloud-based solutions and services, and this trend is expected to continue during the forecast period. As a result, large enterprises are expected to have a prodigious CAGR of 16.5%. This is owing to the cloud ERP solution's low cost and significant economies of scale, which allow businesses to take advantage of its benefits.

Large enterprises invest heavily in manufacturing research and development, allowing them to take advantage of new digital solutions, such as cloud ERP, to optimize their business processes. In today's highly competitive world, multinational corporations, in particular, leave no stone unturned in their quest for a high market share. Hence, they invest enormous resources in becoming technologically competent.

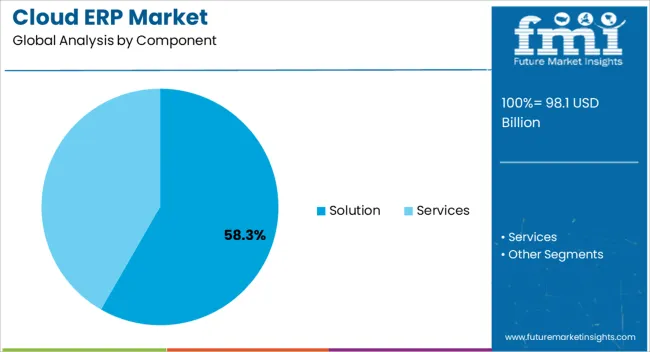
The solution segment by component holds the lion’s share in the global market. In 2022, the solution segment garnered a 68.3% share of the global market. Based on service type, the implementation & integration segment is predicted to garner swift growth. In 2022, the implementation & integration segment captured a 43.2% share of the global market.

Comparative View of the Adjacent Cloud ERP Market

Cloud ERP:

Attributes Cloud ERP
CAGR (2023 to 2033) 16.2%
Market Value (2023) US$ 72,679.4 million
Growth Factors
  • Demand is high, as it enhances financial operations and provides accurate financial data.
  • Big Data and analytics foster market growth.
  • Increasing emphasis on business efficiency.
Future Opportunities Great market potential, as cloud ERP, provides analytics-based solutions.
Market Trends Growing research and development expenditure to integrate cutting-edge digital solutions.

Cloud ELN Service Market:

Attributes Cloud ELN Service Market
CAGR (2023 to 2033) 13.7%
Market Value (2023) US$ 332.2 million
Growth Factors
  • Increasing automation and technological advancements in laboratory informatics solutions.
  • Rising adoption across pharmaceutical, research, and healthcare sectors.
  • Growing adoption by SMEs.
Future Opportunities New launches with embedded advanced and modern technologies.
Market Trends Escalating demand for smart devices, such as tablets, smartphones, wearable devices, etc.

Cloud-RAN Market:

Attributes Cloud-RAN Market
CAGR (2023 to 2033) 37.4%
Market Value (2023) US$ 7.36 billion
Growth Factors
  • Increasing deployment of 5G technology.
  • Growing pool of smartphone and internet users.
  • Rising technological developments in modern technologies, such as IoT, AR, VR, and others.
Future Opportunities Expanding electronics and telecommunication industries.
Market Trends Growing internet traffic.

The market is expected to reach a large value during the forecast period, owing to ongoing improvements in IoT and technology around the world. This opens up various opportunities in the market. The capacity to boost operational efficiency and streamline corporate processes, and the increased deployment of cloud-based solutions globally are the variables that contribute to the growth spectrum. A few other important drivers of the cloud ERP market growth are:

  • The demand for a high return on investment (ROI) and lower upfront costs
  • An increasing organizational requirement to improve staff productivity and efficiency

Rising government initiatives, technological developments, and the demand for cloud ERP technology in businesses around the world are expected to boost market growth further. Moreover, in the market, end customers are increasingly relying on cloud ERP as a business strategy for accelerating their growth. Cloud ERP is predicted to improve efficiency in the next few years, reducing infrastructure costs and allowing for faster adoption.

The research examines parent market trends, macroeconomic data, and controlling factors in depth, market opportunities, as well as market attractiveness by segment. The qualitative influence of key market parameters on market segments and regions, and their corresponding effects on the adoption of cloud ERP, is also mapped in the report.

Country-wise Insights

Which is the Leading Region in the Market?

North America is predicted to account for the dominant market size of US$ 99 million over the projection period due to the presence of economically and technologically advanced countries such as the United States and Canada, as well as new technologies. In 2022, North America captured 28.1% of the global market share. The United States accounted for an 18.2% share of the global market.

During the projected period, Asia-Pacific cloud-based ERP market is predicted to grow swiftly, followed by LAMEA. In Asia-Pacific, the demand for transparent and modernized manufacturing processes is projected to boost the expansion of cloud-based ERP software. India is anticipated to dominate growth in the Asia Pacific region.

The expanding telecommunication and electronics industries are expected to bolster growth in India. The surging digitalization and growing internet users are foreseen to bolster market growth in India. In 2022, India captured a 17.1% share of the global market. China is predicted to follow India, in terms of growth. In 2022, China captured a 15.4% share of the global market.

Countries CAGR Share in Global Market (2022)
The United States 18.2%
The United Kingdom 14.7%
China 15.4%
Japan 7.1%
India 17.1%

Competitive Landscape

How is the Competition Intensifying in the Market?

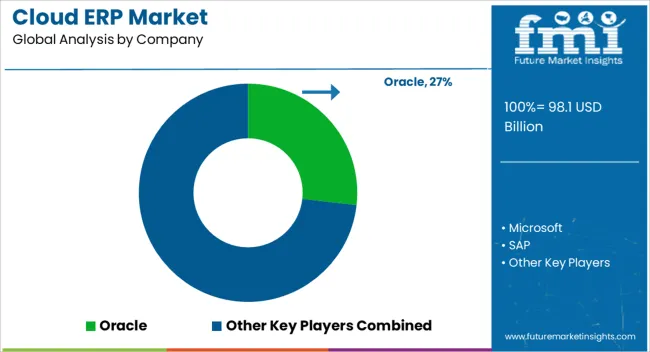
The market is extremely competitive due to several small and large players. The cloud ERP market is highly consolidated, with top firms employing techniques such as product innovation to stay ahead of the pack. As a result, many businesses are aggressively seeking out strategic mergers and acquisitions to expand their market dominance.

The strategic framework of key service providers is focused on generating high revenues to increase profitability.

Recent Developments Observed by FMI:

  • In April 2023, SAP introduced GROW with SAP for customers in India. GROW with SAP is a new service that aims to assist mid-sized clients in adopting cloud ERP that offers speed, predictability, and ongoing innovation.
  • In September 2022, Yonyou Network Technology launched Yonyou BIP in Bangkok and Thailand. Yonyou BIP is a next-gen cloud ERP product for overseas users.

Key Players Operating in the Global Market

  • Oracle
  • Microsoft
  • SAP
  • IFS
  • Infor

Scope of the Report

Attribute Details
Forecast Period 2023 to 2033
Historical Data Available for 2018 to 2022
Market Analysis US$ million for Value
Key Regions Covered
  • North America
  • Latin America
  • Europe
  • East Asia
  • South Asia
  • Oceania
  • The Middle East & Africa (MEA)
Key Countries Covered
  • The United States
  • Canada
  • Germany
  • The United Kingdom
  • Nordic
  • Russia
  • BENELUX
  • Poland
  • France
  • Spain
  • Italy
  • Czech Republic
  • Hungary
  • Rest of EMEAI
  • Brazil
  • Peru
  • Argentina
  • Mexico
  • South Africa
  • Northern Africa
  • GCC Countries
  • China
  • Japan
  • South Korea
  • India
  • ASIAN
  • Thailand
  • Malaysia
  • Indonesia
  • Australia
  • New Zealand
  • Others
Key Segments Covered
  • Component
  • Business Function Type
  • Service Type
  • Organizational Size
  • Application
  • Region
Report Coverage Market Forecast, Company Share Analysis, Competition Intelligence, Trend Analysis, Market Dynamics and Challenges, and Strategic Growth Initiatives

Key Segmentation - Cloud ERP Market

By Component:

  • Solution
  • Services

By Business Function Type:

  • Accounting and Finance
  • Sales and Marketing
  • Inventory and Order Management

By Service Type:

  • Implementation and Integration
  • Consulting
  • Support and Maintenance

By Organization Size:

  • Small & Medium Size Enterprises (SMEs)
  • Large Enterprises

By Application:

  • BFSI
  • Telcom
  • Healthcare & Life Sciences
  • Manufacturing
  • Government & Public Sector
  • Aerospace & Defense
  • Retail
  • Education
  • Others

By Region:

  • North America
  • Latin America
  • Europe
  • East Asia
  • South Asia
  • Oceania
  • The Middle East & Africa (MEA)

Frequently Asked Questions

What is the CAGR of the Cloud ERP Market?

The Cloud ERP market is projected to have a CAGR of 16.2% from 2023 to 2033.

Which is the Leading Region in the Cloud ERP Market?

North America is the leading region, with an anticipated CAGR of 16.2% by 2033.

Which Segment Leads in the Cloud ERP Market by Organizational Size?

Large Enterprises lead the market with a projected CAGR of 16.7% by 2033.

What is the Growth Estimated for the Cloud ERP Market by 2033?

The cloud ERP market is predicted to reach US$ 327,126.8 million by 2033.

Which Segment Leads in the Cloud ERP Market by Business Function Type?

Finance and accounting lead the market with the dominant share during the forecast period.

Table of Content

1. Executive Summary

    1.1. Global Market Outlook

    1.2. Demand-side Trends

    1.3. Supply-side Trends

    1.4. Technology Roadmap Analysis

    1.5. Analysis and Recommendations

2. Market Overview

    2.1. Market Coverage / Taxonomy

    2.2. Market Definition / Scope / Limitations

3. Market Background

    3.1. Market Dynamics

        3.1.1. Drivers

        3.1.2. Restraints

        3.1.3. Opportunity

        3.1.4. Trends

    3.2. Scenario Forecast

        3.2.1. Demand in Optimistic Scenario

        3.2.2. Demand in Likely Scenario

        3.2.3. Demand in Conservative Scenario

    3.3. Opportunity Map Analysis

    3.4. Investment Feasibility Matrix

    3.5. PESTLE and Porter’s Analysis

    3.6. Regulatory Landscape

        3.6.1. By Key Regions

        3.6.2. By Key Countries

    3.7. Regional Parent Market Outlook

4. Global Market Analysis 2018 to 2022 and Forecast, 2023 to 2033

    4.1. Historical Market Size Value (US$ Million) Analysis, 2018 to 2022

    4.2. Current and Future Market Size Value (US$ Million) Projections, 2023 to 2033

        4.2.1. Y-o-Y Growth Trend Analysis

        4.2.2. Absolute $ Opportunity Analysis

5. Global Market Analysis 2018 to 2022 and Forecast 2023 to 2033, By Component

    5.1. Introduction / Key Findings

    5.2. Historical Market Size Value (US$ Million) Analysis By Component, 2018 to 2022

    5.3. Current and Future Market Size Value (US$ Million) Analysis and Forecast By Component, 2023 to 2033

        5.3.1. Solution

        5.3.2. Services

    5.4. Y-o-Y Growth Trend Analysis By Component, 2018 to 2022

    5.5. Absolute $ Opportunity Analysis By Component, 2023 to 2033

6. Global Market Analysis 2018 to 2022 and Forecast 2023 to 2033, By Business Function Type

    6.1. Introduction / Key Findings

    6.2. Historical Market Size Value (US$ Million) Analysis By Business Function Type, 2018 to 2022

    6.3. Current and Future Market Size Value (US$ Million) Analysis and Forecast By Business Function Type, 2023 to 2033

        6.3.1. Accounting and Finance

        6.3.2. Sales and Marketing

        6.3.3. Inventory and Order Management

    6.4. Y-o-Y Growth Trend Analysis By Business Function Type, 2018 to 2022

    6.5. Absolute $ Opportunity Analysis By Business Function Type, 2023 to 2033

7. Global Market Analysis 2018 to 2022 and Forecast 2023 to 2033, By Service Type

    7.1. Introduction / Key Findings

    7.2. Historical Market Size Value (US$ Million) Analysis By Service Type , 2018 to 2022

    7.3. Current and Future Market Size Value (US$ Million) Analysis and Forecast By Service Type , 2023 to 2033

        7.3.1. Implementation & Integration

        7.3.2. Consulting

        7.3.3. Support and Maintenance

    7.4. Y-o-Y Growth Trend Analysis By Service Type , 2018 to 2022

    7.5. Absolute $ Opportunity Analysis By Service Type , 2023 to 2033

8. Global Market Analysis 2018 to 2022 and Forecast 2023 to 2033, By Organizational Size

    8.1. Introduction / Key Findings

    8.2. Historical Market Size Value (US$ Million) Analysis By Organizational Size, 2018 to 2022

    8.3. Current and Future Market Size Value (US$ Million) Analysis and Forecast By Organizational Size, 2023 to 2033

        8.3.1. Small & Medium SIzed Enterprise

        8.3.2. Large Enterprise

    8.4. Y-o-Y Growth Trend Analysis By Organizational Size, 2018 to 2022

    8.5. Absolute $ Opportunity Analysis By Organizational Size, 2023 to 2033

9. Global Market Analysis 2018 to 2022 and Forecast 2023 to 2033, By Application

    9.1. Introduction / Key Findings

    9.2. Historical Market Size Value (US$ Million) Analysis By Application, 2018 to 2022

    9.3. Current and Future Market Size Value (US$ Million) Analysis and Forecast By Application, 2023 to 2033

        9.3.1. BFSI

        9.3.2. Telecom

        9.3.3. Healthcare & Life Sciences

        9.3.4. Manufacturing

        9.3.5. Government & Public Sector

        9.3.6. Aerospace & Defense

        9.3.7. Retail

        9.3.8. Education

        9.3.9. Others

    9.4. Y-o-Y Growth Trend Analysis By Application, 2018 to 2022

    9.5. Absolute $ Opportunity Analysis By Application, 2023 to 2033

10. Global Market Analysis 2018 to 2022 and Forecast 2023 to 2033, By Region

    10.1. Introduction

    10.2. Historical Market Size Value (US$ Million) Analysis By Region, 2018 to 2022

    10.3. Current Market Size Value (US$ Million) Analysis and Forecast By Region, 2023 to 2033

        10.3.1. North America

        10.3.2. Latin America

        10.3.3. Europe

        10.3.4. South Asia

        10.3.5. East Asia

        10.3.6. Oceania

        10.3.7. MEA

    10.4. Market Attractiveness Analysis By Region

11. North America Market Analysis 2018 to 2022 and Forecast 2023 to 2033, By Country

    11.1. Historical Market Size Value (US$ Million) Trend Analysis By Market Taxonomy, 2018 to 2022

    11.2. Market Size Value (US$ Million) Forecast By Market Taxonomy, 2023 to 2033

        11.2.1. By Country

            11.2.1.1. The USA

            11.2.1.2. Canada

        11.2.2. By Component

        11.2.3. By Business Function Type

        11.2.4. By Service Type

        11.2.5. By Organizational Size

        11.2.6. By Application

    11.3. Market Attractiveness Analysis

        11.3.1. By Country

        11.3.2. By Component

        11.3.3. By Business Function Type

        11.3.4. By Service Type

        11.3.5. By Organizational Size

        11.3.6. By Application

    11.4. Key Takeaways

12. Latin America Market Analysis 2018 to 2022 and Forecast 2023 to 2033, By Country

    12.1. Historical Market Size Value (US$ Million) Trend Analysis By Market Taxonomy, 2018 to 2022

    12.2. Market Size Value (US$ Million) Forecast By Market Taxonomy, 2023 to 2033

        12.2.1. By Country

            12.2.1.1. Brazil

            12.2.1.2. Mexico

            12.2.1.3. Rest of Latin America

        12.2.2. By Component

        12.2.3. By Business Function Type

        12.2.4. By Service Type

        12.2.5. By Organizational Size

        12.2.6. By Application

    12.3. Market Attractiveness Analysis

        12.3.1. By Country

        12.3.2. By Component

        12.3.3. By Business Function Type

        12.3.4. By Service Type

        12.3.5. By Organizational Size

        12.3.6. By Application

    12.4. Key Takeaways

13. Europe Market Analysis 2018 to 2022 and Forecast 2023 to 2033, By Country

    13.1. Historical Market Size Value (US$ Million) Trend Analysis By Market Taxonomy, 2018 to 2022

    13.2. Market Size Value (US$ Million) Forecast By Market Taxonomy, 2023 to 2033

        13.2.1. By Country

            13.2.1.1. Germany

            13.2.1.2. United Kingdom

            13.2.1.3. France

            13.2.1.4. Spain

            13.2.1.5. Italy

            13.2.1.6. Rest of Europe

        13.2.2. By Component

        13.2.3. By Business Function Type

        13.2.4. By Service Type

        13.2.5. By Organizational Size

        13.2.6. By Application

    13.3. Market Attractiveness Analysis

        13.3.1. By Country

        13.3.2. By Component

        13.3.3. By Business Function Type

        13.3.4. By Service Type

        13.3.5. By Organizational Size

        13.3.6. By Application

    13.4. Key Takeaways

14. South Asia Market Analysis 2018 to 2022 and Forecast 2023 to 2033, By Country

    14.1. Historical Market Size Value (US$ Million) Trend Analysis By Market Taxonomy, 2018 to 2022

    14.2. Market Size Value (US$ Million) Forecast By Market Taxonomy, 2023 to 2033

        14.2.1. By Country

            14.2.1.1. India

            14.2.1.2. Malaysia

            14.2.1.3. Singapore

            14.2.1.4. Thailand

            14.2.1.5. Rest of South Asia

        14.2.2. By Component

        14.2.3. By Business Function Type

        14.2.4. By Service Type

        14.2.5. By Organizational Size

        14.2.6. By Application

    14.3. Market Attractiveness Analysis

        14.3.1. By Country

        14.3.2. By Component

        14.3.3. By Business Function Type

        14.3.4. By Service Type

        14.3.5. By Organizational Size

        14.3.6. By Application

    14.4. Key Takeaways

15. East Asia Market Analysis 2018 to 2022 and Forecast 2023 to 2033, By Country

    15.1. Historical Market Size Value (US$ Million) Trend Analysis By Market Taxonomy, 2018 to 2022

    15.2. Market Size Value (US$ Million) Forecast By Market Taxonomy, 2023 to 2033

        15.2.1. By Country

            15.2.1.1. China

            15.2.1.2. Japan

            15.2.1.3. South Korea

        15.2.2. By Component

        15.2.3. By Business Function Type

        15.2.4. By Service Type

        15.2.5. By Organizational Size

        15.2.6. By Application

    15.3. Market Attractiveness Analysis

        15.3.1. By Country

        15.3.2. By Component

        15.3.3. By Business Function Type

        15.3.4. By Service Type

        15.3.5. By Organizational Size

        15.3.6. By Application

    15.4. Key Takeaways

16. Oceania Market Analysis 2018 to 2022 and Forecast 2023 to 2033, By Country

    16.1. Historical Market Size Value (US$ Million) Trend Analysis By Market Taxonomy, 2018 to 2022

    16.2. Market Size Value (US$ Million) Forecast By Market Taxonomy, 2023 to 2033

        16.2.1. By Country

            16.2.1.1. Australia

            16.2.1.2. New Zealand

        16.2.2. By Component

        16.2.3. By Business Function Type

        16.2.4. By Service Type

        16.2.5. By Organizational Size

        16.2.6. By Application

    16.3. Market Attractiveness Analysis

        16.3.1. By Country

        16.3.2. By Component

        16.3.3. By Business Function Type

        16.3.4. By Service Type

        16.3.5. By Organizational Size

        16.3.6. By Application

    16.4. Key Takeaways

17. MEA Market Analysis 2018 to 2022 and Forecast 2023 to 2033, By Country

    17.1. Historical Market Size Value (US$ Million) Trend Analysis By Market Taxonomy, 2018 to 2022

    17.2. Market Size Value (US$ Million) Forecast By Market Taxonomy, 2023 to 2033

        17.2.1. By Country

            17.2.1.1. GCC Countries

            17.2.1.2. South Africa

            17.2.1.3. Israel

            17.2.1.4. Rest of MEA

        17.2.2. By Component

        17.2.3. By Business Function Type

        17.2.4. By Service Type

        17.2.5. By Organizational Size

        17.2.6. By Application

    17.3. Market Attractiveness Analysis

        17.3.1. By Country

        17.3.2. By Component

        17.3.3. By Business Function Type

        17.3.4. By Service Type

        17.3.5. By Organizational Size

        17.3.6. By Application

    17.4. Key Takeaways

18. Key Countries Market Analysis

    18.1. USA

        18.1.1. Pricing Analysis

        18.1.2. Market Share Analysis, 2022

            18.1.2.1. By Component

            18.1.2.2. By Business Function Type

            18.1.2.3. By Service Type

            18.1.2.4. By Organizational Size

            18.1.2.5. By Application

    18.2. Canada

        18.2.1. Pricing Analysis

        18.2.2. Market Share Analysis, 2022

            18.2.2.1. By Component

            18.2.2.2. By Business Function Type

            18.2.2.3. By Service Type

            18.2.2.4. By Organizational Size

            18.2.2.5. By Application

    18.3. Brazil

        18.3.1. Pricing Analysis

        18.3.2. Market Share Analysis, 2022

            18.3.2.1. By Component

            18.3.2.2. By Business Function Type

            18.3.2.3. By Service Type

            18.3.2.4. By Organizational Size

            18.3.2.5. By Application

    18.4. Mexico

        18.4.1. Pricing Analysis

        18.4.2. Market Share Analysis, 2022

            18.4.2.1. By Component

            18.4.2.2. By Business Function Type

            18.4.2.3. By Service Type

            18.4.2.4. By Organizational Size

            18.4.2.5. By Application

    18.5. Germany

        18.5.1. Pricing Analysis

        18.5.2. Market Share Analysis, 2022

            18.5.2.1. By Component

            18.5.2.2. By Business Function Type

            18.5.2.3. By Service Type

            18.5.2.4. By Organizational Size

            18.5.2.5. By Application

    18.6. United Kingdom

        18.6.1. Pricing Analysis

        18.6.2. Market Share Analysis, 2022

            18.6.2.1. By Component

            18.6.2.2. By Business Function Type

            18.6.2.3. By Service Type

            18.6.2.4. By Organizational Size

            18.6.2.5. By Application

    18.7. France

        18.7.1. Pricing Analysis

        18.7.2. Market Share Analysis, 2022

            18.7.2.1. By Component

            18.7.2.2. By Business Function Type

            18.7.2.3. By Service Type

            18.7.2.4. By Organizational Size

            18.7.2.5. By Application

    18.8. Spain

        18.8.1. Pricing Analysis

        18.8.2. Market Share Analysis, 2022

            18.8.2.1. By Component

            18.8.2.2. By Business Function Type

            18.8.2.3. By Service Type

            18.8.2.4. By Organizational Size

            18.8.2.5. By Application

    18.9. Italy

        18.9.1. Pricing Analysis

        18.9.2. Market Share Analysis, 2022

            18.9.2.1. By Component

            18.9.2.2. By Business Function Type

            18.9.2.3. By Service Type

            18.9.2.4. By Organizational Size

            18.9.2.5. By Application

    18.10. India

        18.10.1. Pricing Analysis

        18.10.2. Market Share Analysis, 2022

            18.10.2.1. By Component

            18.10.2.2. By Business Function Type

            18.10.2.3. By Service Type

            18.10.2.4. By Organizational Size

            18.10.2.5. By Application

    18.11. Malaysia

        18.11.1. Pricing Analysis

        18.11.2. Market Share Analysis, 2022

            18.11.2.1. By Component

            18.11.2.2. By Business Function Type

            18.11.2.3. By Service Type

            18.11.2.4. By Organizational Size

            18.11.2.5. By Application

    18.12. Singapore

        18.12.1. Pricing Analysis

        18.12.2. Market Share Analysis, 2022

            18.12.2.1. By Component

            18.12.2.2. By Business Function Type

            18.12.2.3. By Service Type

            18.12.2.4. By Organizational Size

            18.12.2.5. By Application

    18.13. Thailand

        18.13.1. Pricing Analysis

        18.13.2. Market Share Analysis, 2022

            18.13.2.1. By Component

            18.13.2.2. By Business Function Type

            18.13.2.3. By Service Type

            18.13.2.4. By Organizational Size

            18.13.2.5. By Application

    18.14. China

        18.14.1. Pricing Analysis

        18.14.2. Market Share Analysis, 2022

            18.14.2.1. By Component

            18.14.2.2. By Business Function Type

            18.14.2.3. By Service Type

            18.14.2.4. By Organizational Size

            18.14.2.5. By Application

    18.15. Japan

        18.15.1. Pricing Analysis

        18.15.2. Market Share Analysis, 2022

            18.15.2.1. By Component

            18.15.2.2. By Business Function Type

            18.15.2.3. By Service Type

            18.15.2.4. By Organizational Size

            18.15.2.5. By Application

    18.16. South Korea

        18.16.1. Pricing Analysis

        18.16.2. Market Share Analysis, 2022

            18.16.2.1. By Component

            18.16.2.2. By Business Function Type

            18.16.2.3. By Service Type

            18.16.2.4. By Organizational Size

            18.16.2.5. By Application

    18.17. Australia

        18.17.1. Pricing Analysis

        18.17.2. Market Share Analysis, 2022

            18.17.2.1. By Component

            18.17.2.2. By Business Function Type

            18.17.2.3. By Service Type

            18.17.2.4. By Organizational Size

            18.17.2.5. By Application

    18.18. New Zealand

        18.18.1. Pricing Analysis

        18.18.2. Market Share Analysis, 2022

            18.18.2.1. By Component

            18.18.2.2. By Business Function Type

            18.18.2.3. By Service Type

            18.18.2.4. By Organizational Size

            18.18.2.5. By Application

    18.19. GCC Countries

        18.19.1. Pricing Analysis

        18.19.2. Market Share Analysis, 2022

            18.19.2.1. By Component

            18.19.2.2. By Business Function Type

            18.19.2.3. By Service Type

            18.19.2.4. By Organizational Size

            18.19.2.5. By Application

    18.20. South Africa

        18.20.1. Pricing Analysis

        18.20.2. Market Share Analysis, 2022

            18.20.2.1. By Component

            18.20.2.2. By Business Function Type

            18.20.2.3. By Service Type

            18.20.2.4. By Organizational Size

            18.20.2.5. By Application

    18.21. Israel

        18.21.1. Pricing Analysis

        18.21.2. Market Share Analysis, 2022

            18.21.2.1. By Component

            18.21.2.2. By Business Function Type

            18.21.2.3. By Service Type

            18.21.2.4. By Organizational Size

            18.21.2.5. By Application

19. Market Structure Analysis

    19.1. Competition Dashboard

    19.2. Competition Benchmarking

    19.3. Market Share Analysis of Top Players

        19.3.1. By Regional

        19.3.2. By Component

        19.3.3. By Business Function Type

        19.3.4. By Service Type

        19.3.5. By Organizational Size

        19.3.6. By Application

20. Competition Analysis

    20.1. Competition Deep Dive

        20.1.1. Oracle

            20.1.1.1. Overview

            20.1.1.2. Product Portfolio

            20.1.1.3. Profitability by Market Segments

            20.1.1.4. Sales Footprint

            20.1.1.5. Strategy Overview

                20.1.1.5.1. Marketing Strategy

        20.1.2. Microsoft

            20.1.2.1. Overview

            20.1.2.2. Product Portfolio

            20.1.2.3. Profitability by Market Segments

            20.1.2.4. Sales Footprint

            20.1.2.5. Strategy Overview

                20.1.2.5.1. Marketing Strategy

        20.1.3. SAP

            20.1.3.1. Overview

            20.1.3.2. Product Portfolio

            20.1.3.3. Profitability by Market Segments

            20.1.3.4. Sales Footprint

            20.1.3.5. Strategy Overview

                20.1.3.5.1. Marketing Strategy

        20.1.4. IFS

            20.1.4.1. Overview

            20.1.4.2. Product Portfolio

            20.1.4.3. Profitability by Market Segments

            20.1.4.4. Sales Footprint

            20.1.4.5. Strategy Overview

                20.1.4.5.1. Marketing Strategy

        20.1.5. Infor

            20.1.5.1. Overview

            20.1.5.2. Product Portfolio

            20.1.5.3. Profitability by Market Segments

            20.1.5.4. Sales Footprint

            20.1.5.5. Strategy Overview

                20.1.5.5.1. Marketing Strategy

        20.1.6. Workday

            20.1.6.1. Overview

            20.1.6.2. Product Portfolio

            20.1.6.3. Profitability by Market Segments

            20.1.6.4. Sales Footprint

            20.1.6.5. Strategy Overview

                20.1.6.5.1. Marketing Strategy

        20.1.7. Sage

            20.1.7.1. Overview

            20.1.7.2. Product Portfolio

            20.1.7.3. Profitability by Market Segments

            20.1.7.4. Sales Footprint

            20.1.7.5. Strategy Overview

                20.1.7.5.1. Marketing Strategy

        20.1.8. Plex Systems

            20.1.8.1. Overview

            20.1.8.2. Product Portfolio

            20.1.8.3. Profitability by Market Segments

            20.1.8.4. Sales Footprint

            20.1.8.5. Strategy Overview

                20.1.8.5.1. Marketing Strategy

        20.1.9. Acumatica

            20.1.9.1. Overview

            20.1.9.2. Product Portfolio

            20.1.9.3. Profitability by Market Segments

            20.1.9.4. Sales Footprint

            20.1.9.5. Strategy Overview

                20.1.9.5.1. Marketing Strategy

        20.1.10. Epicor Software

            20.1.10.1. Overview

            20.1.10.2. Product Portfolio

            20.1.10.3. Profitability by Market Segments

            20.1.10.4. Sales Footprint

            20.1.10.5. Strategy Overview

                20.1.10.5.1. Marketing Strategy

21. Assumptions & Acronyms Used

22. Research Methodology

Don't pay for what you don't need

Customize your report by selecting specific countries or regions and save 30%!

List of Tables

Table 1: Global Market Value (US$ Million) Forecast by Region, 2018 to 2033

Table 2: Global Market Value (US$ Million) Forecast by Component, 2018 to 2033

Table 3: Global Market Value (US$ Million) Forecast by Business Function Type, 2018 to 2033

Table 4: Global Market Value (US$ Million) Forecast by Service Type , 2018 to 2033

Table 5: Global Market Value (US$ Million) Forecast by Organizational Size, 2018 to 2033

Table 6: Global Market Value (US$ Million) Forecast by Application, 2018 to 2033

Table 7: North America Market Value (US$ Million) Forecast by Country, 2018 to 2033

Table 8: North America Market Value (US$ Million) Forecast by Component, 2018 to 2033

Table 9: North America Market Value (US$ Million) Forecast by Business Function Type, 2018 to 2033

Table 10: North America Market Value (US$ Million) Forecast by Service Type , 2018 to 2033

Table 11: North America Market Value (US$ Million) Forecast by Organizational Size, 2018 to 2033

Table 12: North America Market Value (US$ Million) Forecast by Application, 2018 to 2033

Table 13: Latin America Market Value (US$ Million) Forecast by Country, 2018 to 2033

Table 14: Latin America Market Value (US$ Million) Forecast by Component, 2018 to 2033

Table 15: Latin America Market Value (US$ Million) Forecast by Business Function Type, 2018 to 2033

Table 16: Latin America Market Value (US$ Million) Forecast by Service Type , 2018 to 2033

Table 17: Latin America Market Value (US$ Million) Forecast by Organizational Size, 2018 to 2033

Table 18: Latin America Market Value (US$ Million) Forecast by Application, 2018 to 2033

Table 19: Europe Market Value (US$ Million) Forecast by Country, 2018 to 2033

Table 20: Europe Market Value (US$ Million) Forecast by Component, 2018 to 2033

Table 21: Europe Market Value (US$ Million) Forecast by Business Function Type, 2018 to 2033

Table 22: Europe Market Value (US$ Million) Forecast by Service Type , 2018 to 2033

Table 23: Europe Market Value (US$ Million) Forecast by Organizational Size, 2018 to 2033

Table 24: Europe Market Value (US$ Million) Forecast by Application, 2018 to 2033

Table 25: South Asia Market Value (US$ Million) Forecast by Country, 2018 to 2033

Table 26: South Asia Market Value (US$ Million) Forecast by Component, 2018 to 2033

Table 27: South Asia Market Value (US$ Million) Forecast by Business Function Type, 2018 to 2033

Table 28: South Asia Market Value (US$ Million) Forecast by Service Type , 2018 to 2033

Table 29: South Asia Market Value (US$ Million) Forecast by Organizational Size, 2018 to 2033

Table 30: South Asia Market Value (US$ Million) Forecast by Application, 2018 to 2033

Table 31: East Asia Market Value (US$ Million) Forecast by Country, 2018 to 2033

Table 32: East Asia Market Value (US$ Million) Forecast by Component, 2018 to 2033

Table 33: East Asia Market Value (US$ Million) Forecast by Business Function Type, 2018 to 2033

Table 34: East Asia Market Value (US$ Million) Forecast by Service Type , 2018 to 2033

Table 35: East Asia Market Value (US$ Million) Forecast by Organizational Size, 2018 to 2033

Table 36: East Asia Market Value (US$ Million) Forecast by Application, 2018 to 2033

Table 37: Oceania Market Value (US$ Million) Forecast by Country, 2018 to 2033

Table 38: Oceania Market Value (US$ Million) Forecast by Component, 2018 to 2033

Table 39: Oceania Market Value (US$ Million) Forecast by Business Function Type, 2018 to 2033

Table 40: Oceania Market Value (US$ Million) Forecast by Service Type , 2018 to 2033

Table 41: Oceania Market Value (US$ Million) Forecast by Organizational Size, 2018 to 2033

Table 42: Oceania Market Value (US$ Million) Forecast by Application, 2018 to 2033

Table 43: MEA Market Value (US$ Million) Forecast by Country, 2018 to 2033

Table 44: MEA Market Value (US$ Million) Forecast by Component, 2018 to 2033

Table 45: MEA Market Value (US$ Million) Forecast by Business Function Type, 2018 to 2033

Table 46: MEA Market Value (US$ Million) Forecast by Service Type , 2018 to 2033

Table 47: MEA Market Value (US$ Million) Forecast by Organizational Size, 2018 to 2033

Table 48: MEA Market Value (US$ Million) Forecast by Application, 2018 to 2033
Sudip Saha
Sudip Saha

Principal Consultant

Talk to Analyst

Find your sweet spots for generating winning opportunities in this market.

List of Charts

Figure 1: Global Market Value (US$ Million) by Component, 2023 to 2033

Figure 2: Global Market Value (US$ Million) by Business Function Type, 2023 to 2033

Figure 3: Global Market Value (US$ Million) by Service Type , 2023 to 2033

Figure 4: Global Market Value (US$ Million) by Organizational Size, 2023 to 2033

Figure 5: Global Market Value (US$ Million) by Application, 2023 to 2033

Figure 6: Global Market Value (US$ Million) by Region, 2023 to 2033

Figure 7: Global Market Value (US$ Million) Analysis by Region, 2018 to 2033

Figure 8: Global Market Value Share (%) and BPS Analysis by Region, 2023 to 2033

Figure 9: Global Market Y-o-Y Growth (%) Projections by Region, 2023 to 2033

Figure 10: Global Market Value (US$ Million) Analysis by Component, 2018 to 2033

Figure 11: Global Market Value Share (%) and BPS Analysis by Component, 2023 to 2033

Figure 12: Global Market Y-o-Y Growth (%) Projections by Component, 2023 to 2033

Figure 13: Global Market Value (US$ Million) Analysis by Business Function Type, 2018 to 2033

Figure 14: Global Market Value Share (%) and BPS Analysis by Business Function Type, 2023 to 2033

Figure 15: Global Market Y-o-Y Growth (%) Projections by Business Function Type, 2023 to 2033

Figure 16: Global Market Value (US$ Million) Analysis by Service Type , 2018 to 2033

Figure 17: Global Market Value Share (%) and BPS Analysis by Service Type , 2023 to 2033

Figure 18: Global Market Y-o-Y Growth (%) Projections by Service Type , 2023 to 2033

Figure 19: Global Market Value (US$ Million) Analysis by Organizational Size, 2018 to 2033

Figure 20: Global Market Value Share (%) and BPS Analysis by Organizational Size, 2023 to 2033

Figure 21: Global Market Y-o-Y Growth (%) Projections by Organizational Size, 2023 to 2033

Figure 22: Global Market Value (US$ Million) Analysis by Application, 2018 to 2033

Figure 23: Global Market Value Share (%) and BPS Analysis by Application, 2023 to 2033

Figure 24: Global Market Y-o-Y Growth (%) Projections by Application, 2023 to 2033

Figure 25: Global Market Attractiveness by Component, 2023 to 2033

Figure 26: Global Market Attractiveness by Business Function Type, 2023 to 2033

Figure 27: Global Market Attractiveness by Service Type , 2023 to 2033

Figure 28: Global Market Attractiveness by Organizational Size, 2023 to 2033

Figure 29: Global Market Attractiveness by Application, 2023 to 2033

Figure 30: Global Market Attractiveness by Region, 2023 to 2033

Figure 31: North America Market Value (US$ Million) by Component, 2023 to 2033

Figure 32: North America Market Value (US$ Million) by Business Function Type, 2023 to 2033

Figure 33: North America Market Value (US$ Million) by Service Type , 2023 to 2033

Figure 34: North America Market Value (US$ Million) by Organizational Size, 2023 to 2033

Figure 35: North America Market Value (US$ Million) by Application, 2023 to 2033

Figure 36: North America Market Value (US$ Million) by Country, 2023 to 2033

Figure 37: North America Market Value (US$ Million) Analysis by Country, 2018 to 2033

Figure 38: North America Market Value Share (%) and BPS Analysis by Country, 2023 to 2033

Figure 39: North America Market Y-o-Y Growth (%) Projections by Country, 2023 to 2033

Figure 40: North America Market Value (US$ Million) Analysis by Component, 2018 to 2033

Figure 41: North America Market Value Share (%) and BPS Analysis by Component, 2023 to 2033

Figure 42: North America Market Y-o-Y Growth (%) Projections by Component, 2023 to 2033

Figure 43: North America Market Value (US$ Million) Analysis by Business Function Type, 2018 to 2033

Figure 44: North America Market Value Share (%) and BPS Analysis by Business Function Type, 2023 to 2033

Figure 45: North America Market Y-o-Y Growth (%) Projections by Business Function Type, 2023 to 2033

Figure 46: North America Market Value (US$ Million) Analysis by Service Type , 2018 to 2033

Figure 47: North America Market Value Share (%) and BPS Analysis by Service Type , 2023 to 2033

Figure 48: North America Market Y-o-Y Growth (%) Projections by Service Type , 2023 to 2033

Figure 49: North America Market Value (US$ Million) Analysis by Organizational Size, 2018 to 2033

Figure 50: North America Market Value Share (%) and BPS Analysis by Organizational Size, 2023 to 2033

Figure 51: North America Market Y-o-Y Growth (%) Projections by Organizational Size, 2023 to 2033

Figure 52: North America Market Value (US$ Million) Analysis by Application, 2018 to 2033

Figure 53: North America Market Value Share (%) and BPS Analysis by Application, 2023 to 2033

Figure 54: North America Market Y-o-Y Growth (%) Projections by Application, 2023 to 2033

Figure 55: North America Market Attractiveness by Component, 2023 to 2033

Figure 56: North America Market Attractiveness by Business Function Type, 2023 to 2033

Figure 57: North America Market Attractiveness by Service Type , 2023 to 2033

Figure 58: North America Market Attractiveness by Organizational Size, 2023 to 2033

Figure 59: North America Market Attractiveness by Application, 2023 to 2033

Figure 60: North America Market Attractiveness by Country, 2023 to 2033

Figure 61: Latin America Market Value (US$ Million) by Component, 2023 to 2033

Figure 62: Latin America Market Value (US$ Million) by Business Function Type, 2023 to 2033

Figure 63: Latin America Market Value (US$ Million) by Service Type , 2023 to 2033

Figure 64: Latin America Market Value (US$ Million) by Organizational Size, 2023 to 2033

Figure 65: Latin America Market Value (US$ Million) by Application, 2023 to 2033

Figure 66: Latin America Market Value (US$ Million) by Country, 2023 to 2033

Figure 67: Latin America Market Value (US$ Million) Analysis by Country, 2018 to 2033

Figure 68: Latin America Market Value Share (%) and BPS Analysis by Country, 2023 to 2033

Figure 69: Latin America Market Y-o-Y Growth (%) Projections by Country, 2023 to 2033

Figure 70: Latin America Market Value (US$ Million) Analysis by Component, 2018 to 2033

Figure 71: Latin America Market Value Share (%) and BPS Analysis by Component, 2023 to 2033

Figure 72: Latin America Market Y-o-Y Growth (%) Projections by Component, 2023 to 2033

Figure 73: Latin America Market Value (US$ Million) Analysis by Business Function Type, 2018 to 2033

Figure 74: Latin America Market Value Share (%) and BPS Analysis by Business Function Type, 2023 to 2033

Figure 75: Latin America Market Y-o-Y Growth (%) Projections by Business Function Type, 2023 to 2033

Figure 76: Latin America Market Value (US$ Million) Analysis by Service Type , 2018 to 2033

Figure 77: Latin America Market Value Share (%) and BPS Analysis by Service Type , 2023 to 2033

Figure 78: Latin America Market Y-o-Y Growth (%) Projections by Service Type , 2023 to 2033

Figure 79: Latin America Market Value (US$ Million) Analysis by Organizational Size, 2018 to 2033

Figure 80: Latin America Market Value Share (%) and BPS Analysis by Organizational Size, 2023 to 2033

Figure 81: Latin America Market Y-o-Y Growth (%) Projections by Organizational Size, 2023 to 2033

Figure 82: Latin America Market Value (US$ Million) Analysis by Application, 2018 to 2033

Figure 83: Latin America Market Value Share (%) and BPS Analysis by Application, 2023 to 2033

Figure 84: Latin America Market Y-o-Y Growth (%) Projections by Application, 2023 to 2033

Figure 85: Latin America Market Attractiveness by Component, 2023 to 2033

Figure 86: Latin America Market Attractiveness by Business Function Type, 2023 to 2033

Figure 87: Latin America Market Attractiveness by Service Type , 2023 to 2033

Figure 88: Latin America Market Attractiveness by Organizational Size, 2023 to 2033

Figure 89: Latin America Market Attractiveness by Application, 2023 to 2033

Figure 90: Latin America Market Attractiveness by Country, 2023 to 2033

Figure 91: Europe Market Value (US$ Million) by Component, 2023 to 2033

Figure 92: Europe Market Value (US$ Million) by Business Function Type, 2023 to 2033

Figure 93: Europe Market Value (US$ Million) by Service Type , 2023 to 2033

Figure 94: Europe Market Value (US$ Million) by Organizational Size, 2023 to 2033

Figure 95: Europe Market Value (US$ Million) by Application, 2023 to 2033

Figure 96: Europe Market Value (US$ Million) by Country, 2023 to 2033

Figure 97: Europe Market Value (US$ Million) Analysis by Country, 2018 to 2033

Figure 98: Europe Market Value Share (%) and BPS Analysis by Country, 2023 to 2033

Figure 99: Europe Market Y-o-Y Growth (%) Projections by Country, 2023 to 2033

Figure 100: Europe Market Value (US$ Million) Analysis by Component, 2018 to 2033

Figure 101: Europe Market Value Share (%) and BPS Analysis by Component, 2023 to 2033

Figure 102: Europe Market Y-o-Y Growth (%) Projections by Component, 2023 to 2033

Figure 103: Europe Market Value (US$ Million) Analysis by Business Function Type, 2018 to 2033

Figure 104: Europe Market Value Share (%) and BPS Analysis by Business Function Type, 2023 to 2033

Figure 105: Europe Market Y-o-Y Growth (%) Projections by Business Function Type, 2023 to 2033

Figure 106: Europe Market Value (US$ Million) Analysis by Service Type , 2018 to 2033

Figure 107: Europe Market Value Share (%) and BPS Analysis by Service Type , 2023 to 2033

Figure 108: Europe Market Y-o-Y Growth (%) Projections by Service Type , 2023 to 2033

Figure 109: Europe Market Value (US$ Million) Analysis by Organizational Size, 2018 to 2033

Figure 110: Europe Market Value Share (%) and BPS Analysis by Organizational Size, 2023 to 2033

Figure 111: Europe Market Y-o-Y Growth (%) Projections by Organizational Size, 2023 to 2033

Figure 112: Europe Market Value (US$ Million) Analysis by Application, 2018 to 2033

Figure 113: Europe Market Value Share (%) and BPS Analysis by Application, 2023 to 2033

Figure 114: Europe Market Y-o-Y Growth (%) Projections by Application, 2023 to 2033

Figure 115: Europe Market Attractiveness by Component, 2023 to 2033

Figure 116: Europe Market Attractiveness by Business Function Type, 2023 to 2033

Figure 117: Europe Market Attractiveness by Service Type , 2023 to 2033

Figure 118: Europe Market Attractiveness by Organizational Size, 2023 to 2033

Figure 119: Europe Market Attractiveness by Application, 2023 to 2033

Figure 120: Europe Market Attractiveness by Country, 2023 to 2033

Figure 121: South Asia Market Value (US$ Million) by Component, 2023 to 2033

Figure 122: South Asia Market Value (US$ Million) by Business Function Type, 2023 to 2033

Figure 123: South Asia Market Value (US$ Million) by Service Type , 2023 to 2033

Figure 124: South Asia Market Value (US$ Million) by Organizational Size, 2023 to 2033

Figure 125: South Asia Market Value (US$ Million) by Application, 2023 to 2033

Figure 126: South Asia Market Value (US$ Million) by Country, 2023 to 2033

Figure 127: South Asia Market Value (US$ Million) Analysis by Country, 2018 to 2033

Figure 128: South Asia Market Value Share (%) and BPS Analysis by Country, 2023 to 2033

Figure 129: South Asia Market Y-o-Y Growth (%) Projections by Country, 2023 to 2033

Figure 130: South Asia Market Value (US$ Million) Analysis by Component, 2018 to 2033

Figure 131: South Asia Market Value Share (%) and BPS Analysis by Component, 2023 to 2033

Figure 132: South Asia Market Y-o-Y Growth (%) Projections by Component, 2023 to 2033

Figure 133: South Asia Market Value (US$ Million) Analysis by Business Function Type, 2018 to 2033

Figure 134: South Asia Market Value Share (%) and BPS Analysis by Business Function Type, 2023 to 2033

Figure 135: South Asia Market Y-o-Y Growth (%) Projections by Business Function Type, 2023 to 2033

Figure 136: South Asia Market Value (US$ Million) Analysis by Service Type , 2018 to 2033

Figure 137: South Asia Market Value Share (%) and BPS Analysis by Service Type , 2023 to 2033

Figure 138: South Asia Market Y-o-Y Growth (%) Projections by Service Type , 2023 to 2033

Figure 139: South Asia Market Value (US$ Million) Analysis by Organizational Size, 2018 to 2033

Figure 140: South Asia Market Value Share (%) and BPS Analysis by Organizational Size, 2023 to 2033

Figure 141: South Asia Market Y-o-Y Growth (%) Projections by Organizational Size, 2023 to 2033

Figure 142: South Asia Market Value (US$ Million) Analysis by Application, 2018 to 2033

Figure 143: South Asia Market Value Share (%) and BPS Analysis by Application, 2023 to 2033

Figure 144: South Asia Market Y-o-Y Growth (%) Projections by Application, 2023 to 2033

Figure 145: South Asia Market Attractiveness by Component, 2023 to 2033

Figure 146: South Asia Market Attractiveness by Business Function Type, 2023 to 2033

Figure 147: South Asia Market Attractiveness by Service Type , 2023 to 2033

Figure 148: South Asia Market Attractiveness by Organizational Size, 2023 to 2033

Figure 149: South Asia Market Attractiveness by Application, 2023 to 2033

Figure 150: South Asia Market Attractiveness by Country, 2023 to 2033

Figure 151: East Asia Market Value (US$ Million) by Component, 2023 to 2033

Figure 152: East Asia Market Value (US$ Million) by Business Function Type, 2023 to 2033

Figure 153: East Asia Market Value (US$ Million) by Service Type , 2023 to 2033

Figure 154: East Asia Market Value (US$ Million) by Organizational Size, 2023 to 2033

Figure 155: East Asia Market Value (US$ Million) by Application, 2023 to 2033

Figure 156: East Asia Market Value (US$ Million) by Country, 2023 to 2033

Figure 157: East Asia Market Value (US$ Million) Analysis by Country, 2018 to 2033

Figure 158: East Asia Market Value Share (%) and BPS Analysis by Country, 2023 to 2033

Figure 159: East Asia Market Y-o-Y Growth (%) Projections by Country, 2023 to 2033

Figure 160: East Asia Market Value (US$ Million) Analysis by Component, 2018 to 2033

Figure 161: East Asia Market Value Share (%) and BPS Analysis by Component, 2023 to 2033

Figure 162: East Asia Market Y-o-Y Growth (%) Projections by Component, 2023 to 2033

Figure 163: East Asia Market Value (US$ Million) Analysis by Business Function Type, 2018 to 2033

Figure 164: East Asia Market Value Share (%) and BPS Analysis by Business Function Type, 2023 to 2033

Figure 165: East Asia Market Y-o-Y Growth (%) Projections by Business Function Type, 2023 to 2033

Figure 166: East Asia Market Value (US$ Million) Analysis by Service Type , 2018 to 2033

Figure 167: East Asia Market Value Share (%) and BPS Analysis by Service Type , 2023 to 2033

Figure 168: East Asia Market Y-o-Y Growth (%) Projections by Service Type , 2023 to 2033

Figure 169: East Asia Market Value (US$ Million) Analysis by Organizational Size, 2018 to 2033

Figure 170: East Asia Market Value Share (%) and BPS Analysis by Organizational Size, 2023 to 2033

Figure 171: East Asia Market Y-o-Y Growth (%) Projections by Organizational Size, 2023 to 2033

Figure 172: East Asia Market Value (US$ Million) Analysis by Application, 2018 to 2033

Figure 173: East Asia Market Value Share (%) and BPS Analysis by Application, 2023 to 2033

Figure 174: East Asia Market Y-o-Y Growth (%) Projections by Application, 2023 to 2033

Figure 175: East Asia Market Attractiveness by Component, 2023 to 2033

Figure 176: East Asia Market Attractiveness by Business Function Type, 2023 to 2033

Figure 177: East Asia Market Attractiveness by Service Type , 2023 to 2033

Figure 178: East Asia Market Attractiveness by Organizational Size, 2023 to 2033

Figure 179: East Asia Market Attractiveness by Application, 2023 to 2033

Figure 180: East Asia Market Attractiveness by Country, 2023 to 2033

Figure 181: Oceania Market Value (US$ Million) by Component, 2023 to 2033

Figure 182: Oceania Market Value (US$ Million) by Business Function Type, 2023 to 2033

Figure 183: Oceania Market Value (US$ Million) by Service Type , 2023 to 2033

Figure 184: Oceania Market Value (US$ Million) by Organizational Size, 2023 to 2033

Figure 185: Oceania Market Value (US$ Million) by Application, 2023 to 2033

Figure 186: Oceania Market Value (US$ Million) by Country, 2023 to 2033

Figure 187: Oceania Market Value (US$ Million) Analysis by Country, 2018 to 2033

Figure 188: Oceania Market Value Share (%) and BPS Analysis by Country, 2023 to 2033

Figure 189: Oceania Market Y-o-Y Growth (%) Projections by Country, 2023 to 2033

Figure 190: Oceania Market Value (US$ Million) Analysis by Component, 2018 to 2033

Figure 191: Oceania Market Value Share (%) and BPS Analysis by Component, 2023 to 2033

Figure 192: Oceania Market Y-o-Y Growth (%) Projections by Component, 2023 to 2033

Figure 193: Oceania Market Value (US$ Million) Analysis by Business Function Type, 2018 to 2033

Figure 194: Oceania Market Value Share (%) and BPS Analysis by Business Function Type, 2023 to 2033

Figure 195: Oceania Market Y-o-Y Growth (%) Projections by Business Function Type, 2023 to 2033

Figure 196: Oceania Market Value (US$ Million) Analysis by Service Type , 2018 to 2033

Figure 197: Oceania Market Value Share (%) and BPS Analysis by Service Type , 2023 to 2033

Figure 198: Oceania Market Y-o-Y Growth (%) Projections by Service Type , 2023 to 2033

Figure 199: Oceania Market Value (US$ Million) Analysis by Organizational Size, 2018 to 2033

Figure 200: Oceania Market Value Share (%) and BPS Analysis by Organizational Size, 2023 to 2033

Figure 201: Oceania Market Y-o-Y Growth (%) Projections by Organizational Size, 2023 to 2033

Figure 202: Oceania Market Value (US$ Million) Analysis by Application, 2018 to 2033

Figure 203: Oceania Market Value Share (%) and BPS Analysis by Application, 2023 to 2033

Figure 204: Oceania Market Y-o-Y Growth (%) Projections by Application, 2023 to 2033

Figure 205: Oceania Market Attractiveness by Component, 2023 to 2033

Figure 206: Oceania Market Attractiveness by Business Function Type, 2023 to 2033

Figure 207: Oceania Market Attractiveness by Service Type , 2023 to 2033

Figure 208: Oceania Market Attractiveness by Organizational Size, 2023 to 2033

Figure 209: Oceania Market Attractiveness by Application, 2023 to 2033

Figure 210: Oceania Market Attractiveness by Country, 2023 to 2033

Figure 211: MEA Market Value (US$ Million) by Component, 2023 to 2033

Figure 212: MEA Market Value (US$ Million) by Business Function Type, 2023 to 2033

Figure 213: MEA Market Value (US$ Million) by Service Type , 2023 to 2033

Figure 214: MEA Market Value (US$ Million) by Organizational Size, 2023 to 2033

Figure 215: MEA Market Value (US$ Million) by Application, 2023 to 2033

Figure 216: MEA Market Value (US$ Million) by Country, 2023 to 2033

Figure 217: MEA Market Value (US$ Million) Analysis by Country, 2018 to 2033

Figure 218: MEA Market Value Share (%) and BPS Analysis by Country, 2023 to 2033

Figure 219: MEA Market Y-o-Y Growth (%) Projections by Country, 2023 to 2033

Figure 220: MEA Market Value (US$ Million) Analysis by Component, 2018 to 2033

Figure 221: MEA Market Value Share (%) and BPS Analysis by Component, 2023 to 2033

Figure 222: MEA Market Y-o-Y Growth (%) Projections by Component, 2023 to 2033

Figure 223: MEA Market Value (US$ Million) Analysis by Business Function Type, 2018 to 2033

Figure 224: MEA Market Value Share (%) and BPS Analysis by Business Function Type, 2023 to 2033

Figure 225: MEA Market Y-o-Y Growth (%) Projections by Business Function Type, 2023 to 2033

Figure 226: MEA Market Value (US$ Million) Analysis by Service Type , 2018 to 2033

Figure 227: MEA Market Value Share (%) and BPS Analysis by Service Type , 2023 to 2033

Figure 228: MEA Market Y-o-Y Growth (%) Projections by Service Type , 2023 to 2033

Figure 229: MEA Market Value (US$ Million) Analysis by Organizational Size, 2018 to 2033

Figure 230: MEA Market Value Share (%) and BPS Analysis by Organizational Size, 2023 to 2033

Figure 231: MEA Market Y-o-Y Growth (%) Projections by Organizational Size, 2023 to 2033

Figure 232: MEA Market Value (US$ Million) Analysis by Application, 2018 to 2033

Figure 233: MEA Market Value Share (%) and BPS Analysis by Application, 2023 to 2033

Figure 234: MEA Market Y-o-Y Growth (%) Projections by Application, 2023 to 2033

Figure 235: MEA Market Attractiveness by Component, 2023 to 2033

Figure 236: MEA Market Attractiveness by Business Function Type, 2023 to 2033

Figure 237: MEA Market Attractiveness by Service Type , 2023 to 2033

Figure 238: MEA Market Attractiveness by Organizational Size, 2023 to 2033

Figure 239: MEA Market Attractiveness by Application, 2023 to 2033

Figure 240: MEA Market Attractiveness by Country, 2023 to 2033

Recommendations

Technology

Cloud ELN Service Market

Published : May 2023

Technology

Cloud-RAN (Radio Access Network) Market

Published : September 2022

Explore Technology Insights

View Reports