The temporary storage building market, valued at USD 3,115.0 million in 2025, is estimated to reach USD 5,631.3 million by 2035, growing at a CAGR of 6.1%. The long-term value accumulation curve indicates a steady upward trend driven by rising demand for flexible and cost-effective storage solutions across industrial, commercial, and logistics sectors. In the early years, growth will be supported by expanding manufacturing activities, increased warehousing needs, and construction projects requiring on-site material storage. Businesses are increasingly opting for modular structures that can be deployed quickly and relocated easily, aligning with changing operational requirements.
As the market progresses toward 2030 and beyond, growth momentum is expected to accelerate with advancements in modular engineering, improved durability, and the use of lightweight, weather-resistant materials. The agricultural and defense sectors are likely to emerge as key contributors, utilizing temporary storage buildings for equipment, supplies, and seasonal commodities.
By the latter part of the forecast period, market value accumulation will be shaped by technological innovation, customization capabilities, and regional diversification. Manufacturers investing in sustainable materials, quick-assembly systems, and scalable designs are positioned to capture greater market share, reinforcing the upward value trajectory and solidifying the market’s long-term growth potential through 2035.
Construction project managers encounter permit coordination challenges between temporary structure classifications and permanent building requirements. Municipal building inspectors treat temporary storage installations differently from permanent structures, creating confusion over foundation requirements and utility connections. General contractors prefer standardized temporary buildings that meet multiple jurisdictions' requirements, but procurement departments focus on rental costs rather than regulatory compliance capabilities. Site supervisors need storage solutions that accommodate changing project timelines, while safety officers require structures that meet OSHA standards for equipment storage and material handling.
Manufacturing facilities face production continuity pressures when implementing temporary storage during facility expansions. Plant engineers specify temporary buildings based on production flow requirements and material handling capabilities, but facilities managers worry about long-term costs when temporary solutions extend beyond initial timeframes. Environmental compliance officers require temporary structures that meet air quality and waste management standards, while operations supervisors resist storage solutions that complicate workflow coordination between permanent and temporary spaces. Quality control departments need climate-controlled temporary storage for sensitive materials, but maintenance teams prefer simple structures that reduce system complexity.
Emergency response organizations encounter disaster recovery challenges that demand immediate temporary storage deployment. Emergency management coordinators need temporary buildings that support relief operations and supply distribution during crisis situations, but procurement regulations require competitive bidding processes that conflict with emergency deployment timelines. Relief organization supervisors require temporary storage that accommodates varied relief supplies and volunteer operations, while local officials coordinate temporary structures with community safety requirements and utility access. FEMA representatives specify temporary building standards for disaster response, but relief coordinators focus on rapid deployment capabilities over regulatory compliance complexity.
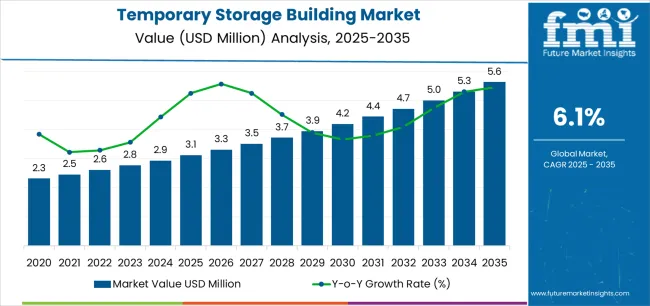
The temporary storage building market demonstrates distinct growth phases with varying market characteristics and competitive dynamics. Between 2025 and 2030, the market progresses through its infrastructure flexibility phase, expanding from USD 3,115.0 million to USD 4,186.9 million with steady annual increments averaging 6.1% growth. This period showcases the transition from basic fabric structures to advanced insulated modular systems with enhanced weather resistance and integrated climate control becoming mainstream features.
The 2025-2030 phase adds USD 1,071.9 million to market value, representing 45% of total decade expansion. Market maturation factors include standardization of modular connection protocols, declining component costs for insulated temporary buildings, and increasing industry awareness of deployment speed benefits reaching 70-80% faster installation versus conventional construction in industrial applications. Competitive landscape evolution during this period features established structure manufacturers like RÖDER HTS HÖCKER and Losberger De Boer expanding their insulated building portfolios while specialty manufacturers focus on rapid-deployment development and enhanced durability capabilities.
From 2030 to 2035, market dynamics shift toward advanced logistics integration and global infrastructure expansion, with growth continuing from USD 4,186.9 million to USD 5,631.3 million, adding USD 1,444.4 million or 55% of total expansion. This phase transition centers on fully integrated warehouse management systems, compatibility with comprehensive supply chain networks, and deployment across diverse industrial and commercial scenarios, becoming standard rather than specialized applications. The competitive environment matures with focus shifting from basic shelter capability to comprehensive capacity optimization systems and integration with smart building management platforms.
| Metric | Value |
|---|---|
| Market Value (2025) | USD 3,115.0 million |
| Market Forecast (2035) | USD 5,631.3 million |
| Growth Rate | 6.1% CAGR |
| Leading Type | Storage Buildings Category |
| Primary End Use | Logistics Sector Segment |
The market demonstrates strong fundamentals with storage building systems capturing a dominant share through advanced capacity flexibility and rapid deployment optimization capabilities. Logistics applications drive primary demand, supported by increasing e-commerce fulfillment requirements and seasonal warehousing technology needs. Geographic expansion remains concentrated in developed industrial regions with established logistics infrastructure, while emerging economies show accelerating adoption rates driven by infrastructure modernization and rising flexible capacity standards.
Market expansion rests on three fundamental shifts driving adoption across the logistics, construction, and industrial sectors.
The e-commerce growth creates compelling capacity advantages through temporary storage buildings that provide flexible warehousing expansion without long-term real estate commitments, enabling logistics operators to address peak season demands while maintaining operational flexibility and reducing capital expenditure requirements.
The infrastructure project acceleration worldwide as construction companies seek mobile site storage solutions that replace permanent facilities, enabling on-site material protection and project efficiency that align with schedule optimization and temporary accommodation standards.
The agricultural seasonality drives adoption from farming operations and agribusiness requiring effective crop storage solutions that protect harvest yields while maintaining quality during processing cycles and market distribution operations. However, growth faces headwinds from permitting challenges that vary across jurisdictions regarding the deployment of temporary structures and zoning compliance, which may limit adoption in restrictive regulatory environments. Weather resistance limitations also persist regarding extreme climate conditions and wind load requirements that may reduce effectiveness in hurricane-prone regions and severe weather zones, which affect structural integrity and operational safety.
The temporary storage building market represents a specialized yet critical infrastructure opportunity driven by expanding global logistics capacity, construction project acceleration, and the need for superior operational flexibility in diverse industrial applications. As businesses worldwide seek to achieve 70-80% capital cost reduction versus permanent construction, deploy structures within 2-4 weeks, and integrate modular expansion systems with existing facility infrastructure, temporary storage buildings are evolving from basic shelter solutions to sophisticated capacity management tools ensuring business agility and cost optimization.
The market's growth trajectory from USD 3,115.0 million in 2025 to USD 5,631.3 million by 2035 at a 6.1% CAGR reflects fundamental shifts in supply chain flexibility requirements and capital deployment optimization. Geographic expansion opportunities are particularly pronounced in North American and emerging markets, while the dominance of storage building systems (50.6% market share) and logistics applications (22.0% share) provides clear strategic focus areas.
Strengthening the dominant storage buildings segment (50.6% market share) through enhanced modular configurations, superior structural capacity, and automated climate control systems. This pathway focuses on optimizing insulation technology, improving weather resistance, extending structural lifespan to 15-20 year durability cycles, and developing specialized buildings for diverse industrial applications. Market leadership consolidation through advanced engineering and rapid deployment integration enables premium positioning while defending competitive advantages against permanent construction alternatives. Expected revenue pool: USD 285-370 million
Rapid logistics capacity growth and infrastructure project expansion across North America creates substantial opportunities through regional manufacturing capabilities and rental fleet development. Growing e-commerce fulfillment requirements and construction site logistics drive sustained demand for flexible storage systems. Regional deployment strategies reduce transportation costs, enable faster installation support, and position companies advantageously for seasonal demand peaks while accessing growing industrial markets. Expected revenue pool: USD 240-310 million
Expansion within the dominant industrial canopies segment (40.4% market share) through specialized structures addressing material protection standards and equipment shelter requirements. This pathway encompasses open-sided warehouse extensions, vehicle maintenance facilities, and compatibility with diverse operational workflows. Premium positioning reflects superior structural integrity and comprehensive customization supporting modern logistics and manufacturing operations. Expected revenue pool: USD 210-270 million
Strategic advancement in logistics applications requires enhanced warehouse management integration and specialized configurations addressing third-party logistics provider requirements. This pathway addresses peak season capacity overflow, inventory staging optimization, and cross-docking facility expansion with advanced modular engineering for rapid capacity scaling. Premium pricing reflects operational flexibility and cost savings versus permanent warehouse construction. Expected revenue pool: USD 185-240 million
Development of specialized insulated temporary structures for temperature-controlled storage, pharmaceutical applications, and food logistics operations addressing specific environmental control demands. This pathway encompasses HVAC integration, energy efficiency optimization, and regulatory compliance for controlled-environment requirements. Technology differentiation through thermal performance enables diversified revenue streams while accessing premium segments requiring climate management. Expected revenue pool: USD 160-210 million
Expansion targeting crop storage, livestock shelter, and seasonal agricultural equipment protection through specialized structures for farming operations. This pathway encompasses grain storage facilities, harvest processing sheds, and specialized ventilation for agricultural commodity preservation. Market development through application-specific design enables differentiated positioning while accessing seasonal demand cycles requiring flexible capacity solutions. Expected revenue pool: USD 140-180 million
Development of comprehensive rapid-deployment systems addressing disaster relief, military applications, and emergency response requirements across temporary shelter and storage needs. This pathway encompasses FEMA-compliant structures, military logistics support, and humanitarian aid compatibility. Premium positioning reflects mission-critical reliability and rapid deployment capability while enabling access to government procurement and relief organization partnerships. Expected revenue pool: USD 120-155 million
Primary Classification: The market segments by type into Storage Buildings, Retail & Showroom Buildings, Emergency Buildings, Educational Buildings, and Recreational Buildings categories, representing the evolution from basic storage shelter to specialized modular solutions for comprehensive operational optimization.
Secondary Classification: Structure segmentation divides the market into Industrial Canopies, Insulated Buildings, and Storage Protect Range, reflecting distinct requirements for environmental protection, structural capability, and operational flexibility standards.
Tertiary Classification: End use segmentation encompasses Logistics, Construction, Agriculture, Automotive, Chemicals & Petrochemicals, Mining & Metals, Cement, Shipbuilding & Marine, and Others, representing diverse industrial applications for temporary capacity solutions.
Regional Classification: Geographic distribution covers North America, Europe, Asia Pacific, Latin America, Africa, and the Middle East, with developed industrial markets leading technology adoption while emerging economies show accelerating growth patterns driven by infrastructure development programs.
The segmentation structure reveals technology progression from conventional fabric structures toward advanced insulated modular systems with enhanced climate control and IoT monitoring capabilities, while application diversity spans from e-commerce fulfillment to specialized industrial process storage requiring comprehensive temporary infrastructure solutions.
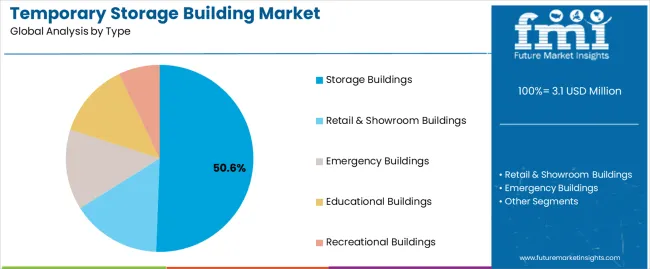
Market Position: Storage building systems command the leading position in the Temporary Storage Building market with approximately 50.6% market share through advanced capacity features, including superior volumetric efficiency, flexible layout configuration, and operational versatility that enable businesses to achieve optimal space utilization across diverse industrial storage environments.
Value Drivers: The segment benefits from business preference for general-purpose structures that provide consistent protection performance, rapid deployment capability, and capacity scalability without requiring extensive site preparation. Advanced structural features enable clear-span design, height customization, and integration with existing facility operations, where storage flexibility and cost-effectiveness represent critical business requirements.
Competitive Advantages: Storage building systems differentiate through proven structural reliability, optimal cost-to-capacity ratios, and integration with industrial operational workflows that enhance business agility while maintaining deployment costs suitable for diverse applications and temporary capacity scenarios.
Key market characteristics:
Retail and showroom building systems maintain 18.0% market share due to their essential temporary retail space and promotional event capabilities. Emergency buildings capture 11.5% share through disaster relief, military deployment, and rapid response requirements. Educational buildings demonstrate 10.2% adoption in temporary classroom, training facility, and institutional expansion applications. Recreational buildings account for 9.7% share via sports facilities, event venues, and seasonal recreation infrastructure.
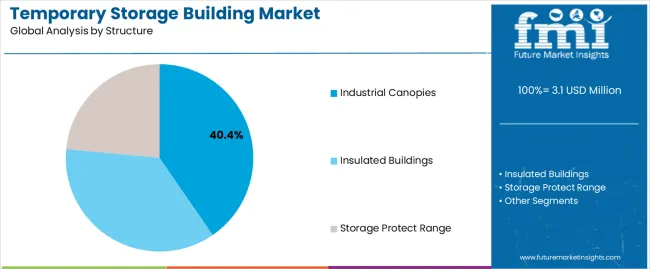
Market Context: Industrial canopies applications dominate the Temporary Storage Building market with approximately 40.4% market share due to widespread adoption of open-sided structures and increasing focus on material protection, equipment shelter, and operational flexibility applications that maximize weather protection while maintaining ventilation and operational access standards.
Appeal Factors: Industrial operators prioritize cost-effectiveness, rapid installation, and integration with existing facility infrastructure that enables coordinated operations across outdoor and covered work areas. The segment benefits from substantial logistics facility expansion investment and manufacturing site development that emphasize affordable capacity additions for vehicle maintenance, material staging, and equipment protection applications.
Growth Drivers: E-commerce warehouse expansion programs incorporate industrial canopies as essential infrastructure for loading dock extensions, trailer parking protection, and outdoor inventory staging, while construction site logistics increases demand for equipment shelter and material protection capabilities that comply with site safety standards and optimize workflow efficiency.
Market Challenges: Limited climate control capabilities and open-sided design may restrict applications requiring full environmental enclosure or temperature management scenarios.
Application dynamics include:
Insulated building structures maintain 34.1% market share through temperature-controlled storage, climate-sensitive operations, and energy-efficient applications. Storage Protect Range systems capture 25.5% share via rapid-deployment shelters, basic material protection, and budget-conscious temporary capacity solutions requiring minimal site preparation.
Growth Accelerators: E-commerce capacity overflow drives primary adoption as temporary storage buildings provide flexible warehousing expansion that enables logistics operators to address peak season demands without long-term real estate commitments, supporting operational agility and capital efficiency that align with variable demand patterns for fulfillment capacity. Construction project acceleration demand accelerates market expansion as contractors seek mobile site storage solutions that eliminate off-site material warehousing while maintaining tool security during project execution phases and multi-site operations. Agricultural seasonality spending increases worldwide, creating sustained demand for crop storage structures that complement harvest protection, commodity staging, and equipment shelter processes providing operational effectiveness in seasonal farming cycles.
Growth Inhibitors: Permitting complexity varies across jurisdictions regarding the installation of temporary structures and building code compliance, which may limit deployment flexibility and market penetration in regions with restrictive zoning regulations or permanent structure preference. Weather resistance limitations persist regarding extreme wind conditions and snow load requirements that may reduce structural safety in hurricane-prone coastal areas, heavy snowfall regions, or operations requiring year-round durability, affecting risk management and insurance considerations. Market fragmentation across multiple structure specifications and engineering standards creates compatibility concerns between different manufacturer systems and existing facility infrastructure.
Market Evolution Patterns: Adoption accelerates in logistics operations and large-scale construction projects where flexibility benefits justify temporary structure costs, with geographic concentration in developed industrial regions transitioning toward mainstream adoption in emerging economies driven by infrastructure investment and manufacturing expansion. Technology development focuses on enhanced insulation systems, improved structural engineering, and integration with building management platforms that optimize climate control and facility monitoring. The market could face disruption if modular permanent construction methods significantly reduce cost and time advantages of temporary structures in industrial applications, though the industry's fundamental need for deployment flexibility and reversible capacity continues to make temporary buildings essential in dynamic business environments.
The temporary storage building market demonstrates varied regional dynamics with Growth Leaders including the United States (6.1% CAGR) and Brazil (5.7% CAGR) driving expansion through e-commerce infrastructure investment and agricultural storage capacity additions. Emerging Markets encompass India (5.5% CAGR) benefiting from industrial corridor development and logistics infrastructure programs. Steady Adopters feature the United Kingdom (4.6% CAGR), China (4.4% CAGR), and Germany (3.9% CAGR), supported by established industrial sectors and flexible capacity requirements. Mature Markets include Japan (3.5% CAGR), where space constraints and disaster preparedness support consistent growth patterns.
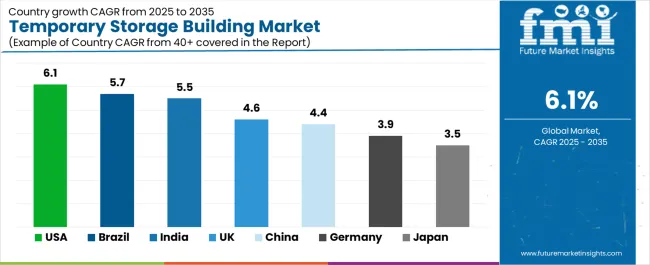
| Country | CAGR (2025-2035) |
|---|---|
| United States | 6.1% |
| Brazil | 5.7% |
| India | 5.5% |
| United Kingdom | 4.6% |
| China | 4.4% |
| Germany | 3.9% |
| Japan | 3.5% |
Regional synthesis reveals North American markets leading adoption through e-commerce fulfillment expansion and infrastructure project acceleration, while emerging economies demonstrate robust growth supported by industrial development and agricultural modernization trends. European markets show steady growth driven by logistics optimization and construction site efficiency requirements.
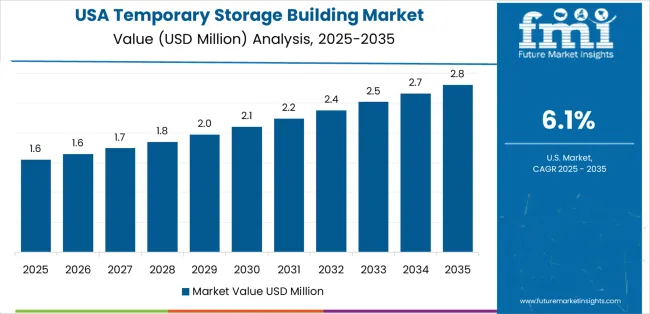
The United States leads market momentum with a 6.1% CAGR, driven by e-commerce overflow warehousing demand, large infrastructure project requirements, and FEMA/defense rapid-deployment applications across logistics hubs, construction sites, and emergency response locations. Amazon and major 3PL operators drive primary temporary warehouse demand for peak season fulfillment capacity, while infrastructure investment through federal programs creates sustained construction site storage requirements. Government emergency preparedness spending and military logistics modernization support specialized rapid-deployment structure procurement for disaster relief and operational readiness.
The convergence of e-commerce growth requiring flexible capacity, infrastructure investment creating temporary site facilities demand, and emergency management modernization positions the United States as the dominant market for temporary storage buildings. Retail distribution network optimization and last-mile fulfillment expansion create additional opportunities, while manufacturing reshoring initiatives drive temporary production staging and materials warehousing requirements supporting supply chain localization.
Performance Metrics:
The Brazilian market emphasizes agribusiness seasonality with documented adoption effectiveness in crop storage and port-adjacent transshipment operations through integration with agricultural export infrastructure and logistics networks. The country leverages agricultural production scale and port expansion investment to maintain strong market presence at 5.7% CAGR. Regions including Mato Grosso, São Paulo, Paraná, and port areas showcase extensive installations where temporary buildings integrate with comprehensive commodity handling platforms and export logistics systems to optimize harvest processing and shipment efficiency. Brazilian agribusiness operators prioritize cost-effective capacity, rapid deployment for harvest seasons, and port proximity that reflect commodity export requirements.
Soybean and corn production expansion drives sustained temporary storage demand for harvest protection and commodity staging before processing or export. Santos and Paranaguá port development creates transshipment warehouse requirements for agricultural commodities awaiting vessel loading and container consolidation operations.
Market Intelligence Brief:
India's expanding industrial market demonstrates substantial temporary building deployment with documented operational effectiveness in logistics parks, manufacturing zones, and agricultural storage through integration with infrastructure development programs and supply chain modernization. The country leverages industrial policy initiatives and manufacturing growth to maintain robust equipment adoption at 5.5% CAGR. Industrial corridors including Delhi-Mumbai Industrial Corridor, dedicated freight corridors, and logistics park developments showcase significant installations where temporary buildings integrate with comprehensive warehousing platforms and distribution networks to optimize inventory management and operational flexibility. Indian businesses prioritize affordable capacity expansion, monsoon-resilient construction, and rapid deployment that create demand for cost-effective structures meeting climate protection requirements.
E-commerce growth and third-party logistics expansion drive warehouse capacity requirements, while Make in India manufacturing initiatives create temporary production storage and materials handling needs. Agricultural modernization programs including cold chain development support specialized temporary storage for crop protection and processing operations.
Strategic Market Indicators:
The UK market emphasizes commercial flexibility with documented effectiveness in retail refurbishment overflow, event structures, and construction site logistics through integration with urban redevelopment programs and commercial property operations at 4.6% CAGR. British businesses leverage temporary buildings for retail chain refurbishment projects requiring inventory storage during store renovations, seasonal promotional events including Christmas markets and festivals, and urban construction sites with space constraints requiring on-site facilities. Logistics operators prioritize rapid deployment, planning permission compliance, and short-term rental flexibility creating demand for structures suitable for temporary retail, warehouse overflow, and construction applications. The market benefits from commercial property development cycles, retail sector adaptation to omnichannel strategies, and infrastructure investment supporting urban regeneration projects.
Retail operators use temporary buildings for seasonal inventory storage and clearance sale venues, while construction companies deploy structures on urban sites for materials storage and site office accommodation meeting health and safety requirements.
Performance Metrics:
China demonstrates significant market development at 4.4% CAGR characterized by mega-infrastructure projects requiring movable on-site storage and third-party logistics modular capacity expansion near distribution hubs. The Chinese market focuses on large-scale construction projects including transportation infrastructure, industrial facilities, and urban development requiring temporary site warehousing for materials, equipment, and contractor facilities supporting multi-year construction programs. Logistics development emphasizes rapid warehouse deployment near manufacturing clusters and port facilities where temporary buildings provide flexible capacity for seasonal demand fluctuation and new market entry testing before permanent facility investment. E-commerce platforms and courier companies utilize temporary structures for sorting centers and last-mile distribution hubs in rapidly growing urban markets.
Belt and Road infrastructure projects and domestic transportation network expansion create sustained temporary building demand for construction site logistics. Manufacturing zones in Pearl River Delta and Yangtze River Delta regions drive warehouse capacity requirements supporting export production and domestic distribution networks.
Market Characteristics:
Germany maintains steady expansion at 3.9% CAGR through automotive production logistics, machinery manufacturing staging requirements, and insulated temporary buildings meeting energy efficiency standards across industrial operations. German automotive suppliers and assembly plants utilize temporary structures for component staging, vehicle storage, and logistics buffer areas supporting just-in-time manufacturing systems. Machinery and equipment manufacturers employ temporary buildings for production overflow, finished goods warehousing, and project-specific assembly operations requiring flexible capacity. Market emphasis on energy-efficient insulated structures reflects environmental regulations and operational cost optimization supporting climate-controlled storage and working environments.
Premium insulated temporary buildings meeting building energy standards enable year-round operations for temperature-sensitive manufacturing processes and inventory storage. Industrial rental programs provide flexible capacity without capital expenditure supporting manufacturing flexibility and project-based requirements.
Strategic Development Indicators:
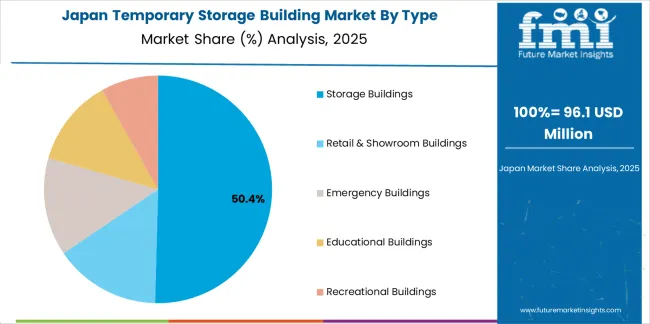
Japan demonstrates specialized market presence at 3.5% CAGR through compact logistics applications and disaster-readiness stockpile facilities that emphasize space-efficient design, structural resilience, and rapid deployment capability. The Japanese market focuses on urban logistics operations where property costs justify temporary structures for last-mile distribution hubs, e-commerce fulfillment overflow, and construction site facilities in dense metropolitan areas including Tokyo, Osaka, and Nagoya regions. Disaster preparedness programs support temporary structure stockpiling for emergency response, evacuation facilities, and relief supply warehousing addressing earthquake and typhoon readiness requirements. Semi-permanent fabric hall structures provide cost-effective alternatives to conventional buildings for logistics and light manufacturing applications.
Government disaster management investment and private sector business continuity planning drive emergency structure demand. Urban redevelopment projects create temporary displacement needs for commercial operations and construction site logistics in constrained locations.
Market Development Factors:
The United Kingdom demonstrates established market development characterized by construction site logistics optimization and retail property flexibility that emphasize rapid deployment, planning compliance, and operational efficiency at 4.6% CAGR. The UK market prioritizes temporary buildings for urban construction projects where site constraints require efficient materials storage, contractor facilities, and equipment protection within limited footprints. Retail sector evolution drives temporary structure demand for inventory management during store refits, seasonal promotional venues, and omnichannel distribution supporting both physical retail and e-commerce operations. Event industry maturity creates sustained demand for temporary venues supporting festivals, exhibitions, and corporate functions requiring professional-quality structures.
Performance Metrics:
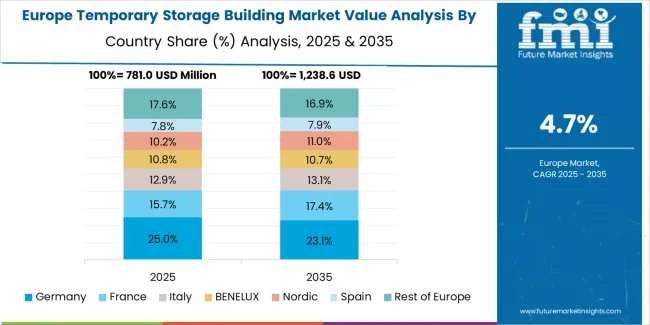
The temporary storage building market in Europe is projected to grow from USD 900.0 million in 2025 to USD 1,550.0 million by 2035, registering a CAGR of approximately 5.3% over the forecast period. Germany is expected to maintain its leadership position with a 24.0% market share in 2025, moderating slightly to 23.2% by 2035, supported by sustained automotive and logistics staging requirements plus energy-efficient insulated hall adoption meeting environmental standards.
France holds a 17.5% share in 2025, rising to 17.9% by 2035, driven by retail distribution infrastructure upgrades and public sector deployments for municipal operations and emergency services. The United Kingdom accounts for 16.0% in 2025, easing to 15.5% by 2035 as construction site logistics normalize following major infrastructure program cycles yet maintain steady contractor adoption. Italy commands a 13.0% share in 2025, nudging to 13.2% by 2035, aided by construction sector activity and agri-food logistics hub development supporting regional distribution. Spain posts 11.0% in 2025, reaching 11.3% by 2035, reflecting agricultural seasonality storage needs and port logistics expansion. The Nordic and Benelux countries jointly represent 10.5% in 2025, expanding to 11.2% by 2035 with high adoption of insulated, weather-resilient structures meeting sustainability standards and climate challenges. Rest of Europe is anticipated to moderate from 8.0% to 7.7% by 2035, as cohesion-fund infrastructure projects transition toward more permanent asset development and core markets capture electrification-driven value growth.
Japan demonstrates specialized market development characterized by compact temporary structures for space-constrained urban logistics and comprehensive disaster-readiness infrastructure that emphasizes structural resilience, rapid deployment capability, and space optimization. The Japanese market focuses on high-density metropolitan areas where property costs justify temporary building solutions for last-mile distribution centers, e-commerce fulfillment overflow, and construction site facilities requiring minimal footprint in Tokyo, Osaka, Nagoya, and other major urban centers. Temporary structure procurement emphasizes seismic engineering, typhoon resistance, and quality construction that align with Japanese safety standards and long-term reliability expectations despite temporary classification. The market benefits from government disaster preparedness programs maintaining rapid-deployment structure inventories and private sector business continuity planning requiring emergency facility capability.
Market Development Factors:
South Korea demonstrates emerging market characteristics focused on manufacturing support structures and technology-forward temporary building applications reflecting the country's industrial sophistication and quality standards. The Korean market emphasizes temporary structures for automotive component staging, electronics manufacturing logistics, and shipbuilding industry applications requiring flexible capacity supporting production cycle variations. Korean industrial operators prioritize structural quality, climate control capabilities, and integration with manufacturing execution systems that reflect advanced factory automation and supply chain management practices. The market benefits from export-oriented manufacturing requiring flexible warehouse capacity near port facilities and industrial complexes supporting just-in-time logistics and production scheduling optimization.
Strategic Development Indicators:
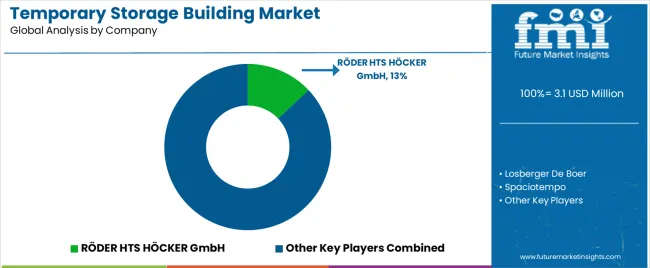
The Temporary Storage Building Market is expanding as industries seek flexible, fast-deployment structures for warehousing, equipment protection, seasonal inventory overflow, and on-site logistics. These buildings are used across agriculture, construction, manufacturing, defense, and disaster relief due to their lower capital cost, modularity, and ability to be relocated. Growing supply chain volatility and infrastructure strain in expanding urban regions are driving demand for storage solutions that can be installed quickly without permanent foundations.
In the agricultural and agribusiness sectors, companies such as Netafim Ltd., Jain Irrigation Systems Ltd., and EPC Industries Ltd. influence demand for temporary storage by supporting large-scale farm operations that require flexible space for crop handling, irrigation equipment storage, and seed or fertilizer warehousing. The Toro Company, Rain Bird Corporation, and Hunter Industries support turf, landscaping, and agricultural projects where temporary buildings are used to store tools, machinery, and maintenance supplies.
Manufacturers and infrastructure solution providers such as Valmont Industries, Rivulis Irrigation Ltd., Lindsay Corporation, and Reinke Manufacturing Co., Inc. rely on temporary storage structures for equipment staging, assembly sites, and regional distribution hubs. As businesses aim to increase operational agility and reduce fixed facility costs, temporary storage buildings are being more widely adopted as scalable, climate-controlled, and easily relocatable storage assets.
| Item | Value |
|---|---|
| Quantitative Units | USD 3,115.0 million |
| Type | Storage Buildings, Retail & Showroom Buildings, Emergency Buildings, Educational Buildings, Recreational Buildings |
| Structure | Industrial Canopies, Insulated Buildings, Storage Protect Range |
| End Use | Logistics, Construction, Agriculture, Automotive, Chemicals & Petrochemicals, Mining & Metals, Cement, Shipbuilding & Marine, Others |
| Regions Covered | North America, Europe, Asia Pacific, Latin America, Africa, Middle East |
| Countries Covered | United States, Brazil, India, United Kingdom, China, Germany, Japan, and 25+ additional countries |
| Key Companies Profiled | Netafim Ltd., Jain Irrigation Systems Ltd., The Toro Company, Rain Bird Corporation, Hunter Industries, Valmont Industries, Rivulis Irrigation Ltd., Lindsay Corporation, Reinke Manufacturing Co., Inc., and EPC Industries Ltd. |
| Additional Attributes | Dollar sales by type, structure, and end use categories, regional adoption trends across North America, Europe, and Asia Pacific, competitive landscape with structure manufacturers and temporary building suppliers, business preferences for deployment speed and cost flexibility, integration with logistics management platforms and site operations, innovations in insulated configurations and rapid-deployment capabilities, and development of modular expansion solutions with enhanced durability and industrial optimization capabilities. |
The global temporary storage building market is estimated to be valued at USD 3.1 million in 2025.
The market size for the temporary storage building market is projected to reach USD 5.6 million by 2035.
The temporary storage building market is expected to grow at a 6.1% CAGR between 2025 and 2035.
The key product types in temporary storage building market are storage buildings, retail & showroom buildings, emergency buildings, educational buildings and recreational buildings.
In terms of structure, industrial canopies segment to command 40.4% share in the temporary storage building market in 2025.


Our Research Products

The "Full Research Suite" delivers actionable market intel, deep dives on markets or technologies, so clients act faster, cut risk, and unlock growth.

The Leaderboard benchmarks and ranks top vendors, classifying them as Established Leaders, Leading Challengers, or Disruptors & Challengers.

Locates where complements amplify value and substitutes erode it, forecasting net impact by horizon

We deliver granular, decision-grade intel: market sizing, 5-year forecasts, pricing, adoption, usage, revenue, and operational KPIs—plus competitor tracking, regulation, and value chains—across 60 countries broadly.

Spot the shifts before they hit your P&L. We track inflection points, adoption curves, pricing moves, and ecosystem plays to show where demand is heading, why it is changing, and what to do next across high-growth markets and disruptive tech

Real-time reads of user behavior. We track shifting priorities, perceptions of today’s and next-gen services, and provider experience, then pace how fast tech moves from trial to adoption, blending buyer, consumer, and channel inputs with social signals (#WhySwitch, #UX).

Partner with our analyst team to build a custom report designed around your business priorities. From analysing market trends to assessing competitors or crafting bespoke datasets, we tailor insights to your needs.
Supplier Intelligence
Discovery & Profiling
Capacity & Footprint
Performance & Risk
Compliance & Governance
Commercial Readiness
Who Supplies Whom
Scorecards & Shortlists
Playbooks & Docs
Category Intelligence
Definition & Scope
Demand & Use Cases
Cost Drivers
Market Structure
Supply Chain Map
Trade & Policy
Operating Norms
Deliverables
Buyer Intelligence
Account Basics
Spend & Scope
Procurement Model
Vendor Requirements
Terms & Policies
Entry Strategy
Pain Points & Triggers
Outputs
Pricing Analysis
Benchmarks
Trends
Should-Cost
Indexation
Landed Cost
Commercial Terms
Deliverables
Brand Analysis
Positioning & Value Prop
Share & Presence
Customer Evidence
Go-to-Market
Digital & Reputation
Compliance & Trust
KPIs & Gaps
Outputs
Full Research Suite comprises of:
Market outlook & trends analysis
Interviews & case studies
Strategic recommendations
Vendor profiles & capabilities analysis
5-year forecasts
8 regions and 60+ country-level data splits
Market segment data splits
12 months of continuous data updates
DELIVERED AS:
PDF EXCEL ONLINE
Market Share Breakdown of Temporary Storage Building Providers
Temporary Fencing Panels Market Size and Share Forecast Outlook 2025 to 2035
Building Automation System Market Size and Share Forecast Outlook 2025 to 2035
Storage Water Heater Market Size and Share Forecast Outlook 2025 to 2035
Temporary Road Covers Market Size and Share Forecast Outlook 2025 to 2035
Building Information Modeling Market Size and Share Forecast Outlook 2025 to 2035
Building Envelope Market Size and Share Forecast Outlook 2025 to 2035
Temporary Bonding Adhesives Market Size and Share Forecast Outlook 2025 to 2035
Building Access Control Security Market Size and Share Forecast Outlook 2025 to 2035
Storage Tank Equipment Market Size and Share Forecast Outlook 2025 to 2035
Storage And Handling Equipment Market Size and Share Forecast Outlook 2025 to 2035
Building Materials Market Size and Share Forecast Outlook 2025 to 2035
Building Maintenance Unit (BMU) Market Size and Share Forecast Outlook 2025 to 2035
Building Energy Management Solutions Market Size and Share Forecast Outlook 2025 to 2035
Temporary Tattoos Market Size and Share Forecast Outlook 2025 to 2035
Building Automation System Industry Analysis in Korea Analysis - Size, Share, and Forecast Outlook 2025 to 2035
Building Thermal Insulation Market Growth - Trends & Forecast 2025 to 2035
Storage Area Network (SAN) Market Analysis by Component, SAN Type, Technology, Vertical, and Region through 2035
Leading Providers & Market Share in Building Automation System
Competitive Landscape of Temporary Fencing Panels Market Share

Thank you!
You will receive an email from our Business Development Manager. Please be sure to check your SPAM/JUNK folder too.
Chat With
MaRIA