The temporary fencing panels market is valued at USD 3.7 billion in 2025 and is projected to reach USD 5.3 billion by 2035, rising at a CAGR of 3.7%, adding USD 1.62 billion in total. The market expansion is driven by growing construction activities, increasing event management needs, and the rising adoption of cost-effective, secure, and flexible fencing solutions. Between 2025 and 2030, the market increases to USD 4.46 billion, contributing 47.5% of the total decade growth. The remaining growth is expected from 2030 to 2035, with the continued adoption of smart technologies, modular designs, and eco-friendly materials.
By type, the standard panels segment leads with a 50.6% market share due to their proven reliability, cost-effectiveness, and versatility in commercial, residential, and industrial applications. Commercial end users dominate with 45.4% market share, reflecting strong demand from both construction sites and event management operations. The construction sector is the largest contributor, accounting for 30-35% of the demand, followed by event management at 20-25%. Key growth regions include North America, Europe, and Asia Pacific, with the USA (3.7% CAGR) leading growth due to vibrant construction and event sectors.
The rising concerns about safety and security, particularly in urban areas and high-traffic locations, further contributes to the growth of the temporary fencing panels market. Urban spaces, construction zones, and public events require temporary barriers to direct foot traffic, protect pedestrians, and secure valuable assets. Additionally, industries such as logistics and transportation use temporary fences to create controlled areas for storage, loading, and unloading, ensuring smooth operations and minimizing the risk of accidents.
Technological advancements in temporary fencing design and materials are also driving the market. Manufacturers are increasingly developing lightweight, durable, and easy-to-install fencing panels that offer enhanced security and resistance to harsh environmental conditions. The use of galvanized steel, aluminum, and composite materials has improved the strength, longevity, and weather resistance of fencing panels, making them suitable for long-term or high-demand applications. These innovations provide improved value to end users by reducing maintenance costs and increasing the operational life of the fencing systems.
Competitively, the market remains moderately consolidated, with companies like Security Fence Company, Quickfence, Jinbiao Wire Mesh Fence Co. Ltd., and Jacksons Fencing holding a strong presence. These companies focus on developing advanced fencing solutions, including IoT-enabled smart systems, modular designs, and eco-friendly materials to stay ahead in the competitive landscape.
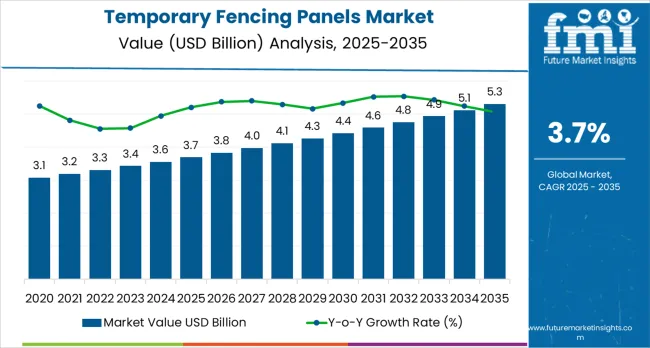
| Metric | Value |
|---|---|
| Estimated Value in (2025E) | USD 3.7 billion |
| Forecast Value in (2035F) | USD 5.31 billion |
| Forecast CAGR (2025 to 2035) | 3.7% |
The construction market is the largest contributor, accounting for about 30-35% of the demand. Temporary fencing is essential for securing construction sites, ensuring safety, and controlling access during building and infrastructure projects. The event management market adds approximately 20-25%, as fencing panels are crucial for crowd control, site segregation, and boundary setting during public gatherings, festivals, and corporate events. The industrial and manufacturing market accounts for 15-18%, where temporary fencing is used to secure industrial premises during construction, maintenance, or upgrades, as well as to protect machinery and materials.
The agriculture market contributes 12-15%, driven by the need for fencing to contain livestock or secure specific areas during farming operations, harvest events, or seasonal activities. The security services market makes up about 10-12%, where temporary fencing solutions are utilized for protecting high-risk sites such as demolition zones, vacant properties, or during security operations. Collectively, these parent markets influence factors like material durability, ease of installation, mobility, and scalability. The commercial success of temporary fencing panels also depends on factors such as rental agreements, installation speed, customization options, and maintenance support.
Market expansion is being supported by the increasing demand for flexible security solutions and the corresponding need for portable fencing equipment that can maintain operational reliability and cost-effectiveness while supporting diverse security applications across various construction, event, and commercial environments. Modern project managers and facility operators are increasingly focused on implementing temporary fencing solutions that can reduce installation time, minimize operational costs, and provide consistent performance in security operations. Temporary fencing panels'proven ability to deliver enhanced operational efficiency, reliable security management capabilities, and versatile protection applications make them essential equipment for contemporary construction operations and event management solutions.
The growing emphasis on site security and event management is driving demand for temporary fencing panels that can support high-volume operations, reduce installation complexity, and enable efficient perimeter control across varying project configurations. Project operators'preference for equipment that combines reliability with operational efficiency and cost-effectiveness is creating opportunities for innovative fencing implementations. The rising influence of safety regulations and event security requirements is also contributing to increased adoption of temporary fencing panels that can provide advanced security control without compromising performance or installation flexibility.
The temporary fencing panels market is poised for robust growth and transformation. As project managers and facility operators across both developed and emerging markets seek security equipment that is efficient, reliable, portable, and cost-effective, temporary fencing panel systems are gaining prominence not just as operational equipment but as strategic infrastructure for operational efficiency, site security, project management enhancement, and cost optimization.
Rising construction activity and event management demand in North America, Europe, and Asia Pacific amplify demand, while manufacturers are picking up on innovations in lightweight materials and modular design systems.
Pathways like smart technology integration, eco-friendly material development, and modular design promise strong margin uplift, especially in developed markets. Geographic expansion and application diversification will capture volume, particularly where construction activity is growing or event management requirements require modernization. Environmental pressures around material recycling, lightweight design, operational optimization, and cost management give structural support.
The market is segmented by type, material, end user, sales channel, and region. By type, the market is divided into standard, round top, heavy duty round top, and anti-climb panels. By material, it covers metal and others. By end user, it is segmented into commercial, residential, industrial, and others. By sales channel, it includes online retailers, bricks &mortar stores, and direct sales. Regionally, the market is divided into North America, Latin America, Western Europe, Eastern Europe, East Asia, South Asia Pacific, and Middle East &Africa.
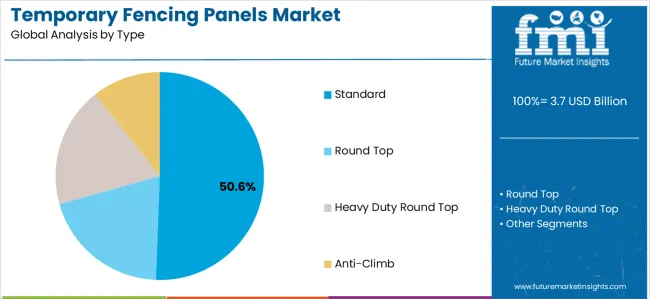
The standard panels segment is projected to account for 50.6% of the temporary fencing panels market in 2025, reaffirming its position as the leading type category. Project managers and facility operators increasingly utilize standard panels for their proven reliability, cost-effectiveness, and versatile application compatibility across construction sites, event venues, and commercial security applications. Standard panel technology's established operational procedures and consistent performance output directly address the project requirements for reliable perimeter control and operational efficiency in diverse security environments.
This type segment forms the foundation of current temporary security operations, as it represents the technology with the greatest operational versatility and established installation infrastructure across multiple applications and project scenarios. Operator investments in enhanced durability features and improved connectivity systems continue to strengthen adoption among construction managers and event organizers. With operators prioritizing operational reliability and equipment availability, standard panels align with both operational efficiency objectives and cost management requirements, making them the central component of comprehensive temporary security strategies.
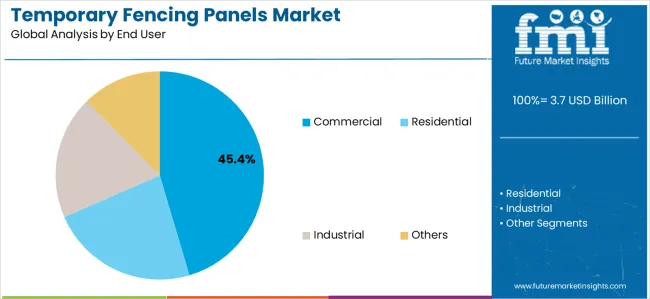
Commercial end user is projected to represent 45.4% of temporary fencing panels in 2025, underscoring its critical role as the primary application sector for construction projects and event management operations. Commercial operators prefer temporary fencing panels for their efficiency, reliability, and ability to handle diverse security requirements while supporting project schedules and facility protection needs. Positioned as essential equipment for modern commercial operations, temporary fencing offers both operational advantages and security benefits.
The segment is supported by continuous innovation in commercial construction expansion and the growing availability of specialized panel configurations that enable efficient perimeter control with enhanced security capabilities. Commercial operators are investing in security optimization to support large-scale operations and project management delivery. As commercial development becomes more prevalent and security requirements increase, commercial sector will continue to dominate the end user market while supporting advanced equipment utilization and project security strategies.
The temporary fencing panels market is advancing steadily due to increasing demand for flexible security solutions and growing adoption of cost-effective infrastructure that provides enhanced site protection and operational reliability across diverse construction, event, and commercial applications. The market faces challenges, including limited durability for long-term use, weather resistance concerns, and varying security requirements across different application environments. Innovation in lightweight materials and modular design systems continues to influence equipment development and market expansion patterns.
The growing expansion of construction projects and event management operations is enabling equipment manufacturers to develop temporary fencing panel systems that provide superior operational efficiency, enhanced security management capabilities, and reliable performance in high-activity environments. Advanced fencing systems provide improved security capacity while allowing more effective perimeter control and consistent protection delivery across various applications and project requirements. Manufacturers are increasingly recognizing the competitive advantages of modern fencing capabilities for operational efficiency and security management positioning.
Modern temporary fencing panel manufacturers are incorporating recycled materials and smart monitoring systems to enhance operational efficiency, reduce environmental impact, and ensure consistent performance delivery to project operators. These technologies improve environmental compliance while enabling new applications, including IoT connectivity and automated security solutions. Advanced technology integration also allows manufacturers to support premium equipment positioning and operational optimization beyond traditional temporary security equipment supply.
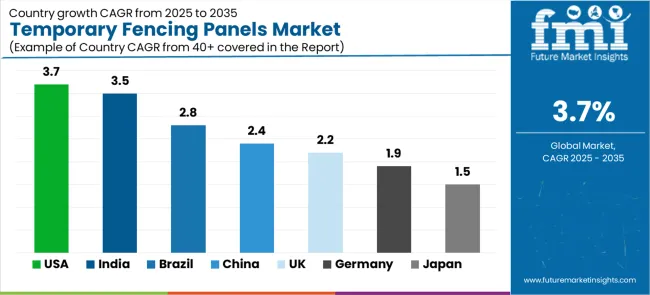
| Country | CAGR (2025-2035) |
|---|---|
| USA | 3.7% |
| India | 3.5% |
| China | 2.4% |
| Germany | 1.9% |
| Japan | 1.5% |
| United Kingdom | 2.2% |
| Brazil | 2.8% |
The temporary fencing panels market is experiencing steady growth globally, with USA leading at a 3.7% CAGR through 2035, driven by active construction sector development, vibrant event management industry, and significant adoption of flexible security solutions. India follows at 3.5%, supported by rapid infrastructure development projects, growing construction activity, and increasing adoption of cost-effective security technologies. Brazil shows growth at 2.8%, emphasizing construction expansion and event management capabilities. China demonstrates 2.4% growth, focusing on industrial development and infrastructure modernization. United Kingdom records 2.2%, supporting construction recovery and event security requirements. Germany shows 1.9% growth, driven by industrial applications and advanced manufacturing capabilities. Japan demonstrates 1.5% growth, supported by infrastructure maintenance but constrained by mature market conditions.
The report provides an in-depth analysis of over 40 countries, with seven top-performing countries highlighted below.
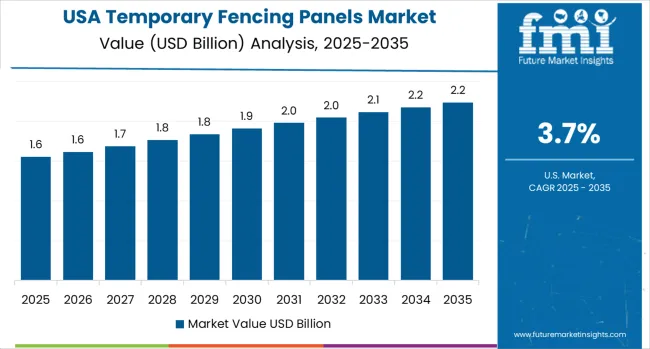
Revenue from temporary fencing panels in the USA is projected to exhibit exceptional growth with a CAGR of 3.7% through 2035, driven by active construction sector expansion and vibrant event management industry supported by infrastructure development and security enhancement initiatives. The country's comprehensive construction infrastructure and increasing investment in event security technologies are creating substantial demand for flexible security solutions. Major construction companies and event organizers are establishing comprehensive fencing operations to serve both domestic projects and commercial security requirements.
Demand for temporary fencing panels in India is expanding at a CAGR of 3.5%, supported by the country's rapid infrastructure development projects, comprehensive construction expansion, and increasing adoption of cost-effective security systems. The country's strategic industrial development and growing construction activity are driving demand for affordable fencing capabilities. Construction companies and project developers are establishing extensive equipment operations to address the growing demand for efficient site security and operational reliability.
Revenue from temporary fencing panels in China is growing at a CAGR of 2.4%, supported by the country's industrial development programs, comprehensive infrastructure modernization, and strategic investment in construction efficiency improvement. China's established industrial sector and emphasis on operational optimization are driving demand for reliable fencing technologies across major industrial markets. Construction operators and facility managers are establishing equipment partnerships to serve both domestic industrial development and operational efficiency markets.
Demand for temporary fencing panels in Germany is expected to expand at a CAGR of 1.9%, supported by the country's advanced manufacturing capabilities, industrial application focus, and strategic investment in operational efficiency improvement. Germany's mature industrial sector and emphasis on quality standards are driving demand for high-performance fencing technologies across major industrial markets. Manufacturing operators and facility managers are establishing technology partnerships to serve both domestic industrial needs and export market operations.
Revenue from temporary fencing panels in United Kingdom is anticipated to grow at a CAGR of 2.2%, supported by the country's construction recovery programs, growing event management industry, and increasing investment in security enhancement. United Kingdom's established construction infrastructure and emphasis on event security optimization are supporting demand for flexible fencing technologies across major commercial markets. Construction operators and event organizers are establishing equipment programs to serve both domestic construction needs and event security requirements.
Demand for temporary fencing panels in Brazil is forecasted to expand at a CAGR of 2.8%, supported by the country's construction expansion programs, growing infrastructure development, and increasing investment in security modernization. Brazil's expanding construction market and emphasis on operational improvement are driving demand for cost-effective fencing technologies across major metropolitan markets. Construction operators and project developers are establishing service partnerships to serve both domestic construction development and security enhancement markets.
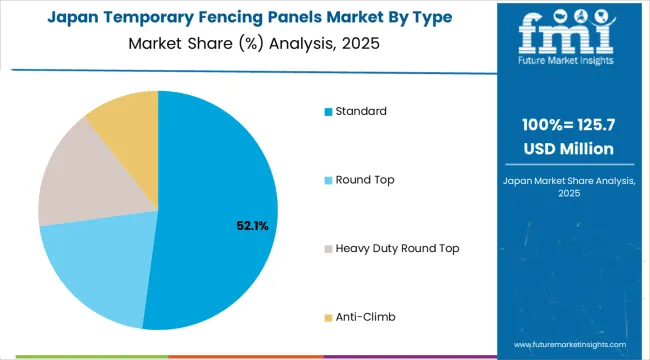
Revenue from temporary fencing panels in Japan is expanding at a CAGR of 1.5%, supported by the country's infrastructure maintenance requirements, technology integration capabilities, and strategic investment in operational optimization. Japan's advanced technology sector and emphasis on operational efficiency are driving demand for high-technology fencing systems across major infrastructure markets. Infrastructure operators and facility managers are establishing technology partnerships to serve both domestic maintenance needs and operational efficiency markets.
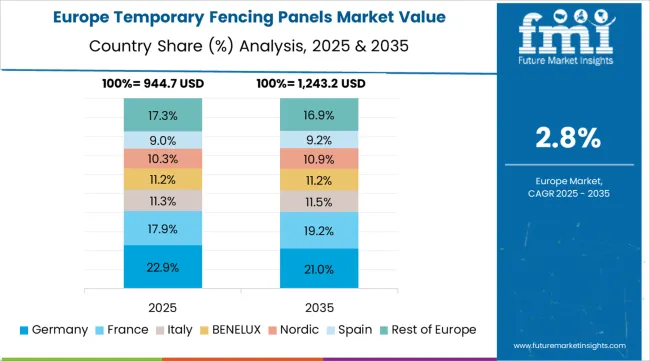
The temporary fencing panels market in Europe is projected to grow from USD 1.1 billion in 2025 to USD 1.5 billion by 2035, registering a CAGR of 3.1% over the forecast period. Germany is expected to maintain its leadership position with a 28.5% market share in 2025, increasing to 28.8% by 2035, supported by its advanced industrial infrastructure, comprehensive construction capabilities, and major event facilities serving European and international markets.
United Kingdom follows with an 19.2% share in 2025, projected to ease to 18.9% by 2035, driven by construction recovery programs, event security initiatives, and established commercial capabilities, but facing challenges from competitive pressures and investment constraints. France holds a 17.4% share in 2025, expected to decline to 17.1% by 2035, supported by infrastructure modernization requirements and construction development initiatives but facing challenges from market competition and investment uncertainties. Italy commands a 14.3% share in 2025, projected to reach 14.4% by 2035, while Spain accounts for 11.8% in 2025, expected to reach 11.9% by 2035. The Rest of Europe region, including Nordic countries, Eastern European markets, Netherlands, Belgium, and other European countries, is anticipated to gain momentum, expanding its collective share from 8.8% to 8.9% by 2035, attributed to increasing construction development across Nordic countries and growing infrastructure modernization across various European markets implementing security enhancement programs.
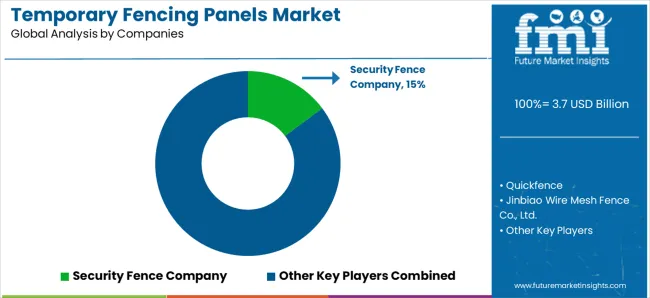
The temporary fencing panels market features 10–15 key players, with the top five companies holding around 50–55% of global market share, driven by their product quality, extensive distribution networks, and strong customer relationships across construction, events, security, and industrial sectors. Competition is primarily centered on fence durability, ease of installation, cost-effectiveness, and compliance with safety regulations, rather than price alone. Security Fence Company leads the market with an 15% share, benefiting from its robust product range, custom solutions, and strong presence in high-demand sectors such as construction, events, and crowd control.
Market leaders such as Security Fence Company, Quickfence, Jinbiao Wire Mesh Fence Co., Ltd., and Anping County YongMing Wire Mesh Fencing Co., Ltd. maintain dominance by offering high-quality, versatile fencing panels designed for temporary setups. These companies leverage their experience in manufacturing, efficient supply chains, and ability to meet a wide variety of customer requirements, including custom sizes, materials, and fast delivery times.
Challengers like Jacksons Fencing, Screw Fencing PTY Ltd., and Fortressfencing.co.nz offer specialized products for unique applications such as security, temporary enclosures, and public safety. Regional players such as Guangdong Golon New Material Co., Ltd., Zaun Ltd., and Zoyals International Metal Wire Mesh Co. Ltd. cater to local markets by providing cost-effective solutions and enhancing product offerings with superior material strength and rapid installation capabilities, ensuring competitiveness in their respective regions.
| Items | Values |
|---|---|
| Quantitative Units (2025) | USD 3.7 billion |
| Type | Standard, Round Top, Heavy Duty Round Top, Anti-Climb |
| Material | Metal, Others |
| End User | Commercial, Residential, Industrial, Others |
| Sales Channel | Online Retailers, Bricks &Mortar Stores, Direct Sales |
| Regions Covered | North America, Latin America, Western Europe, Eastern Europe, East Asia, South Asia Pacific, Middle East &Africa |
| Countries Covered | United States, Canada, Germany, United Kingdom, France, China, Japan, Brazil, India and 40+ countries |
| Key Companies Profiled | Security Fence Company, Quickfence, Jinbiao Wire Mesh Fence Co., Ltd., Anping County YongMing Wire Mesh Fencing Co., Ltd., Jacksons Fencing, Screw Fencing PTY Ltd., Fortressfencing.co.nz, Guangdong Golon New Material Co., Ltd., Zaun Ltd., and Zoyals International Metal Wire Mesh Co. Ltd. |
| Additional Attributes | Equipment sales by type and end user, regional demand trends, competitive landscape, technological advancements in lightweight materials, modular design development, smart technology integration, and operational efficiency optimization |
The global temporary fencing panels market is estimated to be valued at USD 3.7 billion in 2025.
The market size for the temporary fencing panels market is projected to reach USD 5.3 billion by 2035.
The temporary fencing panels market is expected to grow at a 3.7% CAGR between 2025 and 2035.
The key product types in temporary fencing panels market are standard, round top, heavy duty round top and anti-climb.
In terms of end user, commercial segment to command 45.4% share in the temporary fencing panels market in 2025.


Our Research Products

The "Full Research Suite" delivers actionable market intel, deep dives on markets or technologies, so clients act faster, cut risk, and unlock growth.

The Leaderboard benchmarks and ranks top vendors, classifying them as Established Leaders, Leading Challengers, or Disruptors & Challengers.

Locates where complements amplify value and substitutes erode it, forecasting net impact by horizon

We deliver granular, decision-grade intel: market sizing, 5-year forecasts, pricing, adoption, usage, revenue, and operational KPIs—plus competitor tracking, regulation, and value chains—across 60 countries broadly.

Spot the shifts before they hit your P&L. We track inflection points, adoption curves, pricing moves, and ecosystem plays to show where demand is heading, why it is changing, and what to do next across high-growth markets and disruptive tech

Real-time reads of user behavior. We track shifting priorities, perceptions of today’s and next-gen services, and provider experience, then pace how fast tech moves from trial to adoption, blending buyer, consumer, and channel inputs with social signals (#WhySwitch, #UX).

Partner with our analyst team to build a custom report designed around your business priorities. From analysing market trends to assessing competitors or crafting bespoke datasets, we tailor insights to your needs.
Supplier Intelligence
Discovery & Profiling
Capacity & Footprint
Performance & Risk
Compliance & Governance
Commercial Readiness
Who Supplies Whom
Scorecards & Shortlists
Playbooks & Docs
Category Intelligence
Definition & Scope
Demand & Use Cases
Cost Drivers
Market Structure
Supply Chain Map
Trade & Policy
Operating Norms
Deliverables
Buyer Intelligence
Account Basics
Spend & Scope
Procurement Model
Vendor Requirements
Terms & Policies
Entry Strategy
Pain Points & Triggers
Outputs
Pricing Analysis
Benchmarks
Trends
Should-Cost
Indexation
Landed Cost
Commercial Terms
Deliverables
Brand Analysis
Positioning & Value Prop
Share & Presence
Customer Evidence
Go-to-Market
Digital & Reputation
Compliance & Trust
KPIs & Gaps
Outputs
Full Research Suite comprises of:
Market outlook & trends analysis
Interviews & case studies
Strategic recommendations
Vendor profiles & capabilities analysis
5-year forecasts
8 regions and 60+ country-level data splits
Market segment data splits
12 months of continuous data updates
DELIVERED AS:
PDF EXCEL ONLINE
Competitive Landscape of Temporary Fencing Panels Market Share
Temporary Storage Building Market Size and Share Forecast Outlook 2025 to 2035
Temporary Road Covers Market Size and Share Forecast Outlook 2025 to 2035
Temporary Bonding Adhesives Market Size and Share Forecast Outlook 2025 to 2035
Temporary Tattoos Market Size and Share Forecast Outlook 2025 to 2035
Market Share Breakdown of Temporary Storage Building Providers
Temporary Pacing Leads Market Trends – Growth & Forecast 2024-2034
Geofencing Market Size and Share Forecast Outlook 2025 to 2035
Airfield Fencing Market Insights by Material, Height, Product Type, and Region through 2035
Clean Room Panels Market Size and Share Forecast Outlook 2025 to 2035
Intelligent Fencing Market Size and Share Forecast Outlook 2025 to 2035
Horse Corral Panels Market Size and Share Forecast Outlook 2025 to 2035
Cattle Feeder Panels Market Size and Share Forecast Outlook 2025 to 2035
Electrical Sub Panels Market Size and Share Forecast Outlook 2025 to 2035
Aircraft Floor Panels Market Size and Share Forecast Outlook 2025 to 2035
Wire Livestock Panels Market Size and Share Forecast Outlook 2025 to 2035
Aerospace Floor Panels Market Size and Share Forecast Outlook 2025 to 2035
OLED Lightening Panels Market
Vacuum Insulation Panels Market Size and Share Forecast Outlook 2025 to 2035
Aluminum Honeycomb Panels Market Size and Share Forecast Outlook 2025 to 2035

Thank you!
You will receive an email from our Business Development Manager. Please be sure to check your SPAM/JUNK folder too.
Chat With
MaRIA