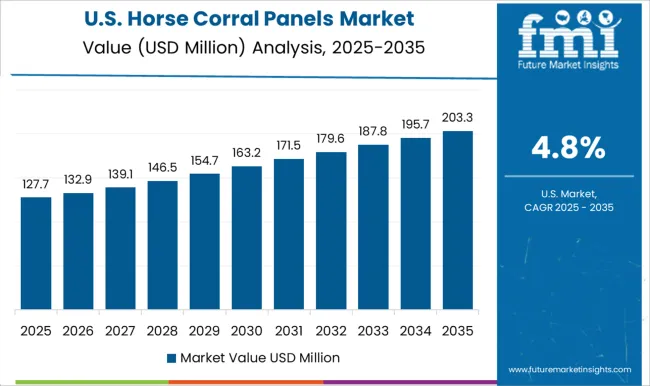
Horse Corral Panels Market
Horse Corral Panel Highlights the Safe Fencing and Animal Management System: FMI Analyzes Industry Trends in More than 30 Countries
Horse Corral Panels Market by Size, Number of Panel, Material & Region – Forecast 2023–2033
Horse Corral Panels Market Outlook 2023–2033
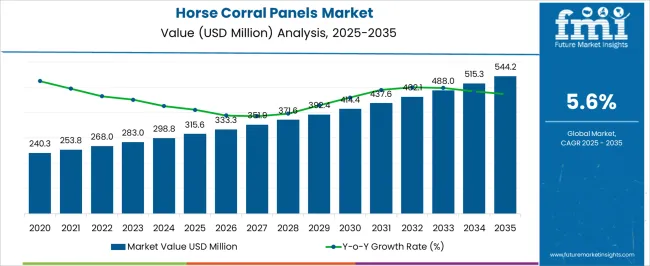
A consistent CAGR of 5.6% is predicted for the sector by 2033. According to FMI, the revenue share of the horse corral panels market is anticipated to increase from US$ 283 million in 2023 to US$ 488 million by 2033.
The market for horse corral panels is propelled by escalating demand for horse safety, expanding horse-riding occasions, and expanding recreational activity demand. Due to their capacity to securely hold and divide horses from one another, horse corral panels have gained popularity among owners and trainers.
As corral panels offer a secure habitat for horses that are young or inexperienced, owners are encouraged to spend more on horse corral panels. Furthermore, the panels can be easily installed and removed, thereby providing convenience and flexibility to horse owners.
- The American Veterinary Medical Association reports that between 2009 and 2018, there were 64% fewer injuries and fatalities involving horses.
- While the number of non-fatal accidents involving horses declined by 63 percent, the number of fatal accidents involving horses decreased by 67 percent.
- Improved safety measures, such as horse corral panels, are responsible for the decline in horse-related accidents and fatalities.
Cost-effective solutions for containing horses, as compared to other traditional containment methods, support the corral panels market share. Additionally, the demand for horse corral panels is high due to the increasing need for horse fence solutions and development of creative fencing solutions.
- Manufacturers of horse corral panels see numerous prospects as a result of the increase in demand for dependable and safe fencing systems.
- The market has been boosted by the introduction of a number of new materials, like plastic and aluminum, which have improved the durability and cost-effectiveness of the panels.
Attributes |
Details |
Horse Corral Panels Market CAGR (2023-2033) |
5.6% |
Horse Corral Panels Market Size (2023) |
US$ 283 million |
Horse Corral Panels Market Size (2033) |
US$ 488 million |
Let us know your requirement to get
100% FREE customization
Analysis of the Remodeling of Horse Corral Panels: 2016-2022 v/s 2023-2033
When compared to the 5.6% CAGR recorded between 2016 and 2022, the horse corral panels business is predicted to expand at a 5% CAGR between 2023 and 2033. The average growth of the market is expected to be approx 82% between 2022 and 2033.
Year | Market Value |
2016 | US$ 199.8 million |
2021 | US$ 255.2 million |
2022 | US$ 268 million |
The popularity of horse racing, showjumping, and other equestrian activities is expected to increase by 2033, especially in industrialized nations. This encourages the industry leaders to look out for fresh perspectives and add new features to the product line.
Short-term Growth (2023-2026): the sales of horse corral panels is expanding as a result of the growing demand for environmentally friendly solutions.
Medium-term Growth (2027-2029): Horse corral systems are increasingly using automated feeders and water troughs to boost productivity and cut labor costs. Automation is expected to make the market more attractive during the forecast period.
Long-term Growth (2030-2033): panel design and material advancements are anticipated to open up new business prospects for key players of the horse corral panels industry.
These factors are likely to cause the horse corral panels businesses to grow 1.72X between 2023 and 2033. By the end of 2033, according to FMI analysts, the market is predicted to be valued US$ 488 million.
Commercial Sector Benefiting the Horse Corral Panels Manufacturers
Commercial sector expansion, rise in horse-related activities, and high demand for durable fence choices are the key growth factors of the horse corral panels industry. Due to its numerous uses as fencing, containment, and training devices, demand for horse corral panels is high in the commercial market.
The adoption of horse corral panels in the commercial sector is expanding as a result of an increase in horse owners and the popularity of equine sports. The market share is anticipated to be further fueled by the introduction of new materials and designs.
Horse corral panels companies are expected to profit from technological advancements, including the development of sophisticated and automated management systems. In order to protect both horses and riders, horse corral panels provide a secure setting for equestrian riding, as well as for storing and transporting horses.
Find your sweet spots for generating winning opportunities in this market.
Talk to AnalystComparative View of Horse Corral Panels Market
Attributes |
Horse Corral Panels Market |
CAGR (2023-2033) |
5.6% |
Market Value (2033) |
US$ 488 million |
Growth Factor |
Concern for animal safety |
Opportunity |
Introduction of innovative fencing |
Key Trends |
Rising horse riding events |
Attributes |
Animal Feeding Equipment Market |
CAGR (2023-2033) |
3.2% |
Market Value (2033) |
US$ 531.29 billion |
Growth Factor |
Rising awareness about animal health |
Opportunity |
Surging demand for animal-based products |
Key Trends |
Growing pet ownership |
Attributes |
Cattle Feeder Market |
CAGR (2023-2033) |
3.5% |
Market Value (2033) |
US$ 4,240 million |
Growth Factor |
Increased demand for food additives |
Opportunity |
Growing beef sector |
Key Trends |
Meat protein demand |
Category Analysis
Which are the Leading Segments in the Horse Corral Panels Industry?
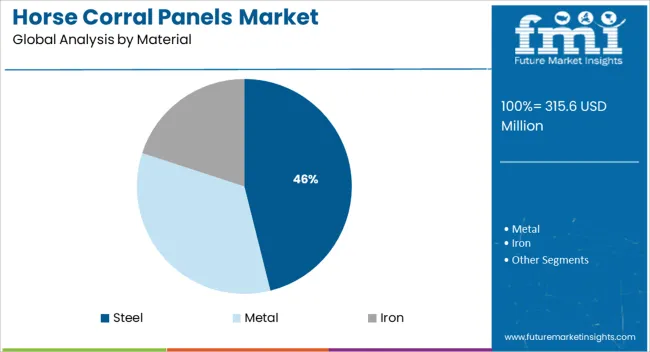
- By Material- Steel holds the largest market share in the horse corral panels market. Steel is the most often used substance, as it is powerful, long-lasting, and affordable.
Additionally, it is simple to maintain and may be tailored to meet specific requirements, which contribute to its greater demand. Also, steel is the most widely utilized material, other materials like aluminum, vinyl, wood, and mesh are also employed.
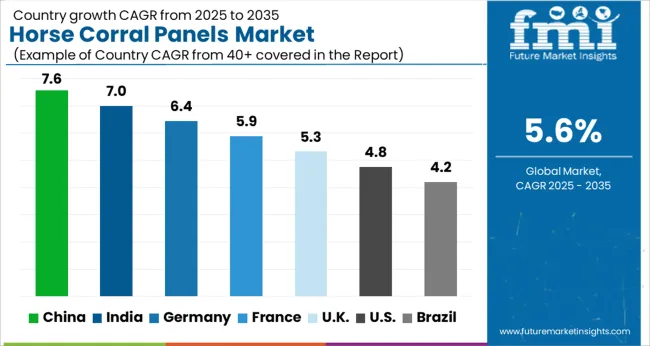
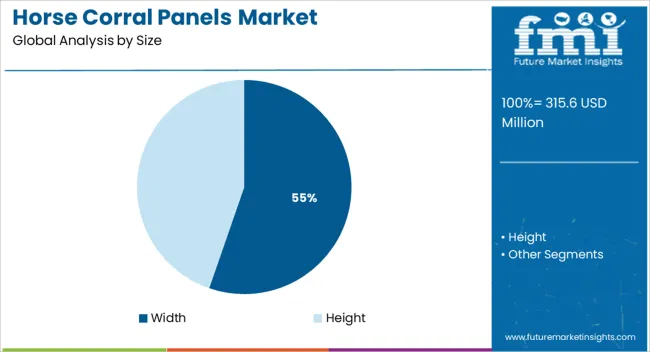
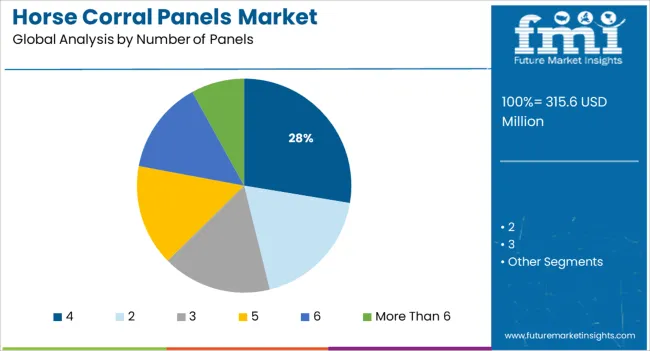
- By Number of Panels- The horse corral panel size segment with the highest market share is 5–10 ft in length. As it is simple to use to create temporary or semi-permanent enclosures, this size is said to be the most popular for horse corral panels. Additionally, corral panels that are between 5-10 ft long are practical, since they reduce the amount of panels required to construct an enclosure.

A unified Market Research Subscription Platform, built for today's disparate research needs.
Region Analysis
Country |
Market Value (2022) |
US |
US$ 77.1 million |
UK |
US$ 24.9 million |
China |
US$ 27.62 million |
Australia |
US$ 6.8 million |
Germany |
US$ 42.8 million |
Japan |
US$ 12.7 million |
India |
US$ 10.9 million |
US Animal Management Solutions Correlated to the Horse Corral Panels Sales Growth
According to data from the US Department of Agriculture (USDA), there were over 9 million horses in the nation in 2018. As the demand for horse corral panels rises, this number is anticipated to climb.
The US market for horse corral panels had a share of 28.8% in 2022. The rising demand for horse-related items, such as horse corral panels, is the key factor driving the market. Other factors influencing the market expansion include the rising number of horse owners and the attractiveness of equine-related activities.
From 2023 to 2033, the US horse corral panels sector is anticipated to expand at a CAGR of 7.8%. The market is driven by the rising demand for safe and secure horse enclosures, as well as the expanding popularity of horse ownership in the US.
One of the big initiatives in 2020 was American Cattle Supply's introduction of "Eco-Friendly Horse Corral Panels." By utilizing recycled plastic and metal materials, this new product is intended to lessen the environmental impact of horse corral panels.
The business also has ambitions to add a variety of corral panels for several horse species to its product line. Additionally, a research team from the University of Arizona received funding from the US Department of Agriculture in 2021.
This is to create "Smart Corral Panels" that can recognize and react to the actions and movements of horses. Horses experience less stress, be safer, and work harder due to these panels.
Market Share for Horse Corral Panels in Europe: Achieving New Heights
UK Market Outlook
Attributes |
Statistics |
UK Market Value 2033 |
US$ 44.6 million |
UK Market Share (2023-2033) |
9.3% |
UK Market CAGR (2023-2033) |
6% |
The growing popularity of horse ownership and the rising demand for safe and secure enclosures are the major market drivers for horse corral panels in the UK. The increased popularity of indoor horse keeping is anticipated to increase the adoption of horse corral panels in the area.
Germany Market Outlook
Germany is developing significantly, with the market share of 15.7% in 2022. The demand for better living circumstances for horses, as well as the rising number of horse owners in Germany, are driving sales of horse corral panels.
The government's rules mandate that horse owners give their animals sufficient accommodation, even if it’s a temporary fix, maintaining the market adoption trends.
Asia Pacific to Invest Heavily in Horse Corral Panels Market
Country | China |
Market Share (2022) | 10.30% |
CAGR (2023-2033) | 4.50% |
Market Value (2033) | US$ 42.8 million |
Country | India |
Market Share (2022) | 4.10% |
CAGR (2023-2033) | 6.60% |
Market Value (2033) | US$ 21.7 million |
China Demands Massive Investment
The market share for horse corral panels in China is being supported by investments from private investors, venture capital firms, and governmental institutions. This has caused the launch of new goods and services, which has accelerated the profit margins.
Additionally, the Chinese government has implemented a number of policies to promote the growth of the market for horse corral panels, including tax breaks and manufacturer subsidies.
Indian Government Supports the Market Expansion
The Indian government's growing investments in the horse racing and equestrian sports sector are also anticipated to fuel market expansion. The government has made investments in brand-new stables, tracks, and other equestrian and horse racing-related infrastructure to support the global industry.
Boost in Japan Agriculture Sector
The market for horse corral panels in Japan is anticipated to expand further, with the share of 4.8% and worth of US$ 12.7 million in 2022. This is particularly true in the agricultural sector, where panels made from horse corrals are being used more frequently to confine cattle.
There are more opportunities for foreign investors to enter the Japanese horse corral panels market as the business grows. In the market, numerous foreign investors have already formed relationships with Japanese businesses. For those trying to break into the Japanese market, this is a particularly alluring prospect.
Competitive Landscape
Adoption of Horse Corral Panels Surging with the Constant Upgradation by Startups and Key Players
Companies in the market are vying for clients by providing cutting-edge goods, such as panels, with increased strength and durability, personalized designs, and modern materials. To stay ahead of the competition, businesses are also making significant investments in research and development.
Horse Corral Panels Startups Making New Improvements in the Business
- Equine corral panels are built and managed in a novel way with EquiCrate. Their galvanized steel modular panels have a distinctive shape that makes them simple to build and remove. They also offer a variety of add-ons, such as feeds, gates, and ramps, so you may customize the corral to one’s needs.
- Horse corral panels of the highest caliber are readily available from CorralKing. Their panels have a corrosion-resistant surface and are made of heavy-duty galvanized steel. Their panels are made to be simple to install and require little upkeep.
- A variety of horse corral panels and accessories are available from HorseGuard. Their panels have a non-rusting surface and a heavy-duty galvanized steel frame. One may personalize the corral to meet the needs by adding gates, panels, and feeders from the assortment of accessories that they include.
To safeguard the safety of horses, manufacturers of horse corral panels are implementing modern technologies, including electric fencing. In order to strengthen their position in the market and foster customer loyalty, businesses are also aggressively engaging in marketing initiatives and promotions.
- A new line of horse corral panels from Zareba, a top producer of electric fencing and animal management systems, has been created to keep horses safe. The panels are sturdy and rust-resistant, and their simple installation makes them perfect for either temporary or permanent corral designs.
- Behlen, a well-known producer of steel building goods, just unveiled a series of galvanized steel horse corral panels.
- Leading producer of horse corral panels is Gallagher. They provide everything from light, transportable panels to robust, long-lasting fencing alternatives. To accommodate the demands of every horse owner, they provide a wide range of sizes and styles.
Key players
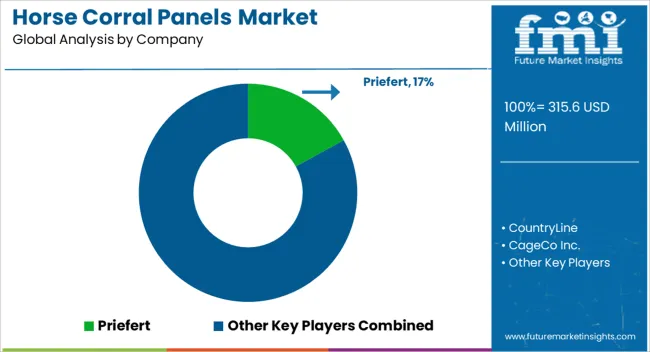
- Priefert
- CountryLine
- CageCo Inc.
- Hutchison-inc.com
- Red River Arenas
- Farm Ranch Store
- Cactus Horse Corrals
- WW Manufacturing
- Noble Panels
- Agri Supply
Key segments
By Size:
- Width
- 5-10 Ft
- 11-15 Ft
- 16-20 Ft
- Height
- 40-50 Inch
- Above 50 inch
By Number of Panels:
- 2
- 3
- 4
- 5
- 6
- More Than 6
By Material:
- Metal
- Steel
- Iron
By Region:
- North America
- Latin America
- Europe
- East Asia
- South Asia Pacific
- Middle East and Africa
Frequently Asked Questions
The horse corral panels market is estimated to be worth US$ 283 million in 2023.
The horse corral panels market is expected to have a CAGR of 5.6% by 2033.
The horse corral panels market expanded at a share of US$ 268 million in 2022.
North America accounted for 28.8% share in the horse corral panels market in 2022.
The UK accounts for 6% CAGR in the horse corral panels market by 2033.
Table of Content
1. Executive Summary
1.1. Global Market Outlook
1.2. Demand-side Trends
1.3. Supply-side Trends
1.4. Technology Roadmap Analysis
1.5. Analysis and Recommendations
2. Market Overview
2.1. Market Coverage / Taxonomy
2.2. Market Definition / Scope / Limitations
3. Market Background
3.1. Market Dynamics
3.1.1. Drivers
3.1.2. Restraints
3.1.3. Opportunity
3.1.4. Trends
3.2. Scenario Forecast
3.2.1. Demand in Optimistic Scenario
3.2.2. Demand in Likely Scenario
3.2.3. Demand in Conservative Scenario
3.3. Opportunity Map Analysis
3.4. Product Life Cycle Analysis
3.5. Supply Chain Analysis
3.5.1. Supply Side Participants and their Roles
3.5.1.1. Producers
3.5.1.2. Mid-Level Participants (Traders/ Agents/ Brokers)
3.5.1.3. Wholesalers and Distributors
3.5.2. Value Added and Value Created at Node in the Supply Chain
3.5.3. List of Raw Material Suppliers
3.5.4. List of Existing and Potential Buyer’s
3.6. Investment Feasibility Matrix
3.7. Value Chain Analysis
3.7.1. Profit Margin Analysis
3.7.2. Wholesalers and Distributors
3.7.3. Retailers
3.8. PESTLE and Porter’s Analysis
3.9. Regulatory Landscape
3.9.1. By Key Regions
3.9.2. By Key Countries
3.10. Regional Parent Market Outlook
3.11. Production and Consumption Statistics
3.12. Import and Export Statistics
4. Global Market Analysis 2018-2022 and Forecast, 2023-2033
4.1. Historical Market Size Value (US$ Mn) & Volume (Units) Analysis, 2018-2022
4.2. Current and Future Market Size Value (US$ Mn) & Volume (Units) Projections, 2023-2033
4.2.1. Y-o-Y Growth Trend Analysis
4.2.2. Absolute $ Opportunity Analysis
5. Global Market Analysis 2018-2022 and Forecast 2023-2033, By Panel Type
5.1. Introduction / Key Findings
5.2. Historical Market Size Value (US$ Mn) & Volume (Units) Analysis By Panel Type, 2018-2022
5.3. Current and Future Market Size Value (US$ Mn) & Volume (Units) Analysis and Forecast By Panel Type, 2023-2033
5.3.1. Wire Panels
5.3.2. Wire Filled Panels
5.3.3. Galvanized Panels
5.3.3.1. 6 Rail Galvanized Panels
5.3.3.2. 5 Rail Galvanized Panels
5.3.3.3. 4 Rail Galvanized Panels
5.4. Y-o-Y Growth Trend Analysis By Panel Type, 2018-2022
5.5. Absolute $ Opportunity Analysis By Panel Type, 2023-2033
6. Global Market Analysis 2018-2022 and Forecast 2023-2033, By Fencing Type
6.1. Introduction / Key Findings
6.2. Historical Market Size Value (US$ Mn) & Volume (Units) Analysis By Fencing Type, 2018-2022
6.3. Current and Future Market Size Value (US$ Mn) & Volume (Units) Analysis and Forecast By Fencing Type, 2023-2033
6.3.1. Portable
6.3.2. Stationary
6.4. Y-o-Y Growth Trend Analysis By Fencing Type, 2018-2022
6.5. Absolute $ Opportunity Analysis By Fencing Type, 2023-2033
7. Global Market Analysis 2018-2022 and Forecast 2023-2033, By Application
7.1. Introduction / Key Findings
7.2. Historical Market Size Value (US$ Mn) & Volume (Units) Analysis By Application, 2018-2022
7.3. Current and Future Market Size Value (US$ Mn) & Volume (Units) Analysis and Forecast By Application, 2023-2033
7.3.1. Farm Houses
7.3.2. Race Courses
7.4. Y-o-Y Growth Trend Analysis By Application, 2018-2022
7.5. Absolute $ Opportunity Analysis By Application, 2023-2033
8. Global Market Analysis 2018-2022 and Forecast 2023-2033, By Region
8.1. Introduction
8.2. Historical Market Size Value (US$ Mn) & Volume (Units) Analysis By Region, 2018-2022
8.3. Current Market Size Value (US$ Mn) & Volume (Units) Analysis and Forecast By Region, 2023-2033
8.3.1. North America
8.3.2. Latin America
8.3.3. Europe
8.3.4. Asia Pacific
8.3.5. MEA
8.4. Market Attractiveness Analysis By Region
9. North America Market Analysis 2018-2022 and Forecast 2023-2033, By Country
9.1. Historical Market Size Value (US$ Mn) & Volume (Units) Trend Analysis By Market Taxonomy, 2018-2022
9.2. Market Size Value (US$ Mn) & Volume (Units) Forecast By Market Taxonomy, 2023-2033
9.2.1. By Country
9.2.1.1. U.S.
9.2.1.2. Canada
9.2.2. By Panel Type
9.2.3. By Fencing Type
9.2.4. By Application
9.3. Market Attractiveness Analysis
9.3.1. By Country
9.3.2. By Panel Type
9.3.3. By Fencing Type
9.3.4. By Application
9.4. Key Takeaways
10. Latin America Market Analysis 2018-2022 and Forecast 2023-2033, By Country
10.1. Historical Market Size Value (US$ Mn) & Volume (Units) Trend Analysis By Market Taxonomy, 2018-2022
10.2. Market Size Value (US$ Mn) & Volume (Units) Forecast By Market Taxonomy, 2023-2033
10.2.1. By Country
10.2.1.1. Brazil
10.2.1.2. Mexico
10.2.1.3. Rest of Latin America
10.2.2. By Panel Type
10.2.3. By Fencing Type
10.2.4. By Application
10.3. Market Attractiveness Analysis
10.3.1. By Country
10.3.2. By Panel Type
10.3.3. By Fencing Type
10.3.4. By Application
10.4. Key Takeaways
11. Europe Market Analysis 2018-2022 and Forecast 2023-2033, By Country
11.1. Historical Market Size Value (US$ Mn) & Volume (Units) Trend Analysis By Market Taxonomy, 2018-2022
11.2. Market Size Value (US$ Mn) & Volume (Units) Forecast By Market Taxonomy, 2023-2033
11.2.1. By Country
11.2.1.1. Germany
11.2.1.2. U.K.
11.2.1.3. France
11.2.1.4. Spain
11.2.1.5. Italy
11.2.1.6. Rest of Europe
11.2.2. By Panel Type
11.2.3. By Fencing Type
11.2.4. By Application
11.3. Market Attractiveness Analysis
11.3.1. By Country
11.3.2. By Panel Type
11.3.3. By Fencing Type
11.3.4. By Application
11.4. Key Takeaways
12. Asia Pacific Market Analysis 2018-2022 and Forecast 2023-2033, By Country
12.1. Historical Market Size Value (US$ Mn) & Volume (Units) Trend Analysis By Market Taxonomy, 2018-2022
12.2. Market Size Value (US$ Mn) & Volume (Units) Forecast By Market Taxonomy, 2023-2033
12.2.1. By Country
12.2.1.1. China
12.2.1.2. Japan
12.2.1.3. South Korea
12.2.1.4. Singapore
12.2.1.5. Thailand
12.2.1.6. Indonesia
12.2.1.7. Australia
12.2.1.8. New Zealand
12.2.1.9. Rest of Asia Pacific
12.2.2. By Panel Type
12.2.3. By Fencing Type
12.2.4. By Application
12.3. Market Attractiveness Analysis
12.3.1. By Country
12.3.2. By Panel Type
12.3.3. By Fencing Type
12.3.4. By Application
12.4. Key Takeaways
13. MEA Market Analysis 2018-2022 and Forecast 2023-2033, By Country
13.1. Historical Market Size Value (US$ Mn) & Volume (Units) Trend Analysis By Market Taxonomy, 2018-2022
13.2. Market Size Value (US$ Mn) & Volume (Units) Forecast By Market Taxonomy, 2023-2033
13.2.1. By Country
13.2.1.1. GCC Countries
13.2.1.2. South Africa
13.2.1.3. Israel
13.2.1.4. Rest of MEA
13.2.2. By Panel Type
13.2.3. By Fencing Type
13.2.4. By Application
13.3. Market Attractiveness Analysis
13.3.1. By Country
13.3.2. By Panel Type
13.3.3. By Fencing Type
13.3.4. By Application
13.4. Key Takeaways
14. Key Countries Market Analysis
14.1. U.S.
14.1.1. Pricing Analysis
14.1.2. Market Share Analysis, 2022
14.1.2.1. By Panel Type
14.1.2.2. By Fencing Type
14.1.2.3. By Application
14.2. Canada
14.2.1. Pricing Analysis
14.2.2. Market Share Analysis, 2022
14.2.2.1. By Panel Type
14.2.2.2. By Fencing Type
14.2.2.3. By Application
14.3. Brazil
14.3.1. Pricing Analysis
14.3.2. Market Share Analysis, 2022
14.3.2.1. By Panel Type
14.3.2.2. By Fencing Type
14.3.2.3. By Application
14.4. Mexico
14.4.1. Pricing Analysis
14.4.2. Market Share Analysis, 2022
14.4.2.1. By Panel Type
14.4.2.2. By Fencing Type
14.4.2.3. By Application
14.5. Germany
14.5.1. Pricing Analysis
14.5.2. Market Share Analysis, 2022
14.5.2.1. By Panel Type
14.5.2.2. By Fencing Type
14.5.2.3. By Application
14.6. U.K.
14.6.1. Pricing Analysis
14.6.2. Market Share Analysis, 2022
14.6.2.1. By Panel Type
14.6.2.2. By Fencing Type
14.6.2.3. By Application
14.7. France
14.7.1. Pricing Analysis
14.7.2. Market Share Analysis, 2022
14.7.2.1. By Panel Type
14.7.2.2. By Fencing Type
14.7.2.3. By Application
14.8. Spain
14.8.1. Pricing Analysis
14.8.2. Market Share Analysis, 2022
14.8.2.1. By Panel Type
14.8.2.2. By Fencing Type
14.8.2.3. By Application
14.9. Italy
14.9.1. Pricing Analysis
14.9.2. Market Share Analysis, 2022
14.9.2.1. By Panel Type
14.9.2.2. By Fencing Type
14.9.2.3. By Application
14.10. China
14.10.1. Pricing Analysis
14.10.2. Market Share Analysis, 2022
14.10.2.1. By Panel Type
14.10.2.2. By Fencing Type
14.10.2.3. By Application
14.11. Japan
14.11.1. Pricing Analysis
14.11.2. Market Share Analysis, 2022
14.11.2.1. By Panel Type
14.11.2.2. By Fencing Type
14.11.2.3. By Application
14.12. South Korea
14.12.1. Pricing Analysis
14.12.2. Market Share Analysis, 2022
14.12.2.1. By Panel Type
14.12.2.2. By Fencing Type
14.12.2.3. By Application
14.13. Singapore
14.13.1. Pricing Analysis
14.13.2. Market Share Analysis, 2022
14.13.2.1. By Panel Type
14.13.2.2. By Fencing Type
14.13.2.3. By Application
14.14. Thailand
14.14.1. Pricing Analysis
14.14.2. Market Share Analysis, 2022
14.14.2.1. By Panel Type
14.14.2.2. By Fencing Type
14.14.2.3. By Application
14.15. Indonesia
14.15.1. Pricing Analysis
14.15.2. Market Share Analysis, 2022
14.15.2.1. By Panel Type
14.15.2.2. By Fencing Type
14.15.2.3. By Application
14.16. Australia
14.16.1. Pricing Analysis
14.16.2. Market Share Analysis, 2022
14.16.2.1. By Panel Type
14.16.2.2. By Fencing Type
14.16.2.3. By Application
14.17. New Zealand
14.17.1. Pricing Analysis
14.17.2. Market Share Analysis, 2022
14.17.2.1. By Panel Type
14.17.2.2. By Fencing Type
14.17.2.3. By Application
14.18. GCC Countries
14.18.1. Pricing Analysis
14.18.2. Market Share Analysis, 2022
14.18.2.1. By Panel Type
14.18.2.2. By Fencing Type
14.18.2.3. By Application
14.19. South Africa
14.19.1. Pricing Analysis
14.19.2. Market Share Analysis, 2022
14.19.2.1. By Panel Type
14.19.2.2. By Fencing Type
14.19.2.3. By Application
14.20. Israel
14.20.1. Pricing Analysis
14.20.2. Market Share Analysis, 2022
14.20.2.1. By Panel Type
14.20.2.2. By Fencing Type
14.20.2.3. By Application
15. Market Structure Analysis
15.1. Competition Dashboard
15.2. Competition Benchmarking
15.3. Market Share Analysis of Top Players
15.3.1. By Regional
15.3.2. By Panel Type
15.3.3. By Fencing Type
15.3.4. By Application
16. Competition Analysis
16.1. Competition Deep Dive
16.1.1. Kovac Ranch Equipment
16.1.1.1. Overview
16.1.1.2. Product Portfolio
16.1.1.3. Profitability by Market Segments
16.1.1.4. Sales Footprint
16.1.1.5. Strategy Overview
16.1.1.5.1. Marketing Strategy
16.1.1.5.2. Product Strategy
16.1.1.5.3. Channel Strategy
16.1.2. Cactus Horse Corrals
16.1.2.1. Overview
16.1.2.2. Product Portfolio
16.1.2.3. Profitability by Market Segments
16.1.2.4. Sales Footprint
16.1.2.5. Strategy Overview
16.1.2.5.1. Marketing Strategy
16.1.2.5.2. Product Strategy
16.1.2.5.3. Channel Strategy
16.1.3. Arrowquip
16.1.3.1. Overview
16.1.3.2. Product Portfolio
16.1.3.3. Profitability by Market Segments
16.1.3.4. Sales Footprint
16.1.3.5. Strategy Overview
16.1.3.5.1. Marketing Strategy
16.1.3.5.2. Product Strategy
16.1.3.5.3. Channel Strategy
16.1.4. Sharpe Farm Supplies
16.1.4.1. Overview
16.1.4.2. Product Portfolio
16.1.4.3. Profitability by Market Segments
16.1.4.4. Sales Footprint
16.1.4.5. Strategy Overview
16.1.4.5.1. Marketing Strategy
16.1.4.5.2. Product Strategy
16.1.4.5.3. Channel Strategy
16.1.5. Runnings
16.1.5.1. Overview
16.1.5.2. Product Portfolio
16.1.5.3. Profitability by Market Segments
16.1.5.4. Sales Footprint
16.1.5.5. Strategy Overview
16.1.5.5.1. Marketing Strategy
16.1.5.5.2. Product Strategy
16.1.5.5.3. Channel Strategy
16.1.6. Kodiak Led
16.1.6.1. Overview
16.1.6.2. Product Portfolio
16.1.6.3. Profitability by Market Segments
16.1.6.4. Sales Footprint
16.1.6.5. Strategy Overview
16.1.6.5.1. Marketing Strategy
16.1.6.5.2. Product Strategy
16.1.6.5.3. Channel Strategy
16.1.7. EDGE Wholesale Direct
16.1.7.1. Overview
16.1.7.2. Product Portfolio
16.1.7.3. Profitability by Market Segments
16.1.7.4. Sales Footprint
16.1.7.5. Strategy Overview
16.1.7.5.1. Marketing Strategy
16.1.7.5.2. Product Strategy
16.1.7.5.3. Channel Strategy
16.1.8. Wirefence
16.1.8.1. Overview
16.1.8.2. Product Portfolio
16.1.8.3. Profitability by Market Segments
16.1.8.4. Sales Footprint
16.1.8.5. Strategy Overview
16.1.8.5.1. Marketing Strategy
16.1.8.5.2. Product Strategy
16.1.8.5.3. Channel Strategy
16.1.9. Cherry Industrial
16.1.9.1. Overview
16.1.9.2. Product Portfolio
16.1.9.3. Profitability by Market Segments
16.1.9.4. Sales Footprint
16.1.9.5. Strategy Overview
16.1.9.5.1. Marketing Strategy
16.1.9.5.2. Product Strategy
16.1.9.5.3. Channel Strategy
16.1.10. Real Tuff
16.1.10.1. Overview
16.1.10.2. Product Portfolio
16.1.10.3. Profitability by Market Segments
16.1.10.4. Sales Footprint
16.1.10.5. Strategy Overview
16.1.10.5.1. Marketing Strategy
16.1.10.5.2. Product Strategy
16.1.10.5.3. Channel Strategy
17. Assumptions & Acronyms Used
18. Research Methodology
Let us know your requirement to get
100% FREE customization
List of Tables
Table 1: Global Market Value (US$ Mn) Forecast by Region, 2018-2033
Table 2: Global Market Volume (Units) Forecast by Region, 2018-2033
Table 3: Global Market Value (US$ Mn) Forecast by Panel Type, 2018-2033
Table 4: Global Market Volume (Units) Forecast by Panel Type, 2018-2033
Table 5: Global Market Value (US$ Mn) Forecast by Fencing Type, 2018-2033
Table 6: Global Market Volume (Units) Forecast by Fencing Type, 2018-2033
Table 7: Global Market Value (US$ Mn) Forecast by Application, 2018-2033
Table 8: Global Market Volume (Units) Forecast by Application, 2018-2033
Table 9: North America Market Value (US$ Mn) Forecast by Country, 2018-2033
Table 10: North America Market Volume (Units) Forecast by Country, 2018-2033
Table 11: North America Market Value (US$ Mn) Forecast by Panel Type, 2018-2033
Table 12: North America Market Volume (Units) Forecast by Panel Type, 2018-2033
Table 13: North America Market Value (US$ Mn) Forecast by Fencing Type, 2018-2033
Table 14: North America Market Volume (Units) Forecast by Fencing Type, 2018-2033
Table 15: North America Market Value (US$ Mn) Forecast by Application, 2018-2033
Table 16: North America Market Volume (Units) Forecast by Application, 2018-2033
Table 17: Latin America Market Value (US$ Mn) Forecast by Country, 2018-2033
Table 18: Latin America Market Volume (Units) Forecast by Country, 2018-2033
Table 19: Latin America Market Value (US$ Mn) Forecast by Panel Type, 2018-2033
Table 20: Latin America Market Volume (Units) Forecast by Panel Type, 2018-2033
Table 21: Latin America Market Value (US$ Mn) Forecast by Fencing Type, 2018-2033
Table 22: Latin America Market Volume (Units) Forecast by Fencing Type, 2018-2033
Table 23: Latin America Market Value (US$ Mn) Forecast by Application, 2018-2033
Table 24: Latin America Market Volume (Units) Forecast by Application, 2018-2033
Table 25: Europe Market Value (US$ Mn) Forecast by Country, 2018-2033
Table 26: Europe Market Volume (Units) Forecast by Country, 2018-2033
Table 27: Europe Market Value (US$ Mn) Forecast by Panel Type, 2018-2033
Table 28: Europe Market Volume (Units) Forecast by Panel Type, 2018-2033
Table 29: Europe Market Value (US$ Mn) Forecast by Fencing Type, 2018-2033
Table 30: Europe Market Volume (Units) Forecast by Fencing Type, 2018-2033
Table 31: Europe Market Value (US$ Mn) Forecast by Application, 2018-2033
Table 32: Europe Market Volume (Units) Forecast by Application, 2018-2033
Table 33: Asia Pacific Market Value (US$ Mn) Forecast by Country, 2018-2033
Table 34: Asia Pacific Market Volume (Units) Forecast by Country, 2018-2033
Table 35: Asia Pacific Market Value (US$ Mn) Forecast by Panel Type, 2018-2033
Table 36: Asia Pacific Market Volume (Units) Forecast by Panel Type, 2018-2033
Table 37: Asia Pacific Market Value (US$ Mn) Forecast by Fencing Type, 2018-2033
Table 38: Asia Pacific Market Volume (Units) Forecast by Fencing Type, 2018-2033
Table 39: Asia Pacific Market Value (US$ Mn) Forecast by Application, 2018-2033
Table 40: Asia Pacific Market Volume (Units) Forecast by Application, 2018-2033
Table 41: MEA Market Value (US$ Mn) Forecast by Country, 2018-2033
Table 42: MEA Market Volume (Units) Forecast by Country, 2018-2033
Table 43: MEA Market Value (US$ Mn) Forecast by Panel Type, 2018-2033
Table 44: MEA Market Volume (Units) Forecast by Panel Type, 2018-2033
Table 45: MEA Market Value (US$ Mn) Forecast by Fencing Type, 2018-2033
Table 46: MEA Market Volume (Units) Forecast by Fencing Type, 2018-2033
Table 47: MEA Market Value (US$ Mn) Forecast by Application, 2018-2033
Table 48: MEA Market Volume (Units) Forecast by Application, 2018-2033
Find your sweet spots for generating winning opportunities in this market.
Talk to AnalystList of Charts
Figure 1: Global Market Value (US$ Mn) by Panel Type, 2023-2033
Figure 2: Global Market Value (US$ Mn) by Fencing Type, 2023-2033
Figure 3: Global Market Value (US$ Mn) by Application, 2023-2033
Figure 4: Global Market Value (US$ Mn) by Region, 2023-2033
Figure 5: Global Market Value (US$ Mn) Analysis by Region, 2018-2033
Figure 6: Global Market Volume (Units) Analysis by Region, 2018-2033
Figure 7: Global Market Value Share (%) and BPS Analysis by Region, 2023-2033
Figure 8: Global Market Y-o-Y Growth (%) Projections by Region, 2023-2033
Figure 9: Global Market Value (US$ Mn) Analysis by Panel Type, 2018-2033
Figure 10: Global Market Volume (Units) Analysis by Panel Type, 2018-2033
Figure 11: Global Market Value Share (%) and BPS Analysis by Panel Type, 2023-2033
Figure 12: Global Market Y-o-Y Growth (%) Projections by Panel Type, 2023-2033
Figure 13: Global Market Value (US$ Mn) Analysis by Fencing Type, 2018-2033
Figure 14: Global Market Volume (Units) Analysis by Fencing Type, 2018-2033
Figure 15: Global Market Value Share (%) and BPS Analysis by Fencing Type, 2023-2033
Figure 16: Global Market Y-o-Y Growth (%) Projections by Fencing Type, 2023-2033
Figure 17: Global Market Value (US$ Mn) Analysis by Application, 2018-2033
Figure 18: Global Market Volume (Units) Analysis by Application, 2018-2033
Figure 19: Global Market Value Share (%) and BPS Analysis by Application, 2023-2033
Figure 20: Global Market Y-o-Y Growth (%) Projections by Application, 2023-2033
Figure 21: Global Market Attractiveness by Panel Type, 2023-2033
Figure 22: Global Market Attractiveness by Fencing Type, 2023-2033
Figure 23: Global Market Attractiveness by Application, 2023-2033
Figure 24: Global Market Attractiveness by Region, 2023-2033
Figure 25: North America Market Value (US$ Mn) by Panel Type, 2023-2033
Figure 26: North America Market Value (US$ Mn) by Fencing Type, 2023-2033
Figure 27: North America Market Value (US$ Mn) by Application, 2023-2033
Figure 28: North America Market Value (US$ Mn) by Country, 2023-2033
Figure 29: North America Market Value (US$ Mn) Analysis by Country, 2018-2033
Figure 30: North America Market Volume (Units) Analysis by Country, 2018-2033
Figure 31: North America Market Value Share (%) and BPS Analysis by Country, 2023-2033
Figure 32: North America Market Y-o-Y Growth (%) Projections by Country, 2023-2033
Figure 33: North America Market Value (US$ Mn) Analysis by Panel Type, 2018-2033
Figure 34: North America Market Volume (Units) Analysis by Panel Type, 2018-2033
Figure 35: North America Market Value Share (%) and BPS Analysis by Panel Type, 2023-2033
Figure 36: North America Market Y-o-Y Growth (%) Projections by Panel Type, 2023-2033
Figure 37: North America Market Value (US$ Mn) Analysis by Fencing Type, 2018-2033
Figure 38: North America Market Volume (Units) Analysis by Fencing Type, 2018-2033
Figure 39: North America Market Value Share (%) and BPS Analysis by Fencing Type, 2023-2033
Figure 40: North America Market Y-o-Y Growth (%) Projections by Fencing Type, 2023-2033
Figure 41: North America Market Value (US$ Mn) Analysis by Application, 2018-2033
Figure 42: North America Market Volume (Units) Analysis by Application, 2018-2033
Figure 43: North America Market Value Share (%) and BPS Analysis by Application, 2023-2033
Figure 44: North America Market Y-o-Y Growth (%) Projections by Application, 2023-2033
Figure 45: North America Market Attractiveness by Panel Type, 2023-2033
Figure 46: North America Market Attractiveness by Fencing Type, 2023-2033
Figure 47: North America Market Attractiveness by Application, 2023-2033
Figure 48: North America Market Attractiveness by Country, 2023-2033
Figure 49: Latin America Market Value (US$ Mn) by Panel Type, 2023-2033
Figure 50: Latin America Market Value (US$ Mn) by Fencing Type, 2023-2033
Figure 51: Latin America Market Value (US$ Mn) by Application, 2023-2033
Figure 52: Latin America Market Value (US$ Mn) by Country, 2023-2033
Figure 53: Latin America Market Value (US$ Mn) Analysis by Country, 2018-2033
Figure 54: Latin America Market Volume (Units) Analysis by Country, 2018-2033
Figure 55: Latin America Market Value Share (%) and BPS Analysis by Country, 2023-2033
Figure 56: Latin America Market Y-o-Y Growth (%) Projections by Country, 2023-2033
Figure 57: Latin America Market Value (US$ Mn) Analysis by Panel Type, 2018-2033
Figure 58: Latin America Market Volume (Units) Analysis by Panel Type, 2018-2033
Figure 59: Latin America Market Value Share (%) and BPS Analysis by Panel Type, 2023-2033
Figure 60: Latin America Market Y-o-Y Growth (%) Projections by Panel Type, 2023-2033
Figure 61: Latin America Market Value (US$ Mn) Analysis by Fencing Type, 2018-2033
Figure 62: Latin America Market Volume (Units) Analysis by Fencing Type, 2018-2033
Figure 63: Latin America Market Value Share (%) and BPS Analysis by Fencing Type, 2023-2033
Figure 64: Latin America Market Y-o-Y Growth (%) Projections by Fencing Type, 2023-2033
Figure 65: Latin America Market Value (US$ Mn) Analysis by Application, 2018-2033
Figure 66: Latin America Market Volume (Units) Analysis by Application, 2018-2033
Figure 67: Latin America Market Value Share (%) and BPS Analysis by Application, 2023-2033
Figure 68: Latin America Market Y-o-Y Growth (%) Projections by Application, 2023-2033
Figure 69: Latin America Market Attractiveness by Panel Type, 2023-2033
Figure 70: Latin America Market Attractiveness by Fencing Type, 2023-2033
Figure 71: Latin America Market Attractiveness by Application, 2023-2033
Figure 72: Latin America Market Attractiveness by Country, 2023-2033
Figure 73: Europe Market Value (US$ Mn) by Panel Type, 2023-2033
Figure 74: Europe Market Value (US$ Mn) by Fencing Type, 2023-2033
Figure 75: Europe Market Value (US$ Mn) by Application, 2023-2033
Figure 76: Europe Market Value (US$ Mn) by Country, 2023-2033
Figure 77: Europe Market Value (US$ Mn) Analysis by Country, 2018-2033
Figure 78: Europe Market Volume (Units) Analysis by Country, 2018-2033
Figure 79: Europe Market Value Share (%) and BPS Analysis by Country, 2023-2033
Figure 80: Europe Market Y-o-Y Growth (%) Projections by Country, 2023-2033
Figure 81: Europe Market Value (US$ Mn) Analysis by Panel Type, 2018-2033
Figure 82: Europe Market Volume (Units) Analysis by Panel Type, 2018-2033
Figure 83: Europe Market Value Share (%) and BPS Analysis by Panel Type, 2023-2033
Figure 84: Europe Market Y-o-Y Growth (%) Projections by Panel Type, 2023-2033
Figure 85: Europe Market Value (US$ Mn) Analysis by Fencing Type, 2018-2033
Figure 86: Europe Market Volume (Units) Analysis by Fencing Type, 2018-2033
Figure 87: Europe Market Value Share (%) and BPS Analysis by Fencing Type, 2023-2033
Figure 88: Europe Market Y-o-Y Growth (%) Projections by Fencing Type, 2023-2033
Figure 89: Europe Market Value (US$ Mn) Analysis by Application, 2018-2033
Figure 90: Europe Market Volume (Units) Analysis by Application, 2018-2033
Figure 91: Europe Market Value Share (%) and BPS Analysis by Application, 2023-2033
Figure 92: Europe Market Y-o-Y Growth (%) Projections by Application, 2023-2033
Figure 93: Europe Market Attractiveness by Panel Type, 2023-2033
Figure 94: Europe Market Attractiveness by Fencing Type, 2023-2033
Figure 95: Europe Market Attractiveness by Application, 2023-2033
Figure 96: Europe Market Attractiveness by Country, 2023-2033
Figure 97: Asia Pacific Market Value (US$ Mn) by Panel Type, 2023-2033
Figure 98: Asia Pacific Market Value (US$ Mn) by Fencing Type, 2023-2033
Figure 99: Asia Pacific Market Value (US$ Mn) by Application, 2023-2033
Figure 100: Asia Pacific Market Value (US$ Mn) by Country, 2023-2033
Figure 101: Asia Pacific Market Value (US$ Mn) Analysis by Country, 2018-2033
Figure 102: Asia Pacific Market Volume (Units) Analysis by Country, 2018-2033
Figure 103: Asia Pacific Market Value Share (%) and BPS Analysis by Country, 2023-2033
Figure 104: Asia Pacific Market Y-o-Y Growth (%) Projections by Country, 2023-2033
Figure 105: Asia Pacific Market Value (US$ Mn) Analysis by Panel Type, 2018-2033
Figure 106: Asia Pacific Market Volume (Units) Analysis by Panel Type, 2018-2033
Figure 107: Asia Pacific Market Value Share (%) and BPS Analysis by Panel Type, 2023-2033
Figure 108: Asia Pacific Market Y-o-Y Growth (%) Projections by Panel Type, 2023-2033
Figure 109: Asia Pacific Market Value (US$ Mn) Analysis by Fencing Type, 2018-2033
Figure 110: Asia Pacific Market Volume (Units) Analysis by Fencing Type, 2018-2033
Figure 111: Asia Pacific Market Value Share (%) and BPS Analysis by Fencing Type, 2023-2033
Figure 112: Asia Pacific Market Y-o-Y Growth (%) Projections by Fencing Type, 2023-2033
Figure 113: Asia Pacific Market Value (US$ Mn) Analysis by Application, 2018-2033
Figure 114: Asia Pacific Market Volume (Units) Analysis by Application, 2018-2033
Figure 115: Asia Pacific Market Value Share (%) and BPS Analysis by Application, 2023-2033
Figure 116: Asia Pacific Market Y-o-Y Growth (%) Projections by Application, 2023-2033
Figure 117: Asia Pacific Market Attractiveness by Panel Type, 2023-2033
Figure 118: Asia Pacific Market Attractiveness by Fencing Type, 2023-2033
Figure 119: Asia Pacific Market Attractiveness by Application, 2023-2033
Figure 120: Asia Pacific Market Attractiveness by Country, 2023-2033
Figure 121: MEA Market Value (US$ Mn) by Panel Type, 2023-2033
Figure 122: MEA Market Value (US$ Mn) by Fencing Type, 2023-2033
Figure 123: MEA Market Value (US$ Mn) by Application, 2023-2033
Figure 124: MEA Market Value (US$ Mn) by Country, 2023-2033
Figure 125: MEA Market Value (US$ Mn) Analysis by Country, 2018-2033
Figure 126: MEA Market Volume (Units) Analysis by Country, 2018-2033
Figure 127: MEA Market Value Share (%) and BPS Analysis by Country, 2023-2033
Figure 128: MEA Market Y-o-Y Growth (%) Projections by Country, 2023-2033
Figure 129: MEA Market Value (US$ Mn) Analysis by Panel Type, 2018-2033
Figure 130: MEA Market Volume (Units) Analysis by Panel Type, 2018-2033
Figure 131: MEA Market Value Share (%) and BPS Analysis by Panel Type, 2023-2033
Figure 132: MEA Market Y-o-Y Growth (%) Projections by Panel Type, 2023-2033
Figure 133: MEA Market Value (US$ Mn) Analysis by Fencing Type, 2018-2033
Figure 134: MEA Market Volume (Units) Analysis by Fencing Type, 2018-2033
Figure 135: MEA Market Value Share (%) and BPS Analysis by Fencing Type, 2023-2033
Figure 136: MEA Market Y-o-Y Growth (%) Projections by Fencing Type, 2023-2033
Figure 137: MEA Market Value (US$ Mn) Analysis by Application, 2018-2033
Figure 138: MEA Market Volume (Units) Analysis by Application, 2018-2033
Figure 139: MEA Market Value Share (%) and BPS Analysis by Application, 2023-2033
Figure 140: MEA Market Y-o-Y Growth (%) Projections by Application, 2023-2033
Figure 141: MEA Market Attractiveness by Panel Type, 2023-2033
Figure 142: MEA Market Attractiveness by Fencing Type, 2023-2033
Figure 143: MEA Market Attractiveness by Application, 2023-2033
Figure 144: MEA Market Attractiveness by Country, 2023-2033
Need specific information?
Request CustomizationExplore Food and Beverage Insights
View Reports