Horse Grain Feeders Market
Reformation of Horse Feeding: Innovative Grain Feeders Take the Market by Storm! FMI Offers Exclusive Analysis of the Industry with a Focus on 30+ Countries with Great Investment Opportunities.
Horse Grain Feeders Market By Type, By Farm Type, Sales Channel & Region | Forecast 2023 to 2033
Horse Grain Feeders Market Outlook (2023 to 2033)
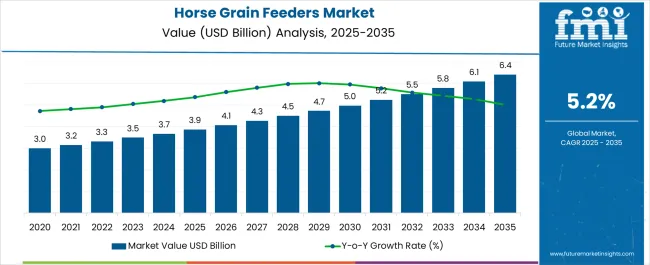
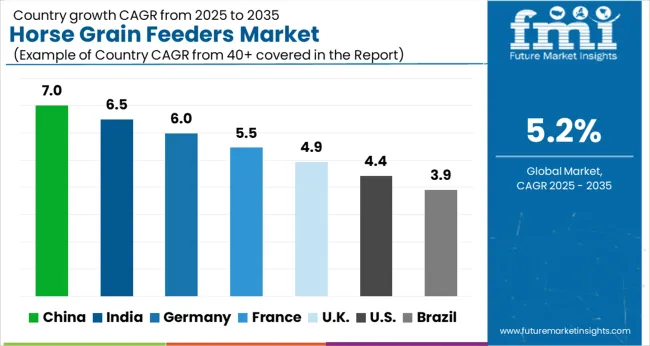
The global Horse Grain Feeders Market size is projected to be valued at US$ 3.49 billion in 2023 and is expected to hit around US$ 5.79 billion by 2033. Sales of horse grain feeders are expected to rise at a CAGR of 5.2% during the forecast period.
The horse grain feeders market is a niche market that caters to the needs of horse owners and breeders. These feeders come in various designs and styles, such as ground feeders, hay feeders, and automatic feeders. They are used to dispense grains and other feed to horses in a controlled manner, helping to reduce waste and keep the feeding area clean. Therefore, the adoption of these feeders among horse owners and breeders is rising as a result of their prolonged usage.
The industry is propelled by the growing demand for equine-related goods and services as well as the increasing acceptance of riding horses as a leisure activity. Another important aspect fueling the market is the increasing proliferation of horse racing and breeding industries. With the increasing popularity of horse breeding and riding as a hobby and sport, the demand for horse feeders is expected to rise.
One of the primary trends in the market is the growing popularity of automatic grain feeders. Horse owners and breeders prefer using these feeders since they are designed to dispense feed at specific intervals. This makes it easy for them to manage the feeding schedule of the horses. The adoption of these feeders is anticipated to increase as they become widely available and affordable too. Another trend that is driving market growth is the increasing focus on animal welfare. Horse owners are becoming more aware of the importance of providing their animals with proper nutrition and care, and this is driving demand for high-quality feeders that can help them meet these needs.
The market is highly competitive, with several manufacturers vying for market share. Certain manufacturers are introducing feeders with adjustable openings to accommodate different types of feed. Many manufacturers are also developing feeders with built-in cameras to allow owners to monitor their horses remotely. Therefore, the market is expected to see steady growth during the forecast period, boosted by advances in technology and the introduction of new products.
Attributes |
Details |
Horse Grain Feeders Market Value (2023) |
US$ 3.49 billion |
Horse Grain Feeders Market Expected Value (2033) |
US$ 5.79 billion |
Horse Grain Feeders Market Projected CAGR (2023 to 2033) |
5.2% |
Let us know your requirement to get
100% FREE customization
Outlook Scope of Horse Grain Feeders Market 2023 to 2033 Compared to 2016 to 2022
When compared to the 4.7% CAGR recorded between 2016 and 2022, the horse grain feeders market is predicted to expand at a 5.2% CAGR between 2023 and 2033.
2016 | US$ 2.52 billion |
2021 | US$ 3.16 billion |
2022 | US$ 3.31 billion |
2023 | US$ 3.49 billion |
2033 | US$ 5.79 billion |
The horse grain feeder market has grown steadily over the past few years, impelled by the increasing demand for horse-related products and services. In the early days, horse grain feeders were primarily made of wood and metal and were relatively simple in design. Over the years, the market has seen a steady rise in the adoption of automatic feeders.
Short Term (2023 to 2026) |
As the market has evolved, manufacturers have started to introduce more advanced designs and features. These feeders are likely to become increasingly popular among horse owners and breeders as they offer greater convenience and control over the entire feeding process. |
Medium Term (2026 to 2029) |
The use of automated feeders is increasing as they become more widely available and affordable. This has been driven by the growing focus on animal welfare and the need to provide horses with proper nutrition and care. This is expected to open up new opportunities for the market players. |
Long Term (2029 to 2033) |
Advancements in technology are also expected to force market expansion during this period. As technology continues to evolve, manufacturers are likely to introduce new designs like programmed feeders with IoT technology, which will be more convenient and efficient for horse owners and breeders. |
These factors are anticipated to support a 1.6X increase in the horse grain feeders market between 2023 and 2033. The market is projected to be worth US$ 5.79 billion by the end of 2033, according to FMI analysts
Highlighting the Horse Grain Feeders Market Key Drivers, Restraints, Opportunities and Threats
As a consequence of numerous significant factors that have been noticed, the global market is projected to grow considerably during the forecast period. FMI researchers examined possible threats, alluring possibilities, and limiting elements that can affect the sales of horse grain feeders in addition to the market's growth determinants.
Drivers |
|
Restraints |
|
Opportunities |
|
Threats |
|
Find your sweet spots for generating winning opportunities in this market.
Talk to AnalystComparative Analysis of Adjacent Horse Grain Feeders Market
Horse Grain Feeders Market:
Differentiating Aspects |
Horse Grain Feeders Market |
CAGR (2023 to 2033) |
5.2% |
Market Valuation in 2023 |
US$ 3.49 billion |
Projected Market Value in 2033 |
US$ 5.79 billion |
Growth Factors |
People are becoming more interested in horse ownership |
Opportunities |
Manufacturers are coming up with unique designs and added functionality |
Key Trends |
Promotion of natural foraging behavior to improve horse health |
Horse Feed Market:
Differentiating Aspects |
Horse Feed Market |
CAGR (2023 to 2033) |
4.8% |
Market Valuation in 2023 |
US$ 8.07 billion |
Projected Market Value in 2033 |
US$ 12.90 billion |
Growth Factors |
Increasing demand for high-quality feed that meets the dietary needs of horses |
Opportunities |
Development of innovative feed for specific performance levels such as racing or jumping |
Key Trends |
Rising focus on organic feed that contains non-GMO ingredients |
Equine Supplement Products Market:
Differentiating Aspects |
Equine Supplement Products Market |
CAGR (2023 to 2033) |
3.7% |
Market Valuation in 2023 |
US$ 84.31 million |
Projected Market Value in 2033 |
US$ 121.24 million |
Growth Factors |
The increasing popularity of equine sports and activities across the world |
Opportunities |
Advances in technology coupled with the development of specialized supplements |
Key Trends |
The growing tendency toward targeted supplements to address specific concerns |
Which Country Holds the Significant Share in the Horse Grain Feeders Market?
Country | United States of America |
Market Share (2022) | 30.4% |
Market Value (2022) | US$ 1,010.2 million |
Country | Germany |
Market Share (2022) | 17.9% |
Market Value (2022) | US$ 593.1 million |
Country | United Kingdom |
Market Share (2022) | 9.6% |
Market Value (2022) | US$ 318.2 million |
Country | China |
Market Share (2022) | 8.6% |
Market Value (2022) | US$ 284.33 million |
Country | Japan |
Market Share (2022) | 5.3% |
Market Value (2022) | US$ 176.3 million |
Country | India |
Market Share (2022) | 3.3% |
Market Value (2022) | US$ 108.3 million |
Riding the Wave of Growth: Horse Grain Feeder Industry in the USA is on the Rise
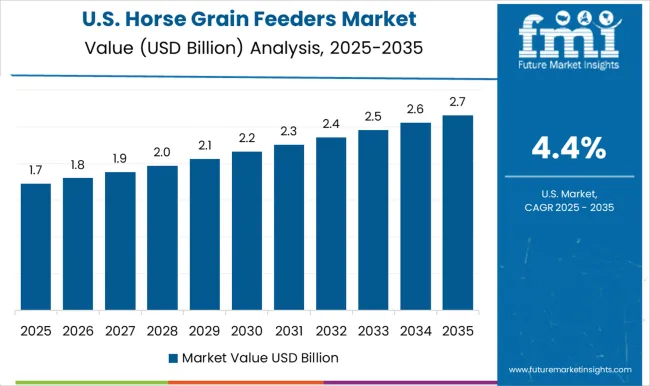
The market in the USA is a significant segment of the equine industry. Feeding grain to horses is a common practice among horse owners, as it provides a balanced diet and essential nutrients for their health and performance. In recent years, there has been a growing trend toward automatic feeders in the country. These are designed to dispense feed at specific intervals or in response to a horse’s proximity. Moreover, the country has an increasing demand for feeders that are easy to clean as well as durable.
The USA horse grain feeders market is also influenced by factors such as the state of the economy, the number of horse owners, and the popularity of horse riding. According to the American Horse Council, the horse industry is estimated to be US$ 122 billion in economic activity. Manufacturers in the USA are developing feeders that are made from sustainable materials, such as stainless steel or galvanized metal, to ensure longevity and safety. The primary reason behind this development is the horse owners’ fondness for sustainable ingredients over synthetic ones.
Horse Grain Feeder Industry in the United Kingdom Maintains Strong Performance
The United Kingdom's equine industry is a significant economic sector. The industry provides a wide range of services, including horse racing, breeding, showing, and leisure activities such as riding, carriage driving, and trekking. There are several horse grain feeders available in the United Kingdom market, including traditional troughs, bunk feeders, and automatic feeders. Certain key players in the market include Equestrian, Shires, and Horseware. In recent years, there has been a growing trend toward the adoption of automatic grain feeders in the country.
Horse owners are becoming conscious of the ingredients in the products they purchase for horses and are opting for feeders made with natural components. Many manufacturers are now offering feeders from recycled materials or using more sustainable manufacturing processes. Moreover, the United Kingdom horse grain feeders market is also influenced by the current regulations and guidelines regarding equine feed. Therefore, the market in the United Kingdom is likely to reach US$ 547.6 million by 2033, exhibiting a CAGR of 5.6%
The German Horse Industry witnesses the growing Demand for Innovative Grain Feeders
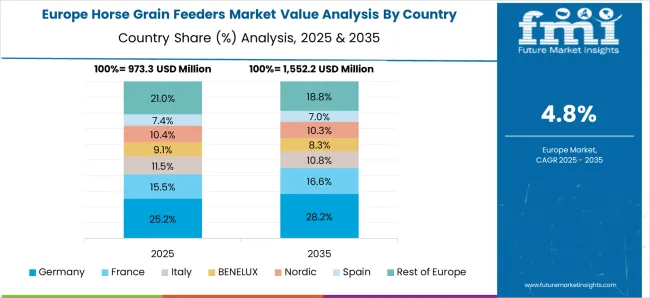
The market in Germany is a niche but growing industry, driven by the increasing popularity of horse riding and equestrian sports. Germany is home to a large equestrian community, with over 2 million horses and ponies kept for recreational and competitive use. This has led to a demand for high-quality horse feeders that can safely and efficiently dispense grain.
The market is growing since the country has rising disposable income and increasing awareness of horse health and nutrition. The key players in the German horse grain feeders market include Busse, Waldhausen, and JFC. These companies offer a wide range of horse grain feeders including traditional feed bins, automatic feeders, and slow feeders. They also offer various horse feed options such as hay, straw, and different types of grain.
China’s Horse Industry Blooms, Fueling Growth in Grain Feeders Market
One of the key drivers of the growth in the market in China is the increasing popularity of equestrian sports, such as horse racing and show jumping. The government of China has also been promoting equestrian sports as a way to improve the country’s overall sports performance and boost tourism. This has led to the construction of new equestrian facilities and an increase in the horse population in China, which in turn has boosted the demand for horse grain feeders.
China's horse grain feeders market is also being influenced by the growing e-commerce sector in the country. Online sales of horse grain feeders have been growing in recent years, as more consumers in China are turning to the internet to purchase goods and services. This trend is expected to continue during the forecast period, as the number of internet users in China continues to grow and more consumers become comfortable with buying products online. Therefore, the market is expected to surpass US$ 427.7 million by 2033, registering a CAGR of 4.2%.
Horse Owners in Japan Turn to Advanced Grain Feeders to Enhance Equine Nutrition
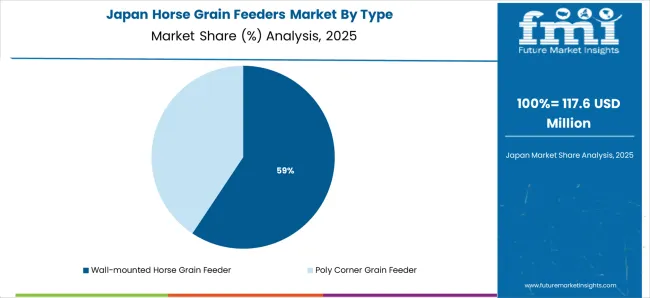
The market in Japan is relatively small compared to other equine products and services. However, there is still a dedicated group of horse owners and trainers who prioritize the health and well-being of their equine partners and are willing to invest in quality feeders. Japan is home to various horse breeds, including the Japanese Thoroughbred, which is known for its speed and endurance. These horses are often used in horse racing, an industry that generates significant revenue in Japan.
Despite the relatively small market size, several companies in Japan specialize in the production and distribution of horse grain feeders. Certain popular players operating in Japan's horse grain feeders market include ASAHI and Tsurumi Manufacturers. These companies often work closely with equine professionals and organizations to ensure that their products meet the needs of the horse-owning community.
India Horse Market Experiences Surge in Grain Feeder Sales as Equestrianism Grows in Popularity
The market in India is a small but developing market. Horse ownership in India is relatively low compared to other countries, but there is a growing interest in equestrian sports and activities, which is driving the demand for horse feeders. In the country, the prominent horse grain feeders are imported from other countries, particularly from Europe and the USA. These imported feeders are typically more expensive than locally made feeders but are seen as being of higher quality and more durable.
Even though the Indian horse grain feeders market is relatively small, several companies manufacture and sell horse grain feeders in India. These companies offer a wide range of horse feeders, including basic feeders, automatic feeders, and feeders with special features such as weather-proofing and anti-waste design. Hence, the market in India is estimated to reach a valuation of US$ 195.9 million, exhibiting a CAGR of 6.1%.
A unified Market Research Subscription Platform, built for today's disparate research needs.
Which Segments of the Horse Grain Feeders Market are Succeeding and Trying to Maximize Revenues?
Wall-mounted Horse Grain Feeders: Durable and Space-efficient Feeding Solutions
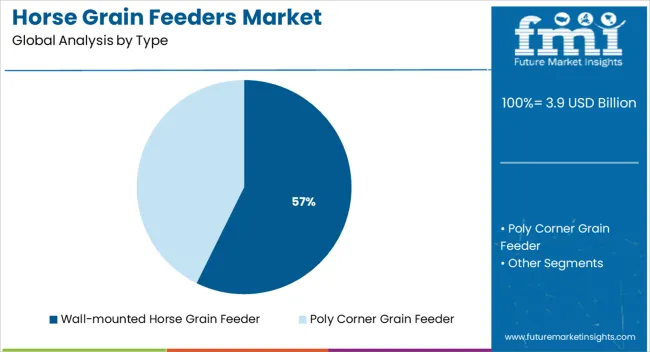
When it comes to horse grain feeders, there are several options available to horse owners. Wall-mounted grain feeders and poly corner grain feeders are generally popular in the market. Horse owners prefer using wall-mounted grain feeders since they are typically more space-efficient. These feeders can be mounted on a wall or stall door, freeing up space. This is particularly useful for owners who have limited space in their barns or stables. Compared to poly corner feeders, these are usually more durable as they are made of metal. This is particularly important for horse owners who have larger or more active horses.
Large Farms Adopt Horse Grain Feeders for Efficiency, Cost-effectiveness, and Safety
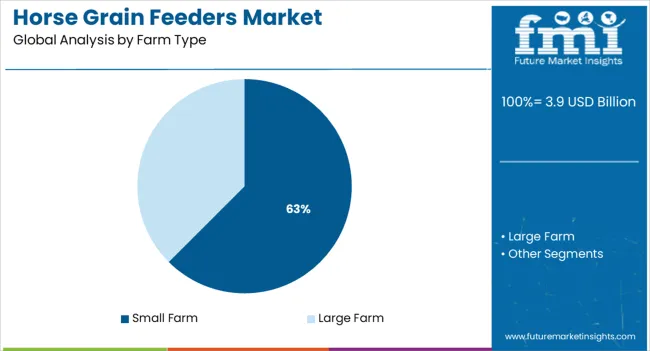
For a wide range of reasons, large farms utilize horse grain feeders more often than small farms. They are an efficient and cost-effective way to ensure that all of the horses are getting the proper nutrition they need. Large farms have specific feeding requirements, such as grain rationing, or a higher number of horses with specific health conditions. Large farms commonly adopt automatic grain feeders which help to reduce the amount of time and labor required to feed the horses. Additionally, horse grain feeders are also an important safety feature for large farms as they can prevent horses from overeating or fighting for feed.
Leading Horse Grain Feeders Manufacturers Innovate to Meet Growing Market Demands
Manufacturers in the horse grain feeders market are focusing on research and development to innovate and improve their products. Strategies that manufacturers are implementing include:
- Introducing new designs and features: Manufacturers are introducing new designs and features to their feeders for making them more attractive to customers and differentiate them from competitors. These include features such as automatic feed dispensing, weather-resistant materials, and built-in storage for feed.
- Investing in new product development: Companies are investing in new product development to create innovative and high-quality feeders that meet the needs of horse owners.
- Improving the Functionality of feeders: Market players are also working to improve the functionality of horse grain feeders. For example, certain market players are developing feeders that can dispense feed at specific intervals, making it easier for horse owners to manage the feeding schedule.
- Emphasizing quality and durability: Manufacturers are emphasizing quality and durability in their products to ensure that they last longer and perform better than those of their competitors.
- Providing custom solutions: Certain manufacturers are also offering custom solutions to meet the specific needs of horse owners and breeders, such as feeders designed for specific types of feed that can accommodate many horses.
- Focusing on sustainability: Manufacturers are also concentrating on sustainability by using eco-friendly materials and designing their feeders in a way that reduces waste and is easy to clean.
- Providing after-sales services: Many manufacturers are providing after-sales services such as installation, maintenance, and repair services to their customers, to increase customer satisfaction and loyalty.
- Marketing and Promotion: Manufacturers are also converging on marketing and promotion to increase brand awareness and attract more customers. They are investing in marketing and advertising to promote their products to potential customers.
Key Market Developments:
In October 2022, to assure advancement in the equine industry and to take advantage of the synergies developed between the businesses, Röwer & Rüb enters into a strategic partnership with the Global Equestrian Group.
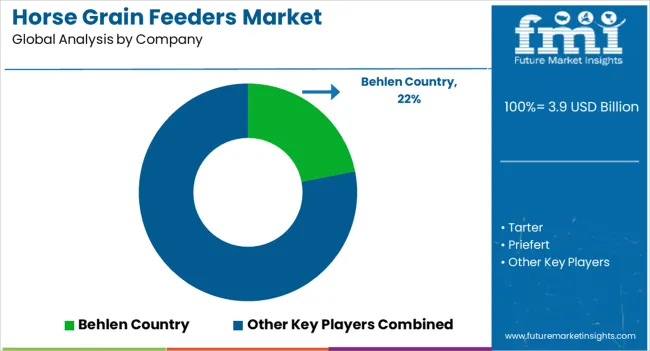
In February 2022, Behlen Mfg. Co. entered into a partnership with Freeland Industries, Inc. and Freeland Trucking, Inc. to purchase industrial tank and feeder assets to diversify their product portfolio.
In July 2021, Priefert Manufacturing has joined the North American Steel Alliance as a member-owner organization, becoming the organization's newest acquisition of metals.
Other Key Players Operating in the Horse Grain Feeders Market
- IOTTI ZOOTECNIA SRL
- Stallion
- Polidas
- Röwer & Rüb
- D P Agri Ltd.
- SIEPLO
Horse Grain Feeders Market Segmentation
By Type:
- Wall-mounted Horse Grain Feeder
- Poly Corner Grain Feeder
By Farm Type:
- Small Farm
- Large Farm
Sales Channel:
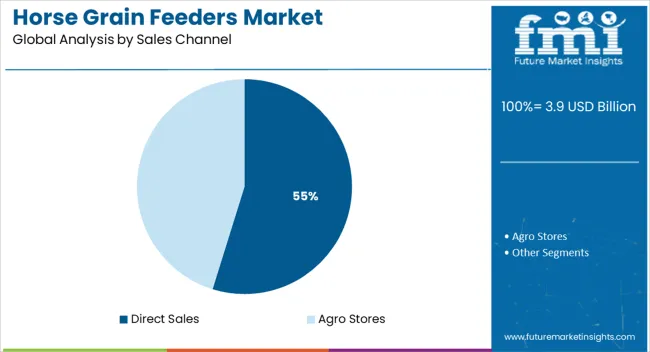
- Direct Sales
- Agro Stores
By Region:
- North America
- Latin America
- Europe
- East Asia
- South Asia
- Middle East and Africa
Frequently Asked Questions
What is the Size of the Global Horse Grain Feeders Market in 2023?
The market accounted for a value of US$ 3.49 billion in 2023.
What is the Expected Growth Rate of the Global Horse Grain Feeders Market?
The market is estimated to record a CAGR of 5.2% during the forecast period.
What is the Projected Size of the Global Horse Grain Feeders Market by 2033?
The market size is predicted to be valued at US$ 5.79 billion by 2033.
Which is the Leading Region in the Global Horse Grain Feeders Market?
North America dominates the global market.
Table of Content
1. Executive Summary | Horse Grain Feeders Market 1.1. Global Market Outlook 1.2. Demand-side Trends 1.3. Supply-side Trends 1.4. Technology Roadmap Analysis 1.5. Analysis and Recommendations 2. Market Overview 2.1. Market Coverage / Taxonomy 2.2. Market Definition / Scope / Limitations 3. Market Background 3.1. Market Dynamics 3.1.1. Drivers 3.1.2. Restraints 3.1.3. Opportunity 3.1.4. Trends 3.2. Scenario Forecast 3.2.1. Demand in Optimistic Scenario 3.2.2. Demand in Likely Scenario 3.2.3. Demand in Conservative Scenario 3.3. Opportunity Map Analysis 3.4. Product Life Cycle Analysis 3.5. Supply Chain Analysis 3.5.1. Supply Side Participants and their Roles 3.5.1.1. Producers 3.5.1.2. Mid-Level Participants (Traders/ Agents/ Brokers) 3.5.1.3. Wholesalers and Distributors 3.5.2. Value Added and Value Created at Node in the Supply Chain 3.5.3. List of Raw Material Suppliers 3.5.4. List of Existing and Potential Buyers 3.6. Investment Feasibility Matrix 3.7. Value Chain Analysis 3.7.1. Profit Margin Analysis 3.7.2. Wholesalers and Distributors 3.7.3. Retailers 3.8. PESTLE and Porter’s Analysis 3.9. Regulatory Landscape 3.9.1. By Key Regions 3.9.2. By Key Countries 3.10. Regional Parent Market Outlook 3.11. Production and Consumption Statistics 3.12. Import and Export Statistics 4. Global Market Analysis 2018 to 2022 and Forecast, 2023 to 2033 4.1. Historical Market Size Value (US$ Million) & Volume (Units) Analysis, 2018 to 2022 4.2. Current and Future Market Size Value (US$ Million) & Volume (Units) Projections, 2023 to 2033 4.2.1. Y-o-Y Growth Trend Analysis 4.2.2. Absolute $ Opportunity Analysis 5. Global Market Analysis 2018 to 2022 and Forecast 2023 to 2033, By Type 5.1. Introduction / Key Findings 5.2. Historical Market Size Value (US$ Million) & Volume (Units) Analysis By Type, 2018 to 2022 5.3. Current and Future Market Size Value (US$ Million) & Volume (Units) Analysis and Forecast By Type, 2023 to 2033 5.3.1. Wall-Mounted Horse Grain Feeder 5.3.2. Poly Corner Grain Feeder 5.4. Y-o-Y Growth Trend Analysis By Type, 2018 to 2022 5.5. Absolute $ Opportunity Analysis By Type, 2023 to 2033 6. Global Market Analysis 2018 to 2022 and Forecast 2023 to 2033, By Farm Type 6.1. Introduction / Key Findings 6.2. Historical Market Size Value (US$ Million) & Volume (Units) Analysis By Farm Type, 2018 to 2022 6.3. Current and Future Market Size Value (US$ Million) & Volume (Units) Analysis and Forecast By Farm Type, 2023 to 2033 6.3.1. Small Farm 6.3.2. Large Farm 6.4. Y-o-Y Growth Trend Analysis By Farm Type, 2018 to 2022 6.5. Absolute $ Opportunity Analysis By Farm Type, 2023 to 2033 7. Global Market Analysis 2018 to 2022 and Forecast 2023 to 2033, By Sales Channel 7.1. Introduction / Key Findings 7.2. Historical Market Size Value (US$ Million) & Volume (Units) Analysis By Sales Channel, 2018 to 2022 7.3. Current and Future Market Size Value (US$ Million) & Volume (Units) Analysis and Forecast By Sales Channel, 2023 to 2033 7.3.1. Direct Sales 7.3.2. Agro Stores 7.4. Y-o-Y Growth Trend Analysis By Sales Channel, 2018 to 2022 7.5. Absolute $ Opportunity Analysis By Sales Channel, 2023 to 2033 8. Global Market Analysis 2018 to 2022 and Forecast 2023 to 2033, By Region 8.1. Introduction 8.2. Historical Market Size Value (US$ Million) & Volume (Units) Analysis By Region, 2018 to 2022 8.3. Current Market Size Value (US$ Million) & Volume (Units) Analysis and Forecast By Region, 2023 to 2033 8.3.1. North America 8.3.2. Latin America 8.3.3. Europe 8.3.4. Asia Pacific 8.3.5. Middle East and Africa (MEA) 8.4. Market Attractiveness Analysis By Region 9. North America Market Analysis 2018 to 2022 and Forecast 2023 to 2033, By Country 9.1. Historical Market Size Value (US$ Million) & Volume (Units) Trend Analysis By Market Taxonomy, 2018 to 2022 9.2. Market Size Value (US$ Million) & Volume (Units) Forecast By Market Taxonomy, 2023 to 2033 9.2.1. By Country 9.2.1.1. United States of America 9.2.1.2. Canada 9.2.2. By Type 9.2.3. By Farm Type 9.2.4. By Sales Channel 9.3. Market Attractiveness Analysis 9.3.1. By Country 9.3.2. By Type 9.3.3. By Farm Type 9.3.4. By Sales Channel 9.4. Key Takeaways 10. Latin America Market Analysis 2018 to 2022 and Forecast 2023 to 2033, By Country 10.1. Historical Market Size Value (US$ Million) & Volume (Units) Trend Analysis By Market Taxonomy, 2018 to 2022 10.2. Market Size Value (US$ Million) & Volume (Units) Forecast By Market Taxonomy, 2023 to 2033 10.2.1. By Country 10.2.1.1. Brazil 10.2.1.2. Mexico 10.2.1.3. Rest of Latin America 10.2.2. By Type 10.2.3. By Farm Type 10.2.4. By Sales Channel 10.3. Market Attractiveness Analysis 10.3.1. By Country 10.3.2. By Type 10.3.3. By Farm Type 10.3.4. By Sales Channel 10.4. Key Takeaways 11. Europe Market Analysis 2018 to 2022 and Forecast 2023 to 2033, By Country 11.1. Historical Market Size Value (US$ Million) & Volume (Units) Trend Analysis By Market Taxonomy, 2018 to 2022 11.2. Market Size Value (US$ Million) & Volume (Units) Forecast By Market Taxonomy, 2023 to 2033 11.2.1. By Country 11.2.1.1. Germany 11.2.1.2. United Kingdom 11.2.1.3. France 11.2.1.4. Spain 11.2.1.5. Italy 11.2.1.6. Rest of Europe 11.2.2. By Type 11.2.3. By Farm Type 11.2.4. By Sales Channel 11.3. Market Attractiveness Analysis 11.3.1. By Country 11.3.2. By Type 11.3.3. By Farm Type 11.3.4. By Sales Channel 11.4. Key Takeaways 12. Asia Pacific Market Analysis 2018 to 2022 and Forecast 2023 to 2033, By Country 12.1. Historical Market Size Value (US$ Million) & Volume (Units) Trend Analysis By Market Taxonomy, 2018 to 2022 12.2. Market Size Value (US$ Million) & Volume (Units) Forecast By Market Taxonomy, 2023 to 2033 12.2.1. By Country 12.2.1.1. China 12.2.1.2. Japan 12.2.1.3. South Korea 12.2.1.4. Singapore 12.2.1.5. Thailand 12.2.1.6. Indonesia 12.2.1.7. Australia 12.2.1.8. New Zealand 12.2.1.9. Rest of Asia Pacific 12.2.2. By Type 12.2.3. By Farm Type 12.2.4. By Sales Channel 12.3. Market Attractiveness Analysis 12.3.1. By Country 12.3.2. By Type 12.3.3. By Farm Type 12.3.4. By Sales Channel 12.4. Key Takeaways 13. MEA Market Analysis 2018 to 2022 and Forecast 2023 to 2033, By Country 13.1. Historical Market Size Value (US$ Million) & Volume (Units) Trend Analysis By Market Taxonomy, 2018 to 2022 13.2. Market Size Value (US$ Million) & Volume (Units) Forecast By Market Taxonomy, 2023 to 2033 13.2.1. By Country 13.2.1.1. GCC Countries 13.2.1.2. South Africa 13.2.1.3. Israel 13.2.1.4. Rest of MEA 13.2.2. By Type 13.2.3. By Farm Type 13.2.4. By Sales Channel 13.3. Market Attractiveness Analysis 13.3.1. By Country 13.3.2. By Type 13.3.3. By Farm Type 13.3.4. By Sales Channel 13.4. Key Takeaways 14. Key Countries Market Analysis 14.1. United States of America 14.1.1. Pricing Analysis 14.1.2. Market Share Analysis, 2022 14.1.2.1. By Type 14.1.2.2. By Farm Type 14.1.2.3. By Sales Channel 14.2. Canada 14.2.1. Pricing Analysis 14.2.2. Market Share Analysis, 2022 14.2.2.1. By Type 14.2.2.2. By Farm Type 14.2.2.3. By Sales Channel 14.3. Brazil 14.3.1. Pricing Analysis 14.3.2. Market Share Analysis, 2022 14.3.2.1. By Type 14.3.2.2. By Farm Type 14.3.2.3. By Sales Channel 14.4. Mexico 14.4.1. Pricing Analysis 14.4.2. Market Share Analysis, 2022 14.4.2.1. By Type 14.4.2.2. By Farm Type 14.4.2.3. By Sales Channel 14.5. Germany 14.5.1. Pricing Analysis 14.5.2. Market Share Analysis, 2022 14.5.2.1. By Type 14.5.2.2. By Farm Type 14.5.2.3. By Sales Channel 14.6. United Kingdom 14.6.1. Pricing Analysis 14.6.2. Market Share Analysis, 2022 14.6.2.1. By Type 14.6.2.2. By Farm Type 14.6.2.3. By Sales Channel 14.7. France 14.7.1. Pricing Analysis 14.7.2. Market Share Analysis, 2022 14.7.2.1. By Type 14.7.2.2. By Farm Type 14.7.2.3. By Sales Channel 14.8. Spain 14.8.1. Pricing Analysis 14.8.2. Market Share Analysis, 2022 14.8.2.1. By Type 14.8.2.2. By Farm Type 14.8.2.3. By Sales Channel 14.9. Italy 14.9.1. Pricing Analysis 14.9.2. Market Share Analysis, 2022 14.9.2.1. By Type 14.9.2.2. By Farm Type 14.9.2.3. By Sales Channel 14.10. China 14.10.1. Pricing Analysis 14.10.2. Market Share Analysis, 2022 14.10.2.1. By Type 14.10.2.2. By Farm Type 14.10.2.3. By Sales Channel 14.11. Japan 14.11.1. Pricing Analysis 14.11.2. Market Share Analysis, 2022 14.11.2.1. By Type 14.11.2.2. By Farm Type 14.11.2.3. By Sales Channel 14.12. South Korea 14.12.1. Pricing Analysis 14.12.2. Market Share Analysis, 2022 14.12.2.1. By Type 14.12.2.2. By Farm Type 14.12.2.3. By Sales Channel 14.13. Singapore 14.13.1. Pricing Analysis 14.13.2. Market Share Analysis, 2022 14.13.2.1. By Type 14.13.2.2. By Farm Type 14.13.2.3. By Sales Channel 14.14. Thailand 14.14.1. Pricing Analysis 14.14.2. Market Share Analysis, 2022 14.14.2.1. By Type 14.14.2.2. By Farm Type 14.14.2.3. By Sales Channel 14.15. Indonesia 14.15.1. Pricing Analysis 14.15.2. Market Share Analysis, 2022 14.15.2.1. By Type 14.15.2.2. By Farm Type 14.15.2.3. By Sales Channel 14.16. Australia 14.16.1. Pricing Analysis 14.16.2. Market Share Analysis, 2022 14.16.2.1. By Type 14.16.2.2. By Farm Type 14.16.2.3. By Sales Channel 14.17. New Zealand 14.17.1. Pricing Analysis 14.17.2. Market Share Analysis, 2022 14.17.2.1. By Type 14.17.2.2. By Farm Type 14.17.2.3. By Sales Channel 14.18. GCC Countries 14.18.1. Pricing Analysis 14.18.2. Market Share Analysis, 2022 14.18.2.1. By Type 14.18.2.2. By Farm Type 14.18.2.3. By Sales Channel 14.19. South Africa 14.19.1. Pricing Analysis 14.19.2. Market Share Analysis, 2022 14.19.2.1. By Type 14.19.2.2. By Farm Type 14.19.2.3. By Sales Channel 14.20. Israel 14.20.1. Pricing Analysis 14.20.2. Market Share Analysis, 2022 14.20.2.1. By Type 14.20.2.2. By Farm Type 14.20.2.3. By Sales Channel 15. Market Structure Analysis 15.1. Competition Dashboard 15.2. Competition Benchmarking 15.3. Market Share Analysis of Top Players 15.3.1. By Regional 15.3.2. By Type 15.3.3. By Farm Type 15.3.4. By Sales Channel 16. Competition Analysis 16.1. Competition Deep Dive 16.1.1. Behlen Country 16.1.1.1. Overview 16.1.1.2. Product Portfolio 16.1.1.3. Profitability by Market Segments 16.1.1.4. Sales Footprint 16.1.1.5. Strategy Overview 16.1.1.5.1. Marketing Strategy 16.1.1.5.2. Product Strategy 16.1.1.5.3. Channel Strategy 16.1.2. Tarter 16.1.2.1. Overview 16.1.2.2. Product Portfolio 16.1.2.3. Profitability by Market Segments 16.1.2.4. Sales Footprint 16.1.2.5. Strategy Overview 16.1.2.5.1. Marketing Strategy 16.1.2.5.2. Product Strategy 16.1.2.5.3. Channel Strategy 16.1.3. Priefert 16.1.3.1. Overview 16.1.3.2. Product Portfolio 16.1.3.3. Profitability by Market Segments 16.1.3.4. Sales Footprint 16.1.3.5. Strategy Overview 16.1.3.5.1. Marketing Strategy 16.1.3.5.2. Product Strategy 16.1.3.5.3. Channel Strategy 16.1.4. Stallion 16.1.4.1. Overview 16.1.4.2. Product Portfolio 16.1.4.3. Profitability by Market Segments 16.1.4.4. Sales Footprint 16.1.4.5. Strategy Overview 16.1.4.5.1. Marketing Strategy 16.1.4.5.2. Product Strategy 16.1.4.5.3. Channel Strategy 16.1.5. Rower & Rub 16.1.5.1. Overview 16.1.5.2. Product Portfolio 16.1.5.3. Profitability by Market Segments 16.1.5.4. Sales Footprint 16.1.5.5. Strategy Overview 16.1.5.5.1. Marketing Strategy 16.1.5.5.2. Product Strategy 16.1.5.5.3. Channel Strategy 16.1.6. SIEPLO 16.1.6.1. Overview 16.1.6.2. Product Portfolio 16.1.6.3. Profitability by Market Segments 16.1.6.4. Sales Footprint 16.1.6.5. Strategy Overview 16.1.6.5.1. Marketing Strategy 16.1.6.5.2. Product Strategy 16.1.6.5.3. Channel Strategy 16.1.7. IOTTI ZOOTECNIA SRL 16.1.7.1. Overview 16.1.7.2. Product Portfolio 16.1.7.3. Profitability by Market Segments 16.1.7.4. Sales Footprint 16.1.7.5. Strategy Overview 16.1.7.5.1. Marketing Strategy 16.1.7.5.2. Product Strategy 16.1.7.5.3. Channel Strategy 16.1.8. Polidas 16.1.8.1. Overview 16.1.8.2. Product Portfolio 16.1.8.3. Profitability by Market Segments 16.1.8.4. Sales Footprint 16.1.8.5. Strategy Overview 16.1.8.5.1. Marketing Strategy 16.1.8.5.2. Product Strategy 16.1.8.5.3. Channel Strategy 16.1.9. BISEN INDUSTRY 16.1.9.1. Overview 16.1.9.2. Product Portfolio 16.1.9.3. Profitability by Market Segments 16.1.9.4. Sales Footprint 16.1.9.5. Strategy Overview 16.1.9.5.1. Marketing Strategy 16.1.9.5.2. Product Strategy 16.1.9.5.3. Channel Strategy 16.1.10. DP Agri Ltd. 16.1.10.1. Overview 16.1.10.2. Product Portfolio 16.1.10.3. Profitability by Market Segments 16.1.10.4. Sales Footprint 16.1.10.5. Strategy Overview 16.1.10.5.1. Marketing Strategy 16.1.10.5.2. Product Strategy 16.1.10.5.3. Channel Strategy 17. Assumptions & Acronyms Used 18. Research Methodology
Let us know your requirement to get
100% FREE customization
List of Tables
Table 1: Global Market Value (US$ Million) Forecast by Region, 2018 to 2033 Table 2: Global Market Volume (Units) Forecast by Region, 2018 to 2033 Table 3: Global Market Value (US$ Million) Forecast by Type, 2018 to 2033 Table 4: Global Market Volume (Units) Forecast by Type, 2018 to 2033 Table 5: Global Market Value (US$ Million) Forecast by Farm Type, 2018 to 2033 Table 6: Global Market Volume (Units) Forecast by Farm Type, 2018 to 2033 Table 7: Global Market Value (US$ Million) Forecast by Sales Channel, 2018 to 2033 Table 8: Global Market Volume (Units) Forecast by Sales Channel, 2018 to 2033 Table 9: North America Market Value (US$ Million) Forecast by Country, 2018 to 2033 Table 10: North America Market Volume (Units) Forecast by Country, 2018 to 2033 Table 11: North America Market Value (US$ Million) Forecast by Type, 2018 to 2033 Table 12: North America Market Volume (Units) Forecast by Type, 2018 to 2033 Table 13: North America Market Value (US$ Million) Forecast by Farm Type, 2018 to 2033 Table 14: North America Market Volume (Units) Forecast by Farm Type, 2018 to 2033 Table 15: North America Market Value (US$ Million) Forecast by Sales Channel, 2018 to 2033 Table 16: North America Market Volume (Units) Forecast by Sales Channel, 2018 to 2033 Table 17: Latin America Market Value (US$ Million) Forecast by Country, 2018 to 2033 Table 18: Latin America Market Volume (Units) Forecast by Country, 2018 to 2033 Table 19: Latin America Market Value (US$ Million) Forecast by Type, 2018 to 2033 Table 20: Latin America Market Volume (Units) Forecast by Type, 2018 to 2033 Table 21: Latin America Market Value (US$ Million) Forecast by Farm Type, 2018 to 2033 Table 22: Latin America Market Volume (Units) Forecast by Farm Type, 2018 to 2033 Table 23: Latin America Market Value (US$ Million) Forecast by Sales Channel, 2018 to 2033 Table 24: Latin America Market Volume (Units) Forecast by Sales Channel, 2018 to 2033 Table 25: Europe Market Value (US$ Million) Forecast by Country, 2018 to 2033 Table 26: Europe Market Volume (Units) Forecast by Country, 2018 to 2033 Table 27: Europe Market Value (US$ Million) Forecast by Type, 2018 to 2033 Table 28: Europe Market Volume (Units) Forecast by Type, 2018 to 2033 Table 29: Europe Market Value (US$ Million) Forecast by Farm Type, 2018 to 2033 Table 30: Europe Market Volume (Units) Forecast by Farm Type, 2018 to 2033 Table 31: Europe Market Value (US$ Million) Forecast by Sales Channel, 2018 to 2033 Table 32: Europe Market Volume (Units) Forecast by Sales Channel, 2018 to 2033 Table 33: Asia Pacific Market Value (US$ Million) Forecast by Country, 2018 to 2033 Table 34: Asia Pacific Market Volume (Units) Forecast by Country, 2018 to 2033 Table 35: Asia Pacific Market Value (US$ Million) Forecast by Type, 2018 to 2033 Table 36: Asia Pacific Market Volume (Units) Forecast by Type, 2018 to 2033 Table 37: Asia Pacific Market Value (US$ Million) Forecast by Farm Type, 2018 to 2033 Table 38: Asia Pacific Market Volume (Units) Forecast by Farm Type, 2018 to 2033 Table 39: Asia Pacific Market Value (US$ Million) Forecast by Sales Channel, 2018 to 2033 Table 40: Asia Pacific Market Volume (Units) Forecast by Sales Channel, 2018 to 2033 Table 41: MEA Market Value (US$ Million) Forecast by Country, 2018 to 2033 Table 42: MEA Market Volume (Units) Forecast by Country, 2018 to 2033 Table 43: MEA Market Value (US$ Million) Forecast by Type, 2018 to 2033 Table 44: MEA Market Volume (Units) Forecast by Type, 2018 to 2033 Table 45: MEA Market Value (US$ Million) Forecast by Farm Type, 2018 to 2033 Table 46: MEA Market Volume (Units) Forecast by Farm Type, 2018 to 2033 Table 47: MEA Market Value (US$ Million) Forecast by Sales Channel, 2018 to 2033 Table 48: MEA Market Volume (Units) Forecast by Sales Channel, 2018 to 2033
Find your sweet spots for generating winning opportunities in this market.
Talk to AnalystList of Charts
Figure 1: Global Market Value (US$ Million) by Type, 2023 to 2033 Figure 2: Global Market Value (US$ Million) by Farm Type, 2023 to 2033 Figure 3: Global Market Value (US$ Million) by Sales Channel, 2023 to 2033 Figure 4: Global Market Value (US$ Million) by Region, 2023 to 2033 Figure 5: Global Market Value (US$ Million) Analysis by Region, 2018 to 2033 Figure 6: Global Market Volume (Units) Analysis by Region, 2018 to 2033 Figure 7: Global Market Value Share (%) and BPS Analysis by Region, 2023 to 2033 Figure 8: Global Market Y-o-Y Growth (%) Projections by Region, 2023 to 2033 Figure 9: Global Market Value (US$ Million) Analysis by Type, 2018 to 2033 Figure 10: Global Market Volume (Units) Analysis by Type, 2018 to 2033 Figure 11: Global Market Value Share (%) and BPS Analysis by Type, 2023 to 2033 Figure 12: Global Market Y-o-Y Growth (%) Projections by Type, 2023 to 2033 Figure 13: Global Market Value (US$ Million) Analysis by Farm Type, 2018 to 2033 Figure 14: Global Market Volume (Units) Analysis by Farm Type, 2018 to 2033 Figure 15: Global Market Value Share (%) and BPS Analysis by Farm Type, 2023 to 2033 Figure 16: Global Market Y-o-Y Growth (%) Projections by Farm Type, 2023 to 2033 Figure 17: Global Market Value (US$ Million) Analysis by Sales Channel, 2018 to 2033 Figure 18: Global Market Volume (Units) Analysis by Sales Channel, 2018 to 2033 Figure 19: Global Market Value Share (%) and BPS Analysis by Sales Channel, 2023 to 2033 Figure 20: Global Market Y-o-Y Growth (%) Projections by Sales Channel, 2023 to 2033 Figure 21: Global Market Attractiveness by Type, 2023 to 2033 Figure 22: Global Market Attractiveness by Farm Type, 2023 to 2033 Figure 23: Global Market Attractiveness by Sales Channel, 2023 to 2033 Figure 24: Global Market Attractiveness by Region, 2023 to 2033 Figure 25: North America Market Value (US$ Million) by Type, 2023 to 2033 Figure 26: North America Market Value (US$ Million) by Farm Type, 2023 to 2033 Figure 27: North America Market Value (US$ Million) by Sales Channel, 2023 to 2033 Figure 28: North America Market Value (US$ Million) by Country, 2023 to 2033 Figure 29: North America Market Value (US$ Million) Analysis by Country, 2018 to 2033 Figure 30: North America Market Volume (Units) Analysis by Country, 2018 to 2033 Figure 31: North America Market Value Share (%) and BPS Analysis by Country, 2023 to 2033 Figure 32: North America Market Y-o-Y Growth (%) Projections by Country, 2023 to 2033 Figure 33: North America Market Value (US$ Million) Analysis by Type, 2018 to 2033 Figure 34: North America Market Volume (Units) Analysis by Type, 2018 to 2033 Figure 35: North America Market Value Share (%) and BPS Analysis by Type, 2023 to 2033 Figure 36: North America Market Y-o-Y Growth (%) Projections by Type, 2023 to 2033 Figure 37: North America Market Value (US$ Million) Analysis by Farm Type, 2018 to 2033 Figure 38: North America Market Volume (Units) Analysis by Farm Type, 2018 to 2033 Figure 39: North America Market Value Share (%) and BPS Analysis by Farm Type, 2023 to 2033 Figure 40: North America Market Y-o-Y Growth (%) Projections by Farm Type, 2023 to 2033 Figure 41: North America Market Value (US$ Million) Analysis by Sales Channel, 2018 to 2033 Figure 42: North America Market Volume (Units) Analysis by Sales Channel, 2018 to 2033 Figure 43: North America Market Value Share (%) and BPS Analysis by Sales Channel, 2023 to 2033 Figure 44: North America Market Y-o-Y Growth (%) Projections by Sales Channel, 2023 to 2033 Figure 45: North America Market Attractiveness by Type, 2023 to 2033 Figure 46: North America Market Attractiveness by Farm Type, 2023 to 2033 Figure 47: North America Market Attractiveness by Sales Channel, 2023 to 2033 Figure 48: North America Market Attractiveness by Country, 2023 to 2033 Figure 49: Latin America Market Value (US$ Million) by Type, 2023 to 2033 Figure 50: Latin America Market Value (US$ Million) by Farm Type, 2023 to 2033 Figure 51: Latin America Market Value (US$ Million) by Sales Channel, 2023 to 2033 Figure 52: Latin America Market Value (US$ Million) by Country, 2023 to 2033 Figure 53: Latin America Market Value (US$ Million) Analysis by Country, 2018 to 2033 Figure 54: Latin America Market Volume (Units) Analysis by Country, 2018 to 2033 Figure 55: Latin America Market Value Share (%) and BPS Analysis by Country, 2023 to 2033 Figure 56: Latin America Market Y-o-Y Growth (%) Projections by Country, 2023 to 2033 Figure 57: Latin America Market Value (US$ Million) Analysis by Type, 2018 to 2033 Figure 58: Latin America Market Volume (Units) Analysis by Type, 2018 to 2033 Figure 59: Latin America Market Value Share (%) and BPS Analysis by Type, 2023 to 2033 Figure 60: Latin America Market Y-o-Y Growth (%) Projections by Type, 2023 to 2033 Figure 61: Latin America Market Value (US$ Million) Analysis by Farm Type, 2018 to 2033 Figure 62: Latin America Market Volume (Units) Analysis by Farm Type, 2018 to 2033 Figure 63: Latin America Market Value Share (%) and BPS Analysis by Farm Type, 2023 to 2033 Figure 64: Latin America Market Y-o-Y Growth (%) Projections by Farm Type, 2023 to 2033 Figure 65: Latin America Market Value (US$ Million) Analysis by Sales Channel, 2018 to 2033 Figure 66: Latin America Market Volume (Units) Analysis by Sales Channel, 2018 to 2033 Figure 67: Latin America Market Value Share (%) and BPS Analysis by Sales Channel, 2023 to 2033 Figure 68: Latin America Market Y-o-Y Growth (%) Projections by Sales Channel, 2023 to 2033 Figure 69: Latin America Market Attractiveness by Type, 2023 to 2033 Figure 70: Latin America Market Attractiveness by Farm Type, 2023 to 2033 Figure 71: Latin America Market Attractiveness by Sales Channel, 2023 to 2033 Figure 72: Latin America Market Attractiveness by Country, 2023 to 2033 Figure 73: Europe Market Value (US$ Million) by Type, 2023 to 2033 Figure 74: Europe Market Value (US$ Million) by Farm Type, 2023 to 2033 Figure 75: Europe Market Value (US$ Million) by Sales Channel, 2023 to 2033 Figure 76: Europe Market Value (US$ Million) by Country, 2023 to 2033 Figure 77: Europe Market Value (US$ Million) Analysis by Country, 2018 to 2033 Figure 78: Europe Market Volume (Units) Analysis by Country, 2018 to 2033 Figure 79: Europe Market Value Share (%) and BPS Analysis by Country, 2023 to 2033 Figure 80: Europe Market Y-o-Y Growth (%) Projections by Country, 2023 to 2033 Figure 81: Europe Market Value (US$ Million) Analysis by Type, 2018 to 2033 Figure 82: Europe Market Volume (Units) Analysis by Type, 2018 to 2033 Figure 83: Europe Market Value Share (%) and BPS Analysis by Type, 2023 to 2033 Figure 84: Europe Market Y-o-Y Growth (%) Projections by Type, 2023 to 2033 Figure 85: Europe Market Value (US$ Million) Analysis by Farm Type, 2018 to 2033 Figure 86: Europe Market Volume (Units) Analysis by Farm Type, 2018 to 2033 Figure 87: Europe Market Value Share (%) and BPS Analysis by Farm Type, 2023 to 2033 Figure 88: Europe Market Y-o-Y Growth (%) Projections by Farm Type, 2023 to 2033 Figure 89: Europe Market Value (US$ Million) Analysis by Sales Channel, 2018 to 2033 Figure 90: Europe Market Volume (Units) Analysis by Sales Channel, 2018 to 2033 Figure 91: Europe Market Value Share (%) and BPS Analysis by Sales Channel, 2023 to 2033 Figure 92: Europe Market Y-o-Y Growth (%) Projections by Sales Channel, 2023 to 2033 Figure 93: Europe Market Attractiveness by Type, 2023 to 2033 Figure 94: Europe Market Attractiveness by Farm Type, 2023 to 2033 Figure 95: Europe Market Attractiveness by Sales Channel, 2023 to 2033 Figure 96: Europe Market Attractiveness by Country, 2023 to 2033 Figure 97: Asia Pacific Market Value (US$ Million) by Type, 2023 to 2033 Figure 98: Asia Pacific Market Value (US$ Million) by Farm Type, 2023 to 2033 Figure 99: Asia Pacific Market Value (US$ Million) by Sales Channel, 2023 to 2033 Figure 100: Asia Pacific Market Value (US$ Million) by Country, 2023 to 2033 Figure 101: Asia Pacific Market Value (US$ Million) Analysis by Country, 2018 to 2033 Figure 102: Asia Pacific Market Volume (Units) Analysis by Country, 2018 to 2033 Figure 103: Asia Pacific Market Value Share (%) and BPS Analysis by Country, 2023 to 2033 Figure 104: Asia Pacific Market Y-o-Y Growth (%) Projections by Country, 2023 to 2033 Figure 105: Asia Pacific Market Value (US$ Million) Analysis by Type, 2018 to 2033 Figure 106: Asia Pacific Market Volume (Units) Analysis by Type, 2018 to 2033 Figure 107: Asia Pacific Market Value Share (%) and BPS Analysis by Type, 2023 to 2033 Figure 108: Asia Pacific Market Y-o-Y Growth (%) Projections by Type, 2023 to 2033 Figure 109: Asia Pacific Market Value (US$ Million) Analysis by Farm Type, 2018 to 2033 Figure 110: Asia Pacific Market Volume (Units) Analysis by Farm Type, 2018 to 2033 Figure 111: Asia Pacific Market Value Share (%) and BPS Analysis by Farm Type, 2023 to 2033 Figure 112: Asia Pacific Market Y-o-Y Growth (%) Projections by Farm Type, 2023 to 2033 Figure 113: Asia Pacific Market Value (US$ Million) Analysis by Sales Channel, 2018 to 2033 Figure 114: Asia Pacific Market Volume (Units) Analysis by Sales Channel, 2018 to 2033 Figure 115: Asia Pacific Market Value Share (%) and BPS Analysis by Sales Channel, 2023 to 2033 Figure 116: Asia Pacific Market Y-o-Y Growth (%) Projections by Sales Channel, 2023 to 2033 Figure 117: Asia Pacific Market Attractiveness by Type, 2023 to 2033 Figure 118: Asia Pacific Market Attractiveness by Farm Type, 2023 to 2033 Figure 119: Asia Pacific Market Attractiveness by Sales Channel, 2023 to 2033 Figure 120: Asia Pacific Market Attractiveness by Country, 2023 to 2033 Figure 121: MEA Market Value (US$ Million) by Type, 2023 to 2033 Figure 122: MEA Market Value (US$ Million) by Farm Type, 2023 to 2033 Figure 123: MEA Market Value (US$ Million) by Sales Channel, 2023 to 2033 Figure 124: MEA Market Value (US$ Million) by Country, 2023 to 2033 Figure 125: MEA Market Value (US$ Million) Analysis by Country, 2018 to 2033 Figure 126: MEA Market Volume (Units) Analysis by Country, 2018 to 2033 Figure 127: MEA Market Value Share (%) and BPS Analysis by Country, 2023 to 2033 Figure 128: MEA Market Y-o-Y Growth (%) Projections by Country, 2023 to 2033 Figure 129: MEA Market Value (US$ Million) Analysis by Type, 2018 to 2033 Figure 130: MEA Market Volume (Units) Analysis by Type, 2018 to 2033 Figure 131: MEA Market Value Share (%) and BPS Analysis by Type, 2023 to 2033 Figure 132: MEA Market Y-o-Y Growth (%) Projections by Type, 2023 to 2033 Figure 133: MEA Market Value (US$ Million) Analysis by Farm Type, 2018 to 2033 Figure 134: MEA Market Volume (Units) Analysis by Farm Type, 2018 to 2033 Figure 135: MEA Market Value Share (%) and BPS Analysis by Farm Type, 2023 to 2033 Figure 136: MEA Market Y-o-Y Growth (%) Projections by Farm Type, 2023 to 2033 Figure 137: MEA Market Value (US$ Million) Analysis by Sales Channel, 2018 to 2033 Figure 138: MEA Market Volume (Units) Analysis by Sales Channel, 2018 to 2033 Figure 139: MEA Market Value Share (%) and BPS Analysis by Sales Channel, 2023 to 2033 Figure 140: MEA Market Y-o-Y Growth (%) Projections by Sales Channel, 2023 to 2033 Figure 141: MEA Market Attractiveness by Type, 2023 to 2033 Figure 142: MEA Market Attractiveness by Farm Type, 2023 to 2033 Figure 143: MEA Market Attractiveness by Sales Channel, 2023 to 2033 Figure 144: MEA Market Attractiveness by Country, 2023 to 2033
Need specific information?
Request CustomizationExplore Process Automation Insights
View Reports