The Grain Alcohol Market is estimated to be valued at USD 17.6 billion in 2025 and is projected to reach USD 26.6 billion by 2035, registering a compound annual growth rate (CAGR) of 4.2% over the forecast period.
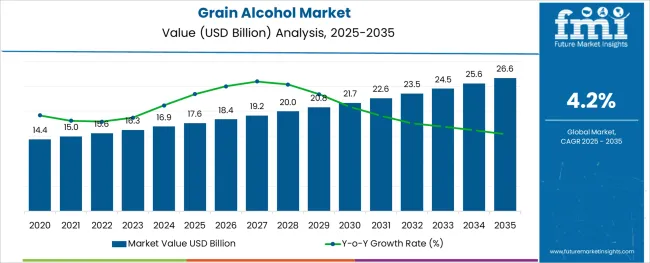
The grain alcohol market is experiencing steady expansion, primarily driven by its versatile applications across food and beverage, pharmaceutical, personal care, and industrial sectors. A significant factor contributing to this growth is the rising demand for bio-based and sustainable ingredients, with grain alcohol widely favored for its neutral profile, ease of blending, and cost-effectiveness.
The market is also benefiting from growing interest in premium spirits and craft distilleries, where grain alcohol serves as a key base ingredient. In addition, increasing usage in the production of sanitizers, disinfectants, and other hygiene products has bolstered demand, especially in the post-pandemic environment.
Looking ahead, a positive outlook is anticipated as regulatory bodies in various regions approve the use of grain alcohol for additional food-grade applications, while manufacturers increasingly pivot towards organic and non-GMO grain sources. Market players are expected to capitalize on opportunities in emerging economies where industrialization and consumer awareness regarding natural preservatives and plant-based products are on the rise. These factors collectively position the grain alcohol market for consistent, value-driven growth over the next several years.
The market is segmented by Source, Application, Functionality, and Type and region. By Source, the market is divided into Corn, Fermented Plant Materials, Grains, Grapes, Sugarcane, Sugarbeets, and Tubers. In terms of Application, the market is classified into Beverages, Food, Pharmaceuticals, and Health Care and Personal Care. Based on Functionality, the market is segmented into Preservatives, Solvent, Disinfectant, and Antiseptic. By Type, the market is divided into Ethanols and Polyols. Regionally, the market is classified into North America, Latin America, Western Europe, Eastern Europe, Balkan & Baltic Countries, Russia & Belarus, Central Asia, East Asia, South Asia & Pacific, and the Middle East & Africa.
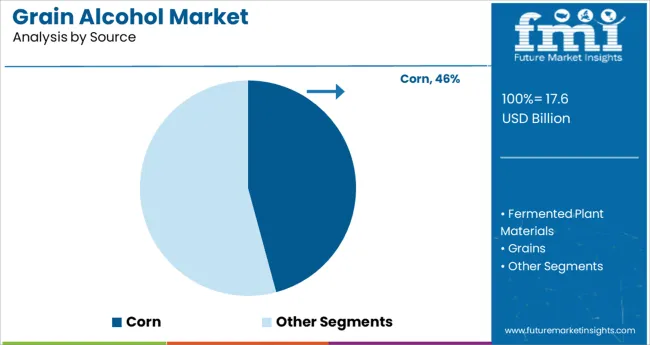
The corn segment accounted for approximately 45.8% of the total grain alcohol market share, establishing itself as the dominant source within the category. Its leadership is attributed to the abundant availability of corn, favorable pricing, and high starch yield, which makes it highly suitable for efficient alcohol production.
The widespread use of corn-based alcohol in beverage manufacturing, industrial solvents, and biofuel applications has consistently reinforced its market prominence. Additionally, the relative ease of sourcing and processing corn as compared to other grains ensures operational advantages for manufacturers seeking to optimize production costs.
Corn-derived grain alcohol is also increasingly employed in food processing and pharmaceutical formulations due to its neutral taste, versatility, and regulatory acceptance. With sustainability becoming a key procurement criterion, the market is witnessing an uptick in demand for non-GMO and organic corn variants. The segment’s growth trajectory is expected to remain stable as end-use industries expand, and bio-based product consumption rises globally, further solidifying corn’s position as the leading raw material for grain alcohol production.
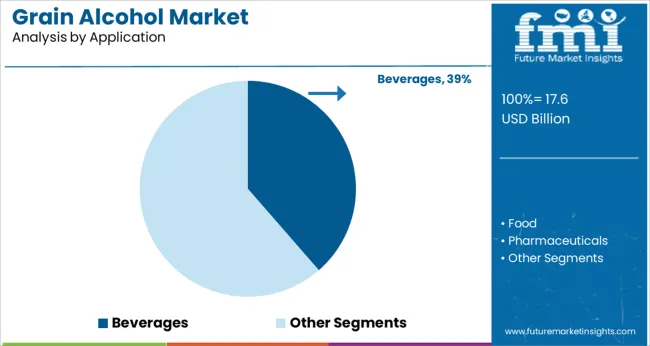
Within the application category, the beverages segment led with a 38.6% market share, reflecting its integral role in driving demand within the grain alcohol market. This dominance is primarily due to the extensive use of grain alcohol as a base ingredient in the production of spirits, liqueurs, and specialty alcoholic beverages.
Its neutral flavor profile and high purity levels make it especially suitable for blending and infusion with a wide variety of botanicals, flavors, and additives, supporting innovation in craft and premium spirits. The segment’s performance has been further strengthened by a global increase in alcohol consumption, particularly in emerging markets where urbanization and shifting consumer preferences have driven the popularity of diverse alcoholic beverages.
The resurgence of traditional distilled drinks and the growing number of artisanal distilleries have also played a role in sustaining segment growth. In the coming years, product diversification, coupled with rising disposable incomes and changing social consumption habits, is expected to preserve the beverages segment’s leadership within the grain alcohol market.
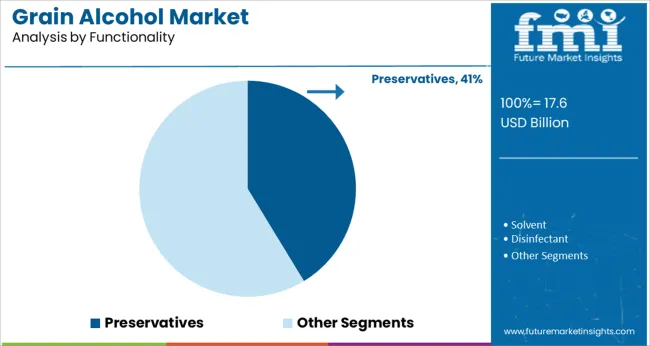
The preservatives segment maintained a commanding 41.3% market share within the functionality category, underpinned by grain alcohol’s effectiveness as a natural preservative and antimicrobial agent across various industries. Its application in food and beverage products has been well-established, particularly in extending shelf life and ensuring product safety without reliance on synthetic additives.
This functionality has gained renewed importance as clean-label trends and regulatory restrictions on artificial preservatives intensify. In personal care and pharmaceutical sectors, grain alcohol serves as a solvent and preservative, ensuring formulation stability and microbial control in products like tinctures, extracts, and lotions.
Additionally, the segment has benefitted from the rising demand for natural preservatives in organic and health-oriented consumer products. Manufacturers are actively incorporating grain alcohol in minimally processed and ready-to-consume items, aligning with consumer expectations for transparency and ingredient simplicity. This trend, combined with the material’s broad-spectrum antimicrobial properties and compatibility with various formulations, is projected to sustain the preservatives segment’s dominant position in the grain alcohol market.
Ethanol is the active element in alcoholic beverages such as beer, wine, and distilled spirits and is a consumable chemical. It used to be the most common component in several food products in a variety of tonics and cough medications.
It is also used as a patented treatment for therapeutic effects and is becoming increasingly popular. According to a study, the alcohol content in night-time cold remedies is 25%. Grain alcohol is utilized as a solvent, a germicide, and a disinfectant in the industrial sector.
Various starches from grain and residue of molasses from sugar refining are the main sources of sugars for fermentation. Corn is the most common source of starch in the USA In Europe, the availability of starch is usually from potatoes, whereas in Asia, starch is obtained from rice.
According to Future Market Insights (FMI), Brazil is considered to have the largest gasohol (mixture of gasoline and ethanol) consumption. The country gets the majority of its starch from cassava roots, however, sugar cane is responsible for a large portion of its grain alcohol.
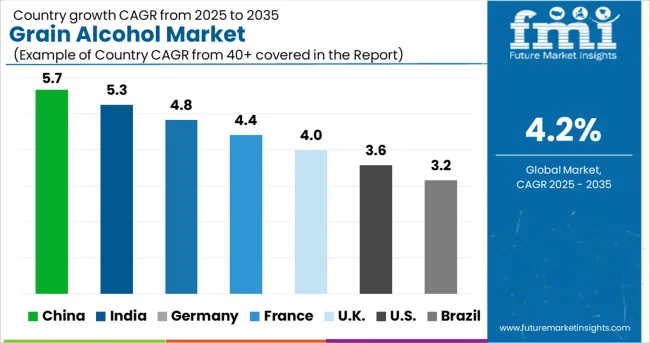
Burgeoning Ethanol Production in the USA to Boost Grain Alcohol Market
According to FMI, the USA is considered to have the highest value share in the global grain alcohol market during the forecast period. Growth in the market is underpinned by the presence of leading key players in the country. The USA is expected to hold more than 75.6% market share in the North American grain alcohol industry, registering a CAGR of 1.8% over the forecast period.
North America is the top producer of the fuel ethanol which holds a significant share of 55% in global fuel ethanol production. The demand for alternate sources of fossil fuel owing to reducing dependency on them has surged the market demand for the production of fuel ethanol.
Germany Grain Alcohol Market to Benefit from Expansion of Food and Beverage Industry
According to FMI, Germany is estimated to hold more than 18.0% share of the Europe grain alcohol market in 2025 and is estimated to grow with a CAGR of around 3.1% in the forecast period.
Germany's grain alcohol market will gain traction on the back of the expansion of the food and beverage industry. One of the main markets for polyols sweeteners which are also known as sugar alcohol is gaining immense traction in Europe.
Hence, demand for low-calorie goods, polyols sweetener, which are similar to sugar but have a reduced calorie content is rising. These sugar polyols act as bulking agents, increasing the mass of the product while also sweetening it without adding calories. This is expected to boost the demand in the grain alcohol market.
Increasing Consumption of Alcohol to Push the Sales of Grain Alcohol
China is expected to dominate the East Asia grain alcohol market, holding a significant market share of more than 37.8% through 2035. As per FMI, sales in China are expected to grow at a CAGR of around 3.6% in the forecast period.
Alcohol consumption in China is booming at a faster rate than in other regions of the world. Increasing alcohol production and consumption, as well as rates of alcohol-related illnesses, have been steadily increasing over the past years.
On the back of this, the demand for grain alcohol in China is expected to increase over the forecast period.
2 Out of 5 Grain Alcohol Sales are to be Contributed by the Corn Segment
Based on the source, the corn segment is expected to dominate the grain alcohol market, holding more than 41% of the market share in 2025. It is expected to grow with a CAGR of around 2.1% over the forecast period.
Corn grain is a desirable ethanol feedstock because of its high starch content and ease of ethanol conversion. The segment is expected to benefit from infrastructure that allows it to cultivate, harvest, and store large amounts of corn.
Corn starch must be boiled with glucoamylase enzymes to convert the starch to simple sugars, unlike sugarcane, where the squeezed sugar water can be fermented directly.
Rising Alcohol Consumption Will Drive the Demand for Grain Alcohol in Beverage Industry
In terms of application, the beverages segment is expected to dominate the market, accounting for over 41.6% share in the year 2025 and it is expected to grow with a significant CAGR of around 2.6% over the forecast period.
Increased consumption of beverage products will drive the grain alcohol business. Also, the growing number of breweries in recent years has been a major driver of industry expansion. Alcohol consumption has risen at an exponential rate in recent years.
Major market participants and local producers are sourcing grain alcohol from grain to meet the needs of consumers. Furthermore, the rising popularity of craft beer and locally produced beer is predicted to boost global demand for alcoholic beverages.
Changing lifestyles, growing urbanization, rising alcoholic beverage consumption rates, high disposable incomes, and the popularity of alcoholic beverages among millennials are a few major reasons driving the global grain alcohol market.
Rising Sales of Hand-Sanitizers to Drive the Sales of Grain Alcohol for Disinfectants
In terms of functionality, the disinfectant segment is expected to dominate the market holding more than 31.2% share in the year 2025 and it is expected to grow with a significant CAGR of around 2.3% over the forecast period.
Increased demand for hand sanitizers and disinfectants is expected to boost the grain alcohol market as most of the disinfectants and hand sanitizers include ethanol.
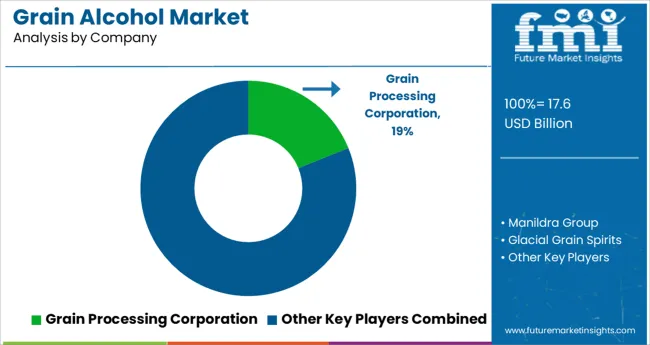
The grain alcohol market is expected to be fragmented due to the presence of various mid-sized and small competitors. Mergers and acquisitions, product innovation, and production capacity expansion are all priorities for major players. In addition to this, the high competition in the market is promoting high product innovation in terms of types, rapid testing kits, marketing, etc.
For instance -
| Attribute | Details |
|---|---|
| Forecast Period | 2025 to 2035 |
| Historical Data Available for | 2020 to 2024 |
| Market Analysis | billion for Value and MT for Volume |
| Key Regions Covered | North America; Latin America; Europe; East Asia; South Asia; Oceania; and the Middle East & Africa |
| Key Countries Covered | USA, Canada, Brazil, Mexico, Chile, Peru, Argentina, Germany, Italy, France, UK, Spain, BENELUX, Nordic, Russia, Poland, China, Japan, South Korea, India, Thailand, Indonesia, Malaysia, Singapore, Australia, New Zealand, GCC Countries, Turkey, South Africa, North Africa, and Central Africa |
| Key Segments Covered | Source, Application, Functionality, Type, and Region |
| Key Companies Profiled | Grain Processing Corporation; Manildra Group; Glacial Grain Spirits; Cristalco; Merck Group; Cargill; Archer-Daniels-Midland Company; Willmar Group; MGP Ingredients, Inc.; Roquette Frères |
| Report Coverage | Market Forecast, Company Share Analysis, Competition Intelligence, Drivers, Restraints, Opportunities and Threats Analysis, Market Dynamics and Challenges, and Strategic Growth Initiatives |
| Customization & Pricing | Available upon Request |
The global grain alcohol market is estimated to be valued at USD 17.6 billion in 2025.
It is projected to reach USD 26.6 billion by 2035.
The market is expected to grow at a 4.2% CAGR between 2025 and 2035.
The key product types are corn, fermented plant materials, grains, grapes, sugarcane, sugarbeets and tubers.
beverages segment is expected to dominate with a 38.6% industry share in 2025.


Our Research Products

The "Full Research Suite" delivers actionable market intel, deep dives on markets or technologies, so clients act faster, cut risk, and unlock growth.

The Leaderboard benchmarks and ranks top vendors, classifying them as Established Leaders, Leading Challengers, or Disruptors & Challengers.

Locates where complements amplify value and substitutes erode it, forecasting net impact by horizon

We deliver granular, decision-grade intel: market sizing, 5-year forecasts, pricing, adoption, usage, revenue, and operational KPIs—plus competitor tracking, regulation, and value chains—across 60 countries broadly.

Spot the shifts before they hit your P&L. We track inflection points, adoption curves, pricing moves, and ecosystem plays to show where demand is heading, why it is changing, and what to do next across high-growth markets and disruptive tech

Real-time reads of user behavior. We track shifting priorities, perceptions of today’s and next-gen services, and provider experience, then pace how fast tech moves from trial to adoption, blending buyer, consumer, and channel inputs with social signals (#WhySwitch, #UX).

Partner with our analyst team to build a custom report designed around your business priorities. From analysing market trends to assessing competitors or crafting bespoke datasets, we tailor insights to your needs.
Supplier Intelligence
Discovery & Profiling
Capacity & Footprint
Performance & Risk
Compliance & Governance
Commercial Readiness
Who Supplies Whom
Scorecards & Shortlists
Playbooks & Docs
Category Intelligence
Definition & Scope
Demand & Use Cases
Cost Drivers
Market Structure
Supply Chain Map
Trade & Policy
Operating Norms
Deliverables
Buyer Intelligence
Account Basics
Spend & Scope
Procurement Model
Vendor Requirements
Terms & Policies
Entry Strategy
Pain Points & Triggers
Outputs
Pricing Analysis
Benchmarks
Trends
Should-Cost
Indexation
Landed Cost
Commercial Terms
Deliverables
Brand Analysis
Positioning & Value Prop
Share & Presence
Customer Evidence
Go-to-Market
Digital & Reputation
Compliance & Trust
KPIs & Gaps
Outputs
Full Research Suite comprises of:
Market outlook & trends analysis
Interviews & case studies
Strategic recommendations
Vendor profiles & capabilities analysis
5-year forecasts
8 regions and 60+ country-level data splits
Market segment data splits
12 months of continuous data updates
DELIVERED AS:
PDF EXCEL ONLINE
Grain Hardness Meter Market Size and Share Forecast Outlook 2025 to 2035
Grain Cooling Spear Market Size and Share Forecast Outlook 2025 to 2035
Grain Roller Market Size and Share Forecast Outlook 2025 to 2035
Grain Mill Grinder Market Size and Share Forecast Outlook 2025 to 2035
Grain-Free Pet Food Market Trends - Growth & Industry Forecast 2024 to 2034
Grain And Seed Cleaning Equipment Market
Migraine Treatment Market Insights by Drug Class, Route of Administration, Distribution Channel, Treatment, and Region through 2035
Migraine Nasal Spray Market Outlook – Trends, Growth & Forecast 2025 to 2035
Feed Grain Market Analysis - Size, Share, and Forecast Outlook 2025 to 2035
Multigrain Premix Market Trends – Healthy Baking & Industry Expansion 2025 to 2035
Horse Grain Feeders Market Size and Share Forecast Outlook 2025 to 2035
Whole Grain & High Fiber Foods Market Growth – Demand, Trends & Forecast 2025–2035
Whole Grain Salty Snacks Market Analysis by Product Type, Product Claim, Source, Distribution Channel and Region Through 2035
Multi-Grain Premixes Market
Acute Migraine Treatment Market Trends – Analysis & Forecast 2024-2034
United Kingdom Whole Grain and High Fiber Foods Market Report – Trends & Forecast 2025–2035
United States Whole Grain and High Fiber Foods Market Report – Trends & Forecast 2025–2035
Commercial Grain Mill Market Size and Share Forecast Outlook 2025 to 2035
Dried Spent Grain Market Trends – Growth & Industry Forecast 2025 to 2035
Europe Whole Grain and High Fiber Foods Market Insights – Size & Forecast 2025–2035

Thank you!
You will receive an email from our Business Development Manager. Please be sure to check your SPAM/JUNK folder too.
Chat With
MaRIA