Reports

- Global Locations -

Headquarters

Future Market Insights, Inc.

Christiana Corporate, 200
Continental Drive, Suite 401,
Newark, Delaware - 19713,
United States

T: +1-845-579-5705

Americas

Future Market Insights, Inc.

616 Corporate Way, Suite 2-9018,
Valley Cottage, NY 10989, United States

T: +1-347-918-3531

MEA

Future Market Insights

1602-6 Jumeirah Bay X2 Tower, Plot No: JLT-PH2-X2A,
Jumeirah Lakes Towers, Dubai,
United Arab Emirates

Europe

Future Market Insights

3rd Floor, 207 Regent Street,
W1B 3HH London
United Kingdom

T: + 44 (0) 20 8123 9659
D: +44 (0) 20 3287 4268

Asia Pacific

Future Market Insights

IndiaLand Global Tech Park, Unit UG-1, Behind Grand HighStreet, Phase 1, Hinjawadi, MH, Pune – 411057, India

Migraine Treatment Market Snapshot (2023 to 2033)

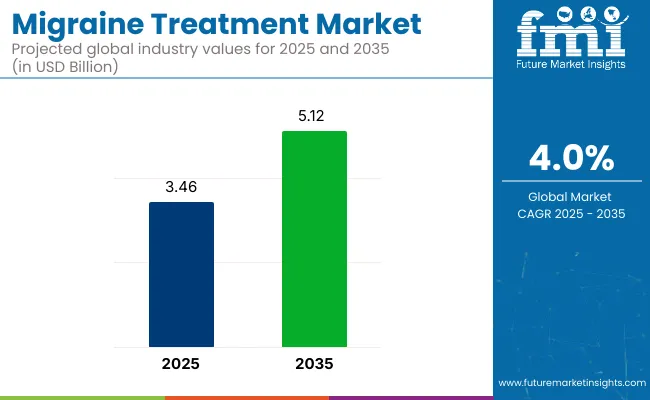
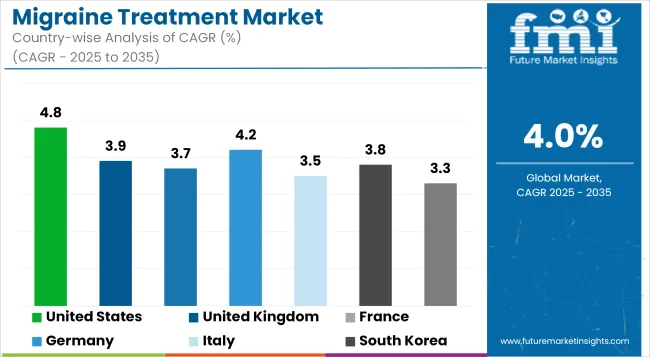
The global Migraine Treatment Market is expected to garner a market value of US$ 3.2 Billion in 2023 and is expected to accumulate a market value of US$ 4.74 Billion by registering a CAGR of 4% in the forecast period 2023 to 2033. The market for Migraine Treatment registered a CAGR of 3% in the historical period 2018 to 2022.

The Migraine Treatment market is a segment of the healthcare industry that deals with the effective management of the condition. The Migraine Treatment market offers a range of products and services for its effective management and treatments including medications such as including over-the-counter pain relievers like aspirin and ibuprofen, lifestyle changes, such as maintaining a regular sleep schedule, avoiding triggers like certain foods or activities, and engaging in stress-reducing activities like exercise or meditation, Neuromodulation devices, Cognitive-behavioral therapy (CBT), Acupuncture, and Nutritional supplements.

Report Attribute Details
Expected Market Value (2023) US$ 3.2 Billion
Anticipated Forecast Value (2033) US$ 4.74 Billion
Projected Growth Rate (2023 to 2033) 4% CAGR

Don't pay for what you don't need

Customize your report by selecting specific countries or regions and save 30%!

2018 to 2022 Migraine Treatment Market Demand Analysis vs. Forecast 2023 to 2033

According to market research and competitive intelligence provider, Future Market Insights- the market for Migraine Treatment reflected a value of 3% during the historical period, 2018 to 2022. During this period, the demand for treatment for Migraine increased due to the rising prevalence of Stress, Changes in routine, Lack of access to healthcare, Changes in medication access and so on. With many people working from home and changes to daily routines, some individuals experienced changes in sleep patterns, diet, and exercise that triggered migraines.

The market for Migraine Treatment is gaining prominence as there is growing interest in non-pharmacological approaches to migraine treatment, such as cognitive behavioral therapy, acupuncture, and relaxation techniques. This has led to the emergence of new players in the market, including digital health companies offering mobile apps and other technology-based solutions to help patients manage their migraines.

Looking ahead to the period from 2023 to 2033, the gene therapy market for Migraine is expected to continue growing. The increasing prevalence of Migraine and the rising demand for effective treatments are expected to drive demand for gene therapy in this space.

Overall, the migraine treatment market is expected to continue to grow in the coming years, as new treatments become available and awareness of the condition continues to increase. In the years to come, increasing focus by government organizations and private agencies like WHO and pharmaceutical companies are creating awareness of Migraine Treatment, fuelling the market growth. Thus, the market for Migraine Treatment is expected to register a CAGR of 4% in the forecast period 2023 to 2033.

Which are Some Prominent Drivers of the Migraine Treatment Market?

Growing advancements in diagnostic and treatment options to push the market growth

The global Migraine Treatment market is primarily driven by an increased prevalence of Migraine, which is driving the demand for effective treatments. According to the Migraine Research Foundation, migraine is the third most common disease in the world, affecting an estimated 1 billion people globally. This large patient population represents a significant market opportunity for companies developing migraine treatments.

In recent years, there has been a growing focus on developing targeted therapies that can provide more effective and personalized treatment for migraine patients. For example, new monoclonal antibodies targeting the calcitonin gene-related peptide (CGRP) pathway have been shown to be highly effective in preventing migraines in some patients.

Additionally, the growth of the Migraine Treatment market is owed to ongoing research and development, which is leading to an increased potential for new and improved treatment options to become available for patients with Migraine. There is a growing investment in research and development of treatments for Migraine, with many biotech and pharmaceutical companies working on developing new gene therapies for these conditions.

For instance, in February 2022, Biohaven Pharmaceutical Holding Company Ltd. and Pfizer Inc. reported that the Committee for Medicinal Products for Human Use (CHMP) of the European Medicines Agency (EMA) adopted a positive opinion for Rimegepant, a calcitonin gene-related peptide (CGRP) receptor antagonist. It is recommended as the 75 mg dose of Rimegepant (available as an orally dissolving tablet) for marketing authorization for both the acute treatment of migraine with or without aura in adults and the preventive treatment of episodic migraine in adults who have at least four migraine attacks per month.

As more effective treatments become available, patients with Migraine may experience better health outcomes and quality of life. This could increase demand for management options and further drive market growth.

Sabyasachi Ghosh
Sabyasachi Ghosh

Principal Consultant

Talk to Analyst

Find your sweet spots for generating winning opportunities in this market.

What are the Challenges Faced by Migraine Treatment Market?

Expensive Cost of Treatment to restrict Market Growth

The market is projected to get significantly affected by the challenging factors such as Limited treatment options, High cost of medications, Limited research and development, Stigma and lack of awareness, and Access to care.

Migraines are often misunderstood and stigmatized, which can make it difficult for patients to receive appropriate care and support. Furthermore, patients in some areas may not have access to specialized headache clinics or neurologists. Many migraine medications are expensive, which can be a barrier to access for some patients. In addition, many patients experience side effects from medications, which can make it difficult to find a treatment that is both effective and well-tolerated.

Region-Wise Insights

How is the Migraine Treatment Market Turning Out in the South & East Asia Region?

Increasing Healthcare Spending Shaping Landscape for Migraine Treatment in South & East Asia

Migraines are becoming increasingly prevalent in the south & East Asia region, with an estimated 8-12% of the population affected by the condition. As the population grows and ages, the number of individuals with migraines is expected to increase, driving demand for treatments.

Healthcare spending is increasing in many countries in the region, which is expected to drive demand for migraine treatments. As individuals become more affluent and more willing to spend on healthcare, demand for treatments is likely to increase.

What are the Factors Boosting the Market for Migraine Treatment in North America?

Increasing Focus on Technological advancements Shaping Landscape for Migraine Treatment in North America

North America is anticipated to acquire a market share of about 40% in the forecast period. This growth is attributable to the high prevalence of Migraine in North America which has led to a strong demand for new treatments. Additionally, North America has a well-developed healthcare infrastructure, along with a high level of research and development, significant investment, and a supportive regulatory environment.

The United States of America holds the highest share in the North American market, followed by Canada. According to the article titled "What is Migraine?" published in the JAMA Network in January 2022, in the United States, 17.1% of women and 5.6% of men reported having migraine symptoms. The emergence of digital health technologies and mobile apps is also driving growth in the migraine treatment market. These technologies offer new ways for patients to manage their migraines, and can also provide healthcare professionals with valuable insights into patient symptoms and treatment response.

Presence of a large number of pharmaceutical companies, which are investing heavily in the development of new, targeted treatments for the condition, and high level of healthcare expenditure leading to a large patient population are some of the factors responsible for the growth of the market in the region.

Get the data you need at a Fraction of the cost

Personalize your report by choosing insights you need
and save 40%!

Category-Wise Insights

By Treatment, Which Segment is Likely to Account for a Significant Share?

Preventive medications to hold a significant share and push market growth

According to various reports and studies, Preventive medicines are used to reduce the frequency and severity of migraine attacks, and are taken on a regular basis. These medications are typically used for patients who experience frequent or severe migraines, and can include beta blockers, antidepressants, anticonvulsants, and CGRP inhibitors.

The preventive medicine segment is expected to grow at a faster rate due to increasing awareness of the benefits of preventive treatments and the availability of new and more effective medications.

By Distribution Channel, Which Segment is Likely to Account for a Significant Share?

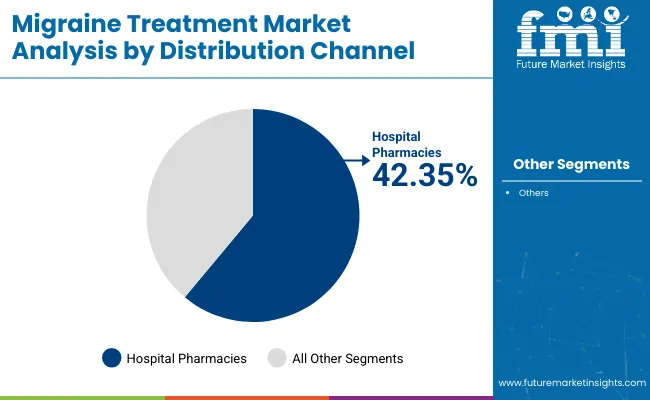
Hospital Pharmacies to take the lead and drive market growth

According to the FMI analysis, Hospital pharmacies account for the largest market share. The requirement for several hospital stays and visits during the Migraine Treatment treatment facilitates the growth of this segment. Majority of the serious diseases involving the nervous system are treated in hospitals, and with the availability of trained medical personnel, it is simpler to control an individual's health more correctly.

Market Competition

Key players in the market include companies such as Lundbeck Seattle BioPharmaceutical, Eli Lilly and Company, Amgen, Novartis, Allergan, Teva Pharmaceuticals, Biohaven Pharmaceuticals, Biohaven Pharmaceuticals, Dr. Reddy’s Labs, AbbVie, Impel NeuroPharma, Zosano Pharma, Aeon Biopharma Inc., Ionis Pharmaceuticals, Inc., and Charleston Laboratories, along with healthcare providers and technology companies among other global players.

  • In January 2022, BioDelivery Sciences launched a new drug, Elyxyb (celecoxib oral solution), a fast-acting liquid. It is one of the first Food and Drug Administration-approved ready-to-use oral solutions for adults in the acute treatment of migraine, with or without aura.
  • In September 2021, AbbVie received FDA approval for QULIPTA™ (atogepant), the first oral calcitonin gene-related peptide (CGRP) receptor antagonist (gepant) specifically designed to prevent episodic migraine in adults. QULIPTA is an oral medication that can help reduce monthly migraine days with a once-daily dosage that works quickly and continuously. AbbVie is proud to offer three products for the complete spectrum of migraine treatment, including preventive therapies for chronic and episodic migraine and an acute treatment for migraine attacks. This approval is backed by a clinical program that evaluated the safety, tolerability, and effectiveness of QULIPTA in almost 2,000 patients who experienced 4 to 14 migraine days per month, including the Phase 3 ADVANCE study, the Phase 2b/3 study, and the Phase 3 long-term safety study.

Report Scope

Report Attribute Details
Market Value in 2023 US$ 3.2 Billion
Market Value in 2033 US$ 4.74 Billion
Growth Rate CAGR of 4% from 2023 to 2033
Base Year for Estimation 2022
Historical Data 2018 to 2022
Forecast Period 2023 to 2033
Quantitative Units Revenue in USD Million and CAGR from 2023 to 2033
Report Coverage Revenue Forecast, Volume Forecast, Company Ranking, Competitive Landscape, Growth Factors, Trends and Pricing Analysis
Segments Covered
  • Drug Class
  • Route of Administration
  • Treatment
  • Distribution Channel
  • Region
Regions Covered
  • North America
  • Latin America
  • Europe
  • South Asia
  • East Asia
  • Oceania
  • Middle East & Africa
Key Countries Profiled
  • USA
  • Canada
  • Brazil
  • Mexico
  • Rest of Latin America
  • Germany
  • United Kingdom
  • France
  • Spain
  • Italy
  • Rest of Europe
  • Malaysia
  • Singapore
  • China
  • India
  • Thailand
  • Rest of South Asia
  • Gulf Cooperation Council
  • Japan
  • South Korea
  • Australia
  • New Zealand
  • GCC countries
  • South Africa
  • Israel
  • Rest of MEA
Key Companies Profiled Lundbeck Seattle BioPharmaceutical, Eli Lilly and Company, Amgen, Novartis, Allergan, Teva Pharmaceuticals, Biohaven Pharmaceuticals, Biohaven Pharmaceuticals, Dr. Reddy’s Labs, AbbVie, Impel NeuroPharma, Zosano Pharma, Aeon Biopharma Inc., Ionis Pharmaceuticals, Inc., and Charleston Laboratories,
Customization Available Upon Request

Key Segments Profiled in the Migraine Treatment Industry Survey

Drug Class:

  • Zavegepant
  • Atogepant
  • Zolmitriptan

Route of Administration:

  • Oral
  • Parenteral
  • Nasal Sprays

Distribution Channel:

  • Hospital Pharmacies
  • Retail Pharmacies
  • Online Pharmacies

Treatment:

  • Abortive Medicine
  • Preventive Medicine

Region:

  • North America
  • Latin America
  • Europe
  • East Asia
  • South Asia
  • Oceania
  • Middle East & Africa

Frequently Asked Questions

How Big is the Migraine Treatment Market?

The migraine treatment market is worth US$ 3.2 billion in 2023.

What is the CAGR for the Market Forecast?

The market is forecast to expand at a CAGR of 4% CAGR.

Which Factors are Shaping the Market’s Landscape?

Increasing advancements in the migraine treatment and surging focus on the targeted therapies.

Which Region Monopolizes the Marketplace?

North America, with a market share of 40%, monopolizes the global market.

Which Treatment Holds Significant Market Share?

Preventive medicine holds significant market share.

Table of Content

1. Executive Summary | Migraine Treatment Market

    1.1. Global Market Outlook

    1.2. Demand-side Trends

    1.3. Supply-side Trends

    1.4. Technology Roadmap Analysis

    1.5. Analysis and Recommendations

2. Market Overview

    2.1. Market Coverage / Taxonomy

    2.2. Market Definition / Scope / Limitations

3. Market Background

    3.1. Market Dynamics

        3.1.1. Drivers

        3.1.2. Restraints

        3.1.3. Opportunity

        3.1.4. Trends

    3.2. Scenario Forecast

        3.2.1. Demand in Optimistic Scenario

        3.2.2. Demand in Likely Scenario

        3.2.3. Demand in Conservative Scenario

    3.3. Opportunity Map Analysis

    3.4. Investment Feasibility Matrix

    3.5. PESTLE and Porter’s Analysis

    3.6. Regulatory Landscape

        3.6.1. By Key Regions

        3.6.2. By Key Countries

    3.7. Regional Parent Market Outlook

4. Global Market Analysis 2018 to 2022 and Forecast, 2023 to 2033

    4.1. Historical Market Size Value (US$ Million) Analysis, 2018 to 2022

    4.2. Current and Future Market Size Value (US$ Million) Projections, 2023 to 2033

        4.2.1. Y-o-Y Growth Trend Analysis

        4.2.2. Absolute $ Opportunity Analysis

5. Global Market Analysis 2018 to 2022 and Forecast 2023 to 2033, By Drug Class

    5.1. Introduction / Key Findings

    5.2. Historical Market Size Value (US$ Million) Analysis By Drug Class, 2018 to 2022

    5.3. Current and Future Market Size Value (US$ Million) Analysis and Forecast By Drug Class, 2023 to 2033

        5.3.1. Zavegepant

        5.3.2. Atogepant

        5.3.3. Zolmitriptan

    5.4. Y-o-Y Growth Trend Analysis By Drug Class, 2018 to 2022

    5.5. Absolute $ Opportunity Analysis By Drug Class, 2023 to 2033

6. Global Market Analysis 2018 to 2022 and Forecast 2023 to 2033, By Route of Administration

    6.1. Introduction / Key Findings

    6.2. Historical Market Size Value (US$ Million) Analysis By Route of Administration, 2018 to 2022

    6.3. Current and Future Market Size Value (US$ Million) Analysis and Forecast By Route of Administration, 2023 to 2033

        6.3.1. Oral

        6.3.2. Parenteral

        6.3.3. Nasal Sprays

    6.4. Y-o-Y Growth Trend Analysis By Route of Administration, 2018 to 2022

    6.5. Absolute $ Opportunity Analysis By Route of Administration, 2023 to 2033

7. Global Market Analysis 2018 to 2022 and Forecast 2023 to 2033, By Treatment 

    7.1. Introduction / Key Findings

    7.2. Historical Market Size Value (US$ Million) Analysis By Treatment , 2018 to 2022

    7.3. Current and Future Market Size Value (US$ Million) Analysis and Forecast By Treatment , 2023 to 2033

        7.3.1. Abortive Medicine

        7.3.2. Preventive Medicine

    7.4. Y-o-Y Growth Trend Analysis By Treatment , 2018 to 2022

    7.5. Absolute $ Opportunity Analysis By Treatment , 2023 to 2033

8. Global Market Analysis 2018 to 2022 and Forecast 2023 to 2033, By Distribution Channel

    8.1. Introduction / Key Findings

    8.2. Historical Market Size Value (US$ Million) Analysis By Distribution Channel, 2018 to 2022

    8.3. Current and Future Market Size Value (US$ Million) Analysis and Forecast By Distribution Channel, 2023 to 2033

        8.3.1. Hospital Pharmacies

        8.3.2. Retail Pharmacies

        8.3.3. Online Pharmacies

    8.4. Y-o-Y Growth Trend Analysis By Distribution Channel, 2018 to 2022

    8.5. Absolute $ Opportunity Analysis By Distribution Channel, 2023 to 2033

9. Global Market Analysis 2018 to 2022 and Forecast 2023 to 2033, By Region

    9.1. Introduction

    9.2. Historical Market Size Value (US$ Million) Analysis By Region, 2018 to 2022

    9.3. Current Market Size Value (US$ Million) Analysis and Forecast By Region, 2023 to 2033

        9.3.1. North America

        9.3.2. Latin America

        9.3.3. Europe

        9.3.4. South Asia

        9.3.5. East Asia

        9.3.6. Oceania

        9.3.7. MEA

    9.4. Market Attractiveness Analysis By Region

10. North America Market Analysis 2018 to 2022 and Forecast 2023 to 2033, By Country

    10.1. Historical Market Size Value (US$ Million) Trend Analysis By Market Taxonomy, 2018 to 2022

    10.2. Market Size Value (US$ Million) Forecast By Market Taxonomy, 2023 to 2033

        10.2.1. By Country

            10.2.1.1. USA

            10.2.1.2. Canada

        10.2.2. By Drug Class

        10.2.3. By Route of Administration

        10.2.4. By Treatment

        10.2.5. By Distribution Channel

    10.3. Market Attractiveness Analysis

        10.3.1. By Country

        10.3.2. By Drug Class

        10.3.3. By Route of Administration

        10.3.4. By Treatment

        10.3.5. By Distribution Channel

    10.4. Key Takeaways

11. Latin America Market Analysis 2018 to 2022 and Forecast 2023 to 2033, By Country

    11.1. Historical Market Size Value (US$ Million) Trend Analysis By Market Taxonomy, 2018 to 2022

    11.2. Market Size Value (US$ Million) Forecast By Market Taxonomy, 2023 to 2033

        11.2.1. By Country

            11.2.1.1. Brazil

            11.2.1.2. Mexico

            11.2.1.3. Rest of Latin America

        11.2.2. By Drug Class

        11.2.3. By Route of Administration

        11.2.4. By Treatment

        11.2.5. By Distribution Channel

    11.3. Market Attractiveness Analysis

        11.3.1. By Country

        11.3.2. By Drug Class

        11.3.3. By Route of Administration

        11.3.4. By Treatment

        11.3.5. By Distribution Channel

    11.4. Key Takeaways

12. Europe Market Analysis 2018 to 2022 and Forecast 2023 to 2033, By Country

    12.1. Historical Market Size Value (US$ Million) Trend Analysis By Market Taxonomy, 2018 to 2022

    12.2. Market Size Value (US$ Million) Forecast By Market Taxonomy, 2023 to 2033

        12.2.1. By Country

            12.2.1.1. Germany

            12.2.1.2. United Kingdom

            12.2.1.3. France

            12.2.1.4. Spain

            12.2.1.5. Italy

            12.2.1.6. Rest of Europe

        12.2.2. By Drug Class

        12.2.3. By Route of Administration

        12.2.4. By Treatment

        12.2.5. By Distribution Channel

    12.3. Market Attractiveness Analysis

        12.3.1. By Country

        12.3.2. By Drug Class

        12.3.3. By Route of Administration

        12.3.4. By Treatment

        12.3.5. By Distribution Channel

    12.4. Key Takeaways

13. South Asia Market Analysis 2018 to 2022 and Forecast 2023 to 2033, By Country

    13.1. Historical Market Size Value (US$ Million) Trend Analysis By Market Taxonomy, 2018 to 2022

    13.2. Market Size Value (US$ Million) Forecast By Market Taxonomy, 2023 to 2033

        13.2.1. By Country

            13.2.1.1. India

            13.2.1.2. Malaysia

            13.2.1.3. Singapore

            13.2.1.4. Thailand

            13.2.1.5. Rest of South Asia

        13.2.2. By Drug Class

        13.2.3. By Route of Administration

        13.2.4. By Treatment

        13.2.5. By Distribution Channel

    13.3. Market Attractiveness Analysis

        13.3.1. By Country

        13.3.2. By Drug Class

        13.3.3. By Route of Administration

        13.3.4. By Treatment

        13.3.5. By Distribution Channel

    13.4. Key Takeaways

14. East Asia Market Analysis 2018 to 2022 and Forecast 2023 to 2033, By Country

    14.1. Historical Market Size Value (US$ Million) Trend Analysis By Market Taxonomy, 2018 to 2022

    14.2. Market Size Value (US$ Million) Forecast By Market Taxonomy, 2023 to 2033

        14.2.1. By Country

            14.2.1.1. China

            14.2.1.2. Japan

            14.2.1.3. South Korea

        14.2.2. By Drug Class

        14.2.3. By Route of Administration

        14.2.4. By Treatment

        14.2.5. By Distribution Channel

    14.3. Market Attractiveness Analysis

        14.3.1. By Country

        14.3.2. By Drug Class

        14.3.3. By Route of Administration

        14.3.4. By Treatment

        14.3.5. By Distribution Channel

    14.4. Key Takeaways

15. Oceania Market Analysis 2018 to 2022 and Forecast 2023 to 2033, By Country

    15.1. Historical Market Size Value (US$ Million) Trend Analysis By Market Taxonomy, 2018 to 2022

    15.2. Market Size Value (US$ Million) Forecast By Market Taxonomy, 2023 to 2033

        15.2.1. By Country

            15.2.1.1. Australia

            15.2.1.2. New Zealand

        15.2.2. By Drug Class

        15.2.3. By Route of Administration

        15.2.4. By Treatment

        15.2.5. By Distribution Channel

    15.3. Market Attractiveness Analysis

        15.3.1. By Country

        15.3.2. By Drug Class

        15.3.3. By Route of Administration

        15.3.4. By Treatment

        15.3.5. By Distribution Channel

    15.4. Key Takeaways

16. MEA Market Analysis 2018 to 2022 and Forecast 2023 to 2033, By Country

    16.1. Historical Market Size Value (US$ Million) Trend Analysis By Market Taxonomy, 2018 to 2022

    16.2. Market Size Value (US$ Million) Forecast By Market Taxonomy, 2023 to 2033

        16.2.1. By Country

            16.2.1.1. GCC Countries

            16.2.1.2. South Africa

            16.2.1.3. Israel

            16.2.1.4. Rest of MEA

        16.2.2. By Drug Class

        16.2.3. By Route of Administration

        16.2.4. By Treatment

        16.2.5. By Distribution Channel

    16.3. Market Attractiveness Analysis

        16.3.1. By Country

        16.3.2. By Drug Class

        16.3.3. By Route of Administration

        16.3.4. By Treatment

        16.3.5. By Distribution Channel

    16.4. Key Takeaways

17. Key Countries Market Analysis

    17.1. USA

        17.1.1. Pricing Analysis

        17.1.2. Market Share Analysis, 2022

            17.1.2.1. By Drug Class

            17.1.2.2. By Route of Administration

            17.1.2.3. By Treatment

            17.1.2.4. By Distribution Channel

    17.2. Canada

        17.2.1. Pricing Analysis

        17.2.2. Market Share Analysis, 2022

            17.2.2.1. By Drug Class

            17.2.2.2. By Route of Administration

            17.2.2.3. By Treatment

            17.2.2.4. By Distribution Channel

    17.3. Brazil

        17.3.1. Pricing Analysis

        17.3.2. Market Share Analysis, 2022

            17.3.2.1. By Drug Class

            17.3.2.2. By Route of Administration

            17.3.2.3. By Treatment

            17.3.2.4. By Distribution Channel

    17.4. Mexico

        17.4.1. Pricing Analysis

        17.4.2. Market Share Analysis, 2022

            17.4.2.1. By Drug Class

            17.4.2.2. By Route of Administration

            17.4.2.3. By Treatment

            17.4.2.4. By Distribution Channel

    17.5. Germany

        17.5.1. Pricing Analysis

        17.5.2. Market Share Analysis, 2022

            17.5.2.1. By Drug Class

            17.5.2.2. By Route of Administration

            17.5.2.3. By Treatment

            17.5.2.4. By Distribution Channel

    17.6. United Kingdom

        17.6.1. Pricing Analysis

        17.6.2. Market Share Analysis, 2022

            17.6.2.1. By Drug Class

            17.6.2.2. By Route of Administration

            17.6.2.3. By Treatment

            17.6.2.4. By Distribution Channel

    17.7. France

        17.7.1. Pricing Analysis

        17.7.2. Market Share Analysis, 2022

            17.7.2.1. By Drug Class

            17.7.2.2. By Route of Administration

            17.7.2.3. By Treatment

            17.7.2.4. By Distribution Channel

    17.8. Spain

        17.8.1. Pricing Analysis

        17.8.2. Market Share Analysis, 2022

            17.8.2.1. By Drug Class

            17.8.2.2. By Route of Administration

            17.8.2.3. By Treatment

            17.8.2.4. By Distribution Channel

    17.9. Italy

        17.9.1. Pricing Analysis

        17.9.2. Market Share Analysis, 2022

            17.9.2.1. By Drug Class

            17.9.2.2. By Route of Administration

            17.9.2.3. By Treatment

            17.9.2.4. By Distribution Channel

    17.10. India

        17.10.1. Pricing Analysis

        17.10.2. Market Share Analysis, 2022

            17.10.2.1. By Drug Class

            17.10.2.2. By Route of Administration

            17.10.2.3. By Treatment

            17.10.2.4. By Distribution Channel

    17.11. Malaysia

        17.11.1. Pricing Analysis

        17.11.2. Market Share Analysis, 2022

            17.11.2.1. By Drug Class

            17.11.2.2. By Route of Administration

            17.11.2.3. By Treatment

            17.11.2.4. By Distribution Channel

    17.12. Singapore

        17.12.1. Pricing Analysis

        17.12.2. Market Share Analysis, 2022

            17.12.2.1. By Drug Class

            17.12.2.2. By Route of Administration

            17.12.2.3. By Treatment

            17.12.2.4. By Distribution Channel

    17.13. Thailand

        17.13.1. Pricing Analysis

        17.13.2. Market Share Analysis, 2022

            17.13.2.1. By Drug Class

            17.13.2.2. By Route of Administration

            17.13.2.3. By Treatment

            17.13.2.4. By Distribution Channel

    17.14. China

        17.14.1. Pricing Analysis

        17.14.2. Market Share Analysis, 2022

            17.14.2.1. By Drug Class

            17.14.2.2. By Route of Administration

            17.14.2.3. By Treatment

            17.14.2.4. By Distribution Channel

    17.15. Japan

        17.15.1. Pricing Analysis

        17.15.2. Market Share Analysis, 2022

            17.15.2.1. By Drug Class

            17.15.2.2. By Route of Administration

            17.15.2.3. By Treatment

            17.15.2.4. By Distribution Channel

    17.16. South Korea

        17.16.1. Pricing Analysis

        17.16.2. Market Share Analysis, 2022

            17.16.2.1. By Drug Class

            17.16.2.2. By Route of Administration

            17.16.2.3. By Treatment

            17.16.2.4. By Distribution Channel

    17.17. Australia

        17.17.1. Pricing Analysis

        17.17.2. Market Share Analysis, 2022

            17.17.2.1. By Drug Class

            17.17.2.2. By Route of Administration

            17.17.2.3. By Treatment

            17.17.2.4. By Distribution Channel

    17.18. New Zealand

        17.18.1. Pricing Analysis

        17.18.2. Market Share Analysis, 2022

            17.18.2.1. By Drug Class

            17.18.2.2. By Route of Administration

            17.18.2.3. By Treatment

            17.18.2.4. By Distribution Channel

    17.19. GCC Countries

        17.19.1. Pricing Analysis

        17.19.2. Market Share Analysis, 2022

            17.19.2.1. By Drug Class

            17.19.2.2. By Route of Administration

            17.19.2.3. By Treatment

            17.19.2.4. By Distribution Channel

    17.20. South Africa

        17.20.1. Pricing Analysis

        17.20.2. Market Share Analysis, 2022

            17.20.2.1. By Drug Class

            17.20.2.2. By Route of Administration

            17.20.2.3. By Treatment

            17.20.2.4. By Distribution Channel

    17.21. Israel

        17.21.1. Pricing Analysis

        17.21.2. Market Share Analysis, 2022

            17.21.2.1. By Drug Class

            17.21.2.2. By Route of Administration

            17.21.2.3. By Treatment

            17.21.2.4. By Distribution Channel

18. Market Structure Analysis

    18.1. Competition Dashboard

    18.2. Competition Benchmarking

    18.3. Market Share Analysis of Top Players

        18.3.1. By Regional

        18.3.2. By Drug Class

        18.3.3. By Route of Administration

        18.3.4. By Treatment

        18.3.5. By Distribution Channel

19. Competition Analysis

    19.1. Competition Deep Dive

        19.1.1. Lundbeck Seattle BioPharmaceutical

            19.1.1.1. Overview

            19.1.1.2. Product Portfolio

            19.1.1.3. Profitability by Market Segments

            19.1.1.4. Sales Footprint

            19.1.1.5. Strategy Overview

                19.1.1.5.1. Marketing Strategy

        19.1.2. Eli Lilly and Company

            19.1.2.1. Overview

            19.1.2.2. Product Portfolio

            19.1.2.3. Profitability by Market Segments

            19.1.2.4. Sales Footprint

            19.1.2.5. Strategy Overview

                19.1.2.5.1. Marketing Strategy

        19.1.3. Amgen

            19.1.3.1. Overview

            19.1.3.2. Product Portfolio

            19.1.3.3. Profitability by Market Segments

            19.1.3.4. Sales Footprint

            19.1.3.5. Strategy Overview

                19.1.3.5.1. Marketing Strategy

        19.1.4. Novartis

            19.1.4.1. Overview

            19.1.4.2. Product Portfolio

            19.1.4.3. Profitability by Market Segments

            19.1.4.4. Sales Footprint

            19.1.4.5. Strategy Overview

                19.1.4.5.1. Marketing Strategy

        19.1.5. Teva Pharmaceuticals

            19.1.5.1. Overview

            19.1.5.2. Product Portfolio

            19.1.5.3. Profitability by Market Segments

            19.1.5.4. Sales Footprint

            19.1.5.5. Strategy Overview

                19.1.5.5.1. Marketing Strategy

        19.1.6. Allergan

            19.1.6.1. Overview

            19.1.6.2. Product Portfolio

            19.1.6.3. Profitability by Market Segments

            19.1.6.4. Sales Footprint

            19.1.6.5. Strategy Overview

                19.1.6.5.1. Marketing Strategy

        19.1.7. Biohaven Pharmaceuticals

            19.1.7.1. Overview

            19.1.7.2. Product Portfolio

            19.1.7.3. Profitability by Market Segments

            19.1.7.4. Sales Footprint

            19.1.7.5. Strategy Overview

                19.1.7.5.1. Marketing Strategy

        19.1.8. Dr. Reddy’s Labs

            19.1.8.1. Overview

            19.1.8.2. Product Portfolio

            19.1.8.3. Profitability by Market Segments

            19.1.8.4. Sales Footprint

            19.1.8.5. Strategy Overview

                19.1.8.5.1. Marketing Strategy

        19.1.9. AbbVie

            19.1.9.1. Overview

            19.1.9.2. Product Portfolio

            19.1.9.3. Profitability by Market Segments

            19.1.9.4. Sales Footprint

            19.1.9.5. Strategy Overview

                19.1.9.5.1. Marketing Strategy

        19.1.10. Impel NeuroPharma

            19.1.10.1. Overview

            19.1.10.2. Product Portfolio

            19.1.10.3. Profitability by Market Segments

            19.1.10.4. Sales Footprint

            19.1.10.5. Strategy Overview

                19.1.10.5.1. Marketing Strategy

        19.1.11. Zosano Pharma

            19.1.11.1. Overview

            19.1.11.2. Product Portfolio

            19.1.11.3. Profitability by Market Segments

            19.1.11.4. Sales Footprint

            19.1.11.5. Strategy Overview

                19.1.11.5.1. Marketing Strategy

        19.1.12. Axsome Therapeutics

            19.1.12.1. Overview

            19.1.12.2. Product Portfolio

            19.1.12.3. Profitability by Market Segments

            19.1.12.4. Sales Footprint

            19.1.12.5. Strategy Overview

                19.1.12.5.1. Marketing Strategy

        19.1.13. Aeon Biopharma Inc.

            19.1.13.1. Overview

            19.1.13.2. Product Portfolio

            19.1.13.3. Profitability by Market Segments

            19.1.13.4. Sales Footprint

            19.1.13.5. Strategy Overview

                19.1.13.5.1. Marketing Strategy

        19.1.14. Ionis Pharmaceuticals, Inc.

            19.1.14.1. Overview

            19.1.14.2. Product Portfolio

            19.1.14.3. Profitability by Market Segments

            19.1.14.4. Sales Footprint

            19.1.14.5. Strategy Overview

                19.1.14.5.1. Marketing Strategy

        19.1.15. Charleston Laboratories

            19.1.15.1. Overview

            19.1.15.2. Product Portfolio

            19.1.15.3. Profitability by Market Segments

            19.1.15.4. Sales Footprint

            19.1.15.5. Strategy Overview

                19.1.15.5.1. Marketing Strategy

20. Assumptions & Acronyms Used

21. Research Methodology

List of Tables

Table 1: Global Market Value (US$ Million) Forecast by Region, 2018 to 2033

Table 2: Global Market Value (US$ Million) Forecast by Drug Class, 2018 to 2033

Table 3: Global Market Value (US$ Million) Forecast by Route of Administration, 2018 to 2033

Table 4: Global Market Value (US$ Million) Forecast by Treatment , 2018 to 2033

Table 5: Global Market Value (US$ Million) Forecast by Distribution Channel, 2018 to 2033

Table 6: North America Market Value (US$ Million) Forecast by Country, 2018 to 2033

Table 7: North America Market Value (US$ Million) Forecast by Drug Class, 2018 to 2033

Table 8: North America Market Value (US$ Million) Forecast by Route of Administration, 2018 to 2033

Table 9: North America Market Value (US$ Million) Forecast by Treatment , 2018 to 2033

Table 10: North America Market Value (US$ Million) Forecast by Distribution Channel, 2018 to 2033

Table 11: Latin America Market Value (US$ Million) Forecast by Country, 2018 to 2033

Table 12: Latin America Market Value (US$ Million) Forecast by Drug Class, 2018 to 2033

Table 13: Latin America Market Value (US$ Million) Forecast by Route of Administration, 2018 to 2033

Table 14: Latin America Market Value (US$ Million) Forecast by Treatment , 2018 to 2033

Table 15: Latin America Market Value (US$ Million) Forecast by Distribution Channel, 2018 to 2033

Table 16: Europe Market Value (US$ Million) Forecast by Country, 2018 to 2033

Table 17: Europe Market Value (US$ Million) Forecast by Drug Class, 2018 to 2033

Table 18: Europe Market Value (US$ Million) Forecast by Route of Administration, 2018 to 2033

Table 19: Europe Market Value (US$ Million) Forecast by Treatment , 2018 to 2033

Table 20: Europe Market Value (US$ Million) Forecast by Distribution Channel, 2018 to 2033

Table 21: South Asia Market Value (US$ Million) Forecast by Country, 2018 to 2033

Table 22: South Asia Market Value (US$ Million) Forecast by Drug Class, 2018 to 2033

Table 23: South Asia Market Value (US$ Million) Forecast by Route of Administration, 2018 to 2033

Table 24: South Asia Market Value (US$ Million) Forecast by Treatment , 2018 to 2033

Table 25: South Asia Market Value (US$ Million) Forecast by Distribution Channel, 2018 to 2033

Table 26: East Asia Market Value (US$ Million) Forecast by Country, 2018 to 2033

Table 27: East Asia Market Value (US$ Million) Forecast by Drug Class, 2018 to 2033

Table 28: East Asia Market Value (US$ Million) Forecast by Route of Administration, 2018 to 2033

Table 29: East Asia Market Value (US$ Million) Forecast by Treatment , 2018 to 2033

Table 30: East Asia Market Value (US$ Million) Forecast by Distribution Channel, 2018 to 2033

Table 31: Oceania Market Value (US$ Million) Forecast by Country, 2018 to 2033

Table 32: Oceania Market Value (US$ Million) Forecast by Drug Class, 2018 to 2033

Table 33: Oceania Market Value (US$ Million) Forecast by Route of Administration, 2018 to 2033

Table 34: Oceania Market Value (US$ Million) Forecast by Treatment , 2018 to 2033

Table 35: Oceania Market Value (US$ Million) Forecast by Distribution Channel, 2018 to 2033

Table 36: MEA Market Value (US$ Million) Forecast by Country, 2018 to 2033

Table 37: MEA Market Value (US$ Million) Forecast by Drug Class, 2018 to 2033

Table 38: MEA Market Value (US$ Million) Forecast by Route of Administration, 2018 to 2033

Table 39: MEA Market Value (US$ Million) Forecast by Treatment , 2018 to 2033

Table 40: MEA Market Value (US$ Million) Forecast by Distribution Channel, 2018 to 2033

List of Charts

Figure 1: Global Market Value (US$ Million) by Drug Class, 2023 to 2033

Figure 2: Global Market Value (US$ Million) by Route of Administration, 2023 to 2033

Figure 3: Global Market Value (US$ Million) by Treatment , 2023 to 2033

Figure 4: Global Market Value (US$ Million) by Distribution Channel, 2023 to 2033

Figure 5: Global Market Value (US$ Million) by Region, 2023 to 2033

Figure 6: Global Market Value (US$ Million) Analysis by Region, 2018 to 2033

Figure 7: Global Market Value Share (%) and BPS Analysis by Region, 2023 to 2033

Figure 8: Global Market Y-o-Y Growth (%) Projections by Region, 2023 to 2033

Figure 9: Global Market Value (US$ Million) Analysis by Drug Class, 2018 to 2033

Figure 10: Global Market Value Share (%) and BPS Analysis by Drug Class, 2023 to 2033

Figure 11: Global Market Y-o-Y Growth (%) Projections by Drug Class, 2023 to 2033

Figure 12: Global Market Value (US$ Million) Analysis by Route of Administration, 2018 to 2033

Figure 13: Global Market Value Share (%) and BPS Analysis by Route of Administration, 2023 to 2033

Figure 14: Global Market Y-o-Y Growth (%) Projections by Route of Administration, 2023 to 2033

Figure 15: Global Market Value (US$ Million) Analysis by Treatment , 2018 to 2033

Figure 16: Global Market Value Share (%) and BPS Analysis by Treatment , 2023 to 2033

Figure 17: Global Market Y-o-Y Growth (%) Projections by Treatment , 2023 to 2033

Figure 18: Global Market Value (US$ Million) Analysis by Distribution Channel, 2018 to 2033

Figure 19: Global Market Value Share (%) and BPS Analysis by Distribution Channel, 2023 to 2033

Figure 20: Global Market Y-o-Y Growth (%) Projections by Distribution Channel, 2023 to 2033

Figure 21: Global Market Attractiveness by Drug Class, 2023 to 2033

Figure 22: Global Market Attractiveness by Route of Administration, 2023 to 2033

Figure 23: Global Market Attractiveness by Treatment , 2023 to 2033

Figure 24: Global Market Attractiveness by Distribution Channel, 2023 to 2033

Figure 25: Global Market Attractiveness by Region, 2023 to 2033

Figure 26: North America Market Value (US$ Million) by Drug Class, 2023 to 2033

Figure 27: North America Market Value (US$ Million) by Route of Administration, 2023 to 2033

Figure 28: North America Market Value (US$ Million) by Treatment , 2023 to 2033

Figure 29: North America Market Value (US$ Million) by Distribution Channel, 2023 to 2033

Figure 30: North America Market Value (US$ Million) by Country, 2023 to 2033

Figure 31: North America Market Value (US$ Million) Analysis by Country, 2018 to 2033

Figure 32: North America Market Value Share (%) and BPS Analysis by Country, 2023 to 2033

Figure 33: North America Market Y-o-Y Growth (%) Projections by Country, 2023 to 2033

Figure 34: North America Market Value (US$ Million) Analysis by Drug Class, 2018 to 2033

Figure 35: North America Market Value Share (%) and BPS Analysis by Drug Class, 2023 to 2033

Figure 36: North America Market Y-o-Y Growth (%) Projections by Drug Class, 2023 to 2033

Figure 37: North America Market Value (US$ Million) Analysis by Route of Administration, 2018 to 2033

Figure 38: North America Market Value Share (%) and BPS Analysis by Route of Administration, 2023 to 2033

Figure 39: North America Market Y-o-Y Growth (%) Projections by Route of Administration, 2023 to 2033

Figure 40: North America Market Value (US$ Million) Analysis by Treatment , 2018 to 2033

Figure 41: North America Market Value Share (%) and BPS Analysis by Treatment , 2023 to 2033

Figure 42: North America Market Y-o-Y Growth (%) Projections by Treatment , 2023 to 2033

Figure 43: North America Market Value (US$ Million) Analysis by Distribution Channel, 2018 to 2033

Figure 44: North America Market Value Share (%) and BPS Analysis by Distribution Channel, 2023 to 2033

Figure 45: North America Market Y-o-Y Growth (%) Projections by Distribution Channel, 2023 to 2033

Figure 46: North America Market Attractiveness by Drug Class, 2023 to 2033

Figure 47: North America Market Attractiveness by Route of Administration, 2023 to 2033

Figure 48: North America Market Attractiveness by Treatment , 2023 to 2033

Figure 49: North America Market Attractiveness by Distribution Channel, 2023 to 2033

Figure 50: North America Market Attractiveness by Country, 2023 to 2033

Figure 51: Latin America Market Value (US$ Million) by Drug Class, 2023 to 2033

Figure 52: Latin America Market Value (US$ Million) by Route of Administration, 2023 to 2033

Figure 53: Latin America Market Value (US$ Million) by Treatment , 2023 to 2033

Figure 54: Latin America Market Value (US$ Million) by Distribution Channel, 2023 to 2033

Figure 55: Latin America Market Value (US$ Million) by Country, 2023 to 2033

Figure 56: Latin America Market Value (US$ Million) Analysis by Country, 2018 to 2033

Figure 57: Latin America Market Value Share (%) and BPS Analysis by Country, 2023 to 2033

Figure 58: Latin America Market Y-o-Y Growth (%) Projections by Country, 2023 to 2033

Figure 59: Latin America Market Value (US$ Million) Analysis by Drug Class, 2018 to 2033

Figure 60: Latin America Market Value Share (%) and BPS Analysis by Drug Class, 2023 to 2033

Figure 61: Latin America Market Y-o-Y Growth (%) Projections by Drug Class, 2023 to 2033

Figure 62: Latin America Market Value (US$ Million) Analysis by Route of Administration, 2018 to 2033

Figure 63: Latin America Market Value Share (%) and BPS Analysis by Route of Administration, 2023 to 2033

Figure 64: Latin America Market Y-o-Y Growth (%) Projections by Route of Administration, 2023 to 2033

Figure 65: Latin America Market Value (US$ Million) Analysis by Treatment , 2018 to 2033

Figure 66: Latin America Market Value Share (%) and BPS Analysis by Treatment , 2023 to 2033

Figure 67: Latin America Market Y-o-Y Growth (%) Projections by Treatment , 2023 to 2033

Figure 68: Latin America Market Value (US$ Million) Analysis by Distribution Channel, 2018 to 2033

Figure 69: Latin America Market Value Share (%) and BPS Analysis by Distribution Channel, 2023 to 2033

Figure 70: Latin America Market Y-o-Y Growth (%) Projections by Distribution Channel, 2023 to 2033

Figure 71: Latin America Market Attractiveness by Drug Class, 2023 to 2033

Figure 72: Latin America Market Attractiveness by Route of Administration, 2023 to 2033

Figure 73: Latin America Market Attractiveness by Treatment , 2023 to 2033

Figure 74: Latin America Market Attractiveness by Distribution Channel, 2023 to 2033

Figure 75: Latin America Market Attractiveness by Country, 2023 to 2033

Figure 76: Europe Market Value (US$ Million) by Drug Class, 2023 to 2033

Figure 77: Europe Market Value (US$ Million) by Route of Administration, 2023 to 2033

Figure 78: Europe Market Value (US$ Million) by Treatment , 2023 to 2033

Figure 79: Europe Market Value (US$ Million) by Distribution Channel, 2023 to 2033

Figure 80: Europe Market Value (US$ Million) by Country, 2023 to 2033

Figure 81: Europe Market Value (US$ Million) Analysis by Country, 2018 to 2033

Figure 82: Europe Market Value Share (%) and BPS Analysis by Country, 2023 to 2033

Figure 83: Europe Market Y-o-Y Growth (%) Projections by Country, 2023 to 2033

Figure 84: Europe Market Value (US$ Million) Analysis by Drug Class, 2018 to 2033

Figure 85: Europe Market Value Share (%) and BPS Analysis by Drug Class, 2023 to 2033

Figure 86: Europe Market Y-o-Y Growth (%) Projections by Drug Class, 2023 to 2033

Figure 87: Europe Market Value (US$ Million) Analysis by Route of Administration, 2018 to 2033

Figure 88: Europe Market Value Share (%) and BPS Analysis by Route of Administration, 2023 to 2033

Figure 89: Europe Market Y-o-Y Growth (%) Projections by Route of Administration, 2023 to 2033

Figure 90: Europe Market Value (US$ Million) Analysis by Treatment , 2018 to 2033

Figure 91: Europe Market Value Share (%) and BPS Analysis by Treatment , 2023 to 2033

Figure 92: Europe Market Y-o-Y Growth (%) Projections by Treatment , 2023 to 2033

Figure 93: Europe Market Value (US$ Million) Analysis by Distribution Channel, 2018 to 2033

Figure 94: Europe Market Value Share (%) and BPS Analysis by Distribution Channel, 2023 to 2033

Figure 95: Europe Market Y-o-Y Growth (%) Projections by Distribution Channel, 2023 to 2033

Figure 96: Europe Market Attractiveness by Drug Class, 2023 to 2033

Figure 97: Europe Market Attractiveness by Route of Administration, 2023 to 2033

Figure 98: Europe Market Attractiveness by Treatment , 2023 to 2033

Figure 99: Europe Market Attractiveness by Distribution Channel, 2023 to 2033

Figure 100: Europe Market Attractiveness by Country, 2023 to 2033

Figure 101: South Asia Market Value (US$ Million) by Drug Class, 2023 to 2033

Figure 102: South Asia Market Value (US$ Million) by Route of Administration, 2023 to 2033

Figure 103: South Asia Market Value (US$ Million) by Treatment , 2023 to 2033

Figure 104: South Asia Market Value (US$ Million) by Distribution Channel, 2023 to 2033

Figure 105: South Asia Market Value (US$ Million) by Country, 2023 to 2033

Figure 106: South Asia Market Value (US$ Million) Analysis by Country, 2018 to 2033

Figure 107: South Asia Market Value Share (%) and BPS Analysis by Country, 2023 to 2033

Figure 108: South Asia Market Y-o-Y Growth (%) Projections by Country, 2023 to 2033

Figure 109: South Asia Market Value (US$ Million) Analysis by Drug Class, 2018 to 2033

Figure 110: South Asia Market Value Share (%) and BPS Analysis by Drug Class, 2023 to 2033

Figure 111: South Asia Market Y-o-Y Growth (%) Projections by Drug Class, 2023 to 2033

Figure 112: South Asia Market Value (US$ Million) Analysis by Route of Administration, 2018 to 2033

Figure 113: South Asia Market Value Share (%) and BPS Analysis by Route of Administration, 2023 to 2033

Figure 114: South Asia Market Y-o-Y Growth (%) Projections by Route of Administration, 2023 to 2033

Figure 115: South Asia Market Value (US$ Million) Analysis by Treatment , 2018 to 2033

Figure 116: South Asia Market Value Share (%) and BPS Analysis by Treatment , 2023 to 2033

Figure 117: South Asia Market Y-o-Y Growth (%) Projections by Treatment , 2023 to 2033

Figure 118: South Asia Market Value (US$ Million) Analysis by Distribution Channel, 2018 to 2033

Figure 119: South Asia Market Value Share (%) and BPS Analysis by Distribution Channel, 2023 to 2033

Figure 120: South Asia Market Y-o-Y Growth (%) Projections by Distribution Channel, 2023 to 2033

Figure 121: South Asia Market Attractiveness by Drug Class, 2023 to 2033

Figure 122: South Asia Market Attractiveness by Route of Administration, 2023 to 2033

Figure 123: South Asia Market Attractiveness by Treatment , 2023 to 2033

Figure 124: South Asia Market Attractiveness by Distribution Channel, 2023 to 2033

Figure 125: South Asia Market Attractiveness by Country, 2023 to 2033

Figure 126: East Asia Market Value (US$ Million) by Drug Class, 2023 to 2033

Figure 127: East Asia Market Value (US$ Million) by Route of Administration, 2023 to 2033

Figure 128: East Asia Market Value (US$ Million) by Treatment , 2023 to 2033

Figure 129: East Asia Market Value (US$ Million) by Distribution Channel, 2023 to 2033

Figure 130: East Asia Market Value (US$ Million) by Country, 2023 to 2033

Figure 131: East Asia Market Value (US$ Million) Analysis by Country, 2018 to 2033

Figure 132: East Asia Market Value Share (%) and BPS Analysis by Country, 2023 to 2033

Figure 133: East Asia Market Y-o-Y Growth (%) Projections by Country, 2023 to 2033

Figure 134: East Asia Market Value (US$ Million) Analysis by Drug Class, 2018 to 2033

Figure 135: East Asia Market Value Share (%) and BPS Analysis by Drug Class, 2023 to 2033

Figure 136: East Asia Market Y-o-Y Growth (%) Projections by Drug Class, 2023 to 2033

Figure 137: East Asia Market Value (US$ Million) Analysis by Route of Administration, 2018 to 2033

Figure 138: East Asia Market Value Share (%) and BPS Analysis by Route of Administration, 2023 to 2033

Figure 139: East Asia Market Y-o-Y Growth (%) Projections by Route of Administration, 2023 to 2033

Figure 140: East Asia Market Value (US$ Million) Analysis by Treatment , 2018 to 2033

Figure 141: East Asia Market Value Share (%) and BPS Analysis by Treatment , 2023 to 2033

Figure 142: East Asia Market Y-o-Y Growth (%) Projections by Treatment , 2023 to 2033

Figure 143: East Asia Market Value (US$ Million) Analysis by Distribution Channel, 2018 to 2033

Figure 144: East Asia Market Value Share (%) and BPS Analysis by Distribution Channel, 2023 to 2033

Figure 145: East Asia Market Y-o-Y Growth (%) Projections by Distribution Channel, 2023 to 2033

Figure 146: East Asia Market Attractiveness by Drug Class, 2023 to 2033

Figure 147: East Asia Market Attractiveness by Route of Administration, 2023 to 2033

Figure 148: East Asia Market Attractiveness by Treatment , 2023 to 2033

Figure 149: East Asia Market Attractiveness by Distribution Channel, 2023 to 2033

Figure 150: East Asia Market Attractiveness by Country, 2023 to 2033

Figure 151: Oceania Market Value (US$ Million) by Drug Class, 2023 to 2033

Figure 152: Oceania Market Value (US$ Million) by Route of Administration, 2023 to 2033

Figure 153: Oceania Market Value (US$ Million) by Treatment , 2023 to 2033

Figure 154: Oceania Market Value (US$ Million) by Distribution Channel, 2023 to 2033

Figure 155: Oceania Market Value (US$ Million) by Country, 2023 to 2033

Figure 156: Oceania Market Value (US$ Million) Analysis by Country, 2018 to 2033

Figure 157: Oceania Market Value Share (%) and BPS Analysis by Country, 2023 to 2033

Figure 158: Oceania Market Y-o-Y Growth (%) Projections by Country, 2023 to 2033

Figure 159: Oceania Market Value (US$ Million) Analysis by Drug Class, 2018 to 2033

Figure 160: Oceania Market Value Share (%) and BPS Analysis by Drug Class, 2023 to 2033

Figure 161: Oceania Market Y-o-Y Growth (%) Projections by Drug Class, 2023 to 2033

Figure 162: Oceania Market Value (US$ Million) Analysis by Route of Administration, 2018 to 2033

Figure 163: Oceania Market Value Share (%) and BPS Analysis by Route of Administration, 2023 to 2033

Figure 164: Oceania Market Y-o-Y Growth (%) Projections by Route of Administration, 2023 to 2033

Figure 165: Oceania Market Value (US$ Million) Analysis by Treatment , 2018 to 2033

Figure 166: Oceania Market Value Share (%) and BPS Analysis by Treatment , 2023 to 2033

Figure 167: Oceania Market Y-o-Y Growth (%) Projections by Treatment , 2023 to 2033

Figure 168: Oceania Market Value (US$ Million) Analysis by Distribution Channel, 2018 to 2033

Figure 169: Oceania Market Value Share (%) and BPS Analysis by Distribution Channel, 2023 to 2033

Figure 170: Oceania Market Y-o-Y Growth (%) Projections by Distribution Channel, 2023 to 2033

Figure 171: Oceania Market Attractiveness by Drug Class, 2023 to 2033

Figure 172: Oceania Market Attractiveness by Route of Administration, 2023 to 2033

Figure 173: Oceania Market Attractiveness by Treatment , 2023 to 2033

Figure 174: Oceania Market Attractiveness by Distribution Channel, 2023 to 2033

Figure 175: Oceania Market Attractiveness by Country, 2023 to 2033

Figure 176: MEA Market Value (US$ Million) by Drug Class, 2023 to 2033

Figure 177: MEA Market Value (US$ Million) by Route of Administration, 2023 to 2033

Figure 178: MEA Market Value (US$ Million) by Treatment , 2023 to 2033

Figure 179: MEA Market Value (US$ Million) by Distribution Channel, 2023 to 2033

Figure 180: MEA Market Value (US$ Million) by Country, 2023 to 2033

Figure 181: MEA Market Value (US$ Million) Analysis by Country, 2018 to 2033

Figure 182: MEA Market Value Share (%) and BPS Analysis by Country, 2023 to 2033

Figure 183: MEA Market Y-o-Y Growth (%) Projections by Country, 2023 to 2033

Figure 184: MEA Market Value (US$ Million) Analysis by Drug Class, 2018 to 2033

Figure 185: MEA Market Value Share (%) and BPS Analysis by Drug Class, 2023 to 2033

Figure 186: MEA Market Y-o-Y Growth (%) Projections by Drug Class, 2023 to 2033

Figure 187: MEA Market Value (US$ Million) Analysis by Route of Administration, 2018 to 2033

Figure 188: MEA Market Value Share (%) and BPS Analysis by Route of Administration, 2023 to 2033

Figure 189: MEA Market Y-o-Y Growth (%) Projections by Route of Administration, 2023 to 2033

Figure 190: MEA Market Value (US$ Million) Analysis by Treatment , 2018 to 2033

Figure 191: MEA Market Value Share (%) and BPS Analysis by Treatment , 2023 to 2033

Figure 192: MEA Market Y-o-Y Growth (%) Projections by Treatment , 2023 to 2033

Figure 193: MEA Market Value (US$ Million) Analysis by Distribution Channel, 2018 to 2033

Figure 194: MEA Market Value Share (%) and BPS Analysis by Distribution Channel, 2023 to 2033

Figure 195: MEA Market Y-o-Y Growth (%) Projections by Distribution Channel, 2023 to 2033

Figure 196: MEA Market Attractiveness by Drug Class, 2023 to 2033

Figure 197: MEA Market Attractiveness by Route of Administration, 2023 to 2033

Figure 198: MEA Market Attractiveness by Treatment , 2023 to 2033

Figure 199: MEA Market Attractiveness by Distribution Channel, 2023 to 2033

Figure 200: MEA Market Attractiveness by Country, 2023 to 2033

Recommendations

Healthcare

Cold, Cough, and Sore Throat Remedy Market

Published : April 2024

Healthcare

Cluster Headache Syndrome Market

Published : July 2023

Healthcare

Strep Throat Treatment Market

Published : March 2023

Healthcare

Sinus Therapeutic Drugs Market

Published : August 2020

Explore Healthcare Insights

View Reports

Migraine Treatment Market