The grain roller market is estimated to be valued at USD 1723.5 million in 2025 and is projected to reach USD 2728.1 million by 2035, registering a compound annual growth rate (CAGR) of 4.7% over the forecast period.
The market demonstrates steady expansion driven by livestock feed processing demands, brewing industry requirements, and grain conditioning applications that necessitate precise particle size reduction while maintaining nutritional content and digestive efficiency characteristics. Feed manufacturing facilities implement roller mill systems that crack, crimp, and flatten grains to optimize animal digestion while preserving starch content and preventing excessive flour production that could affect feed quality and palatability. The technology's ability to process diverse grain types including corn, barley, oats, and wheat enables feed mills to accommodate varying raw material availability while maintaining consistent feed texture and nutritional density.
Commercial livestock operations represent the dominant consumption segment where grain rollers prepare feed ingredients that improve digestive efficiency and reduce feed conversion ratios across cattle, swine, and poultry production systems. Dairy farmers utilize grain rolling equipment to process corn and barley into optimal particle sizes that maximize rumen fermentation efficiency while preventing acidosis conditions that could compromise milk production. Beef feedlot operations specify roller systems capable of high-throughput processing while maintaining consistent crack patterns that optimize starch availability without creating excessive dust that affects animal health and feed handling characteristics.
Brewing industry applications create specialized market segments requiring grain rollers that crush malted barley to precise specifications that maximize enzyme exposure while preventing husk damage that could affect wort clarity and filtration efficiency. Craft breweries implement small-batch roller systems that provide flexibility for diverse grain bills and specialty malt processing while maintaining quality consistency across production batches. Commercial breweries utilize high-capacity roller mills with adjustable gap settings that accommodate different malt moisture contents and kernel sizes throughout seasonal supply variations.
Technology advancement trajectories concentrate on gap adjustment mechanisms and roll surface treatments that enable precise particle size control while extending roll life and reducing maintenance requirements. Hydraulic gap adjustment systems provide real-time control over crack spacing while maintaining consistent processing characteristics across varying grain moisture content and kernel hardness. Roll surface innovations including specialized grooves, textures, and hardening treatments optimize grain cracking patterns while resisting wear from abrasive materials and frequent use cycles.
Supply chain considerations emphasize equipment durability and parts availability as grain roller systems operate in dusty agricultural environments requiring frequent maintenance and component replacement to maintain processing efficiency and product quality. Roll manufacturers provide resurfacing services and replacement components that extend equipment life while maintaining processing precision necessary for consistent feed quality. Distribution networks prioritize technical support capabilities and rapid parts delivery that minimize downtime during critical harvest and processing periods when equipment availability directly impacts operational efficiency.
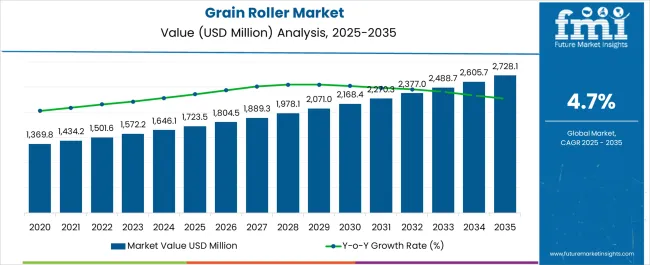
| Metric | Value |
|---|---|
| Grain Roller Market Estimated Value in (2025 E) | USD 1723.5 million |
| Grain Roller Market Forecast Value in (2035 F) | USD 2728.1 million |
| Forecast CAGR (2025 to 2035) | 4.7% |
The grain roller market is witnessing steady growth driven by increasing demand for efficient grain processing solutions in both commercial and agricultural sectors. Rising livestock populations and the need for high quality feed are prompting adoption of roller mills that ensure uniform particle size distribution and enhanced nutritional availability.
Advancements in automation and precision engineering are enabling manufacturers to develop high capacity roller mills that reduce energy consumption and maintenance costs. Additionally, growing awareness about the benefits of feed uniformity for animal health and productivity has reinforced market adoption.
Expansion of online sales platforms is further facilitating wider accessibility, particularly in regions with strong agricultural output. The market outlook remains positive as feed processing industries and farmers continue to prioritize efficiency, product consistency, and operational sustainability in grain processing.
The market is segmented by Type, Application, and Sales Channel and region. By Type, the market is divided into Single Pair Roller Mill, Double Pair Roller Mill, and Multi-Stage Roller Mill. In terms of Application, the market is classified into Feed Processing, Brewery & Distillery, and Flour Milling. Based on Sales Channel, the market is segmented into Online and Offline. Regionally, the market is classified into North America, Latin America, Western Europe, Eastern Europe, Balkan & Baltic Countries, Russia & Belarus, Central Asia, East Asia, South Asia & Pacific, and the Middle East & Africa.
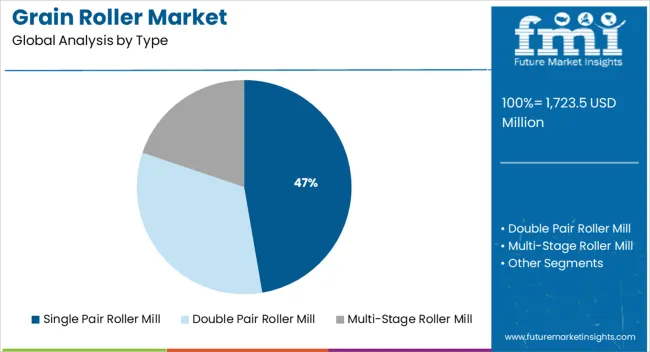
The single pair roller mill segment is expected to account for 47.30% of market revenue by 2025 within the type category, making it the most prominent sub segment. Its dominance is supported by its simplicity, lower cost, and suitability for small to medium scale feed processing operations.
The segment is preferred due to its ease of maintenance, energy efficiency, and ability to produce consistent granulation for livestock feed.
Increasing adoption in agricultural regions with strong demand for cost effective feed production has further reinforced the growth of this type segment.
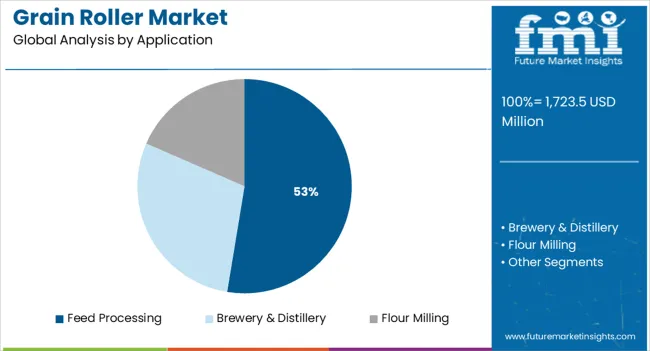
The feed processing application segment is projected to hold 52.60% of total market revenue by 2025, positioning it as the leading application area. This dominance is attributed to the rising importance of feed optimization in livestock nutrition and the growing emphasis on productivity in the animal husbandry sector.
Uniform particle size produced by roller mills improves feed digestibility, enhances animal health outcomes, and contributes to better weight gain efficiency.
Investments in modern feed mills and the need for high throughput solutions are further supporting adoption in this segment.
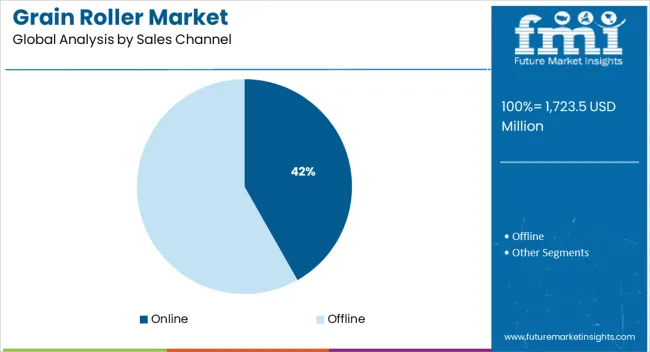
The online sales channel is estimated to represent 41.80% of market revenue by 2025, reflecting its strong presence in the overall sales channel category. Growth in this segment is driven by the increasing preference for digital purchasing platforms that offer greater accessibility, price transparency, and product variety.
Farmers and small businesses are leveraging online platforms to access advanced grain roller mills without geographical limitations. The shift toward e commerce is also being reinforced by competitive pricing strategies and after sales support offered by online distributors.
As digital adoption accelerates across agricultural supply chains, the online channel continues to emerge as a critical driver of sales in the grain roller market.
The global grain roller market reached a valuation of USD 1,501.6 million in 2025 from USD 1,259.9 million in 2020. As per Future Market Insights, the market exhibited moderate growth at a CAGR of 4.5% throughout the historical period from 2020 to 2025.
One of the prominent factors driving growth in the market is the increasing demand for grain-based food products. Surging health consciousness is also fueling the demand for grain-based food products as they are low in fat and cholesterol.
Changing lifestyles and eating habits of millennials are further contributing to the expansion of the global market. Other factors that are driving growth in the market include increasing disposable income and rapid urbanization. The rising population is also creating a high demand for grain-based food products.
A wide range of influential factors has been evaluated to stir the soup in the grain roller industry. Analysts at Future Market Insights have analyzed the restraining elements, lucrative opportunities, and upcoming threats that can pose a challenge to the progression of the market for grain rollers.
The drivers, restraints, opportunities, and threats identified are as follows:
DRIVERS
RESTRAINTS
OPPORTUNITIES
THREATS
Need to Enhance Production Methods in the United States to Spur Demand for Rice Mill Rollers
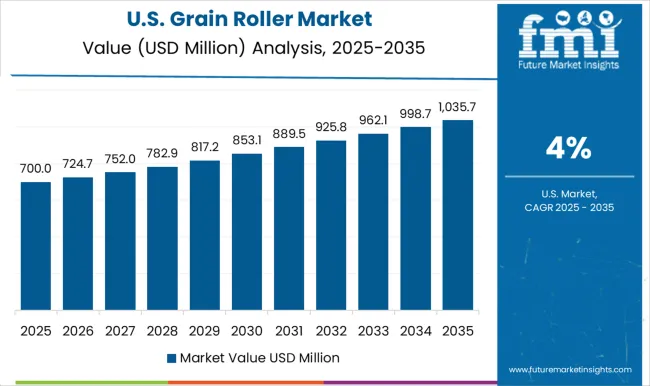
The United States grain roller market is developing at a rapid pace backed by high demand for efficient production methods, as well as grain products. Changing dietary habits and ever-increasing population in the country are a couple of other factors propelling grain roller demand in the next ten years. Increasing cost of inputs and need to improve productivity are also anticipated to boost the market. The United States grain roller industry is estimated to account for around 21.4% share in the forecast period.
Companies in the United Kingdom and Germany to Use Maize Roller Mills for Reducing Transportation Time
The market for grain rollers in Europe is developing at a steady pace. Demand for grain roller products is increasing due to rising awareness of numerous benefits of these products. These products are extensively used to reduce the time and cost of transportation, storage, and processing of grains.
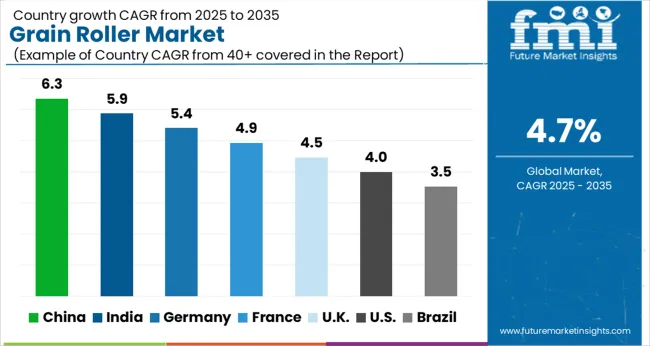
Use of grain roller products is also becoming popular in the United Kingdom and Germany food industry. There are several manufacturers of grain roller products in the aforementioned countries, and hence the competition among them is intense. Prices of grain roller products have declined due to tough competition. Germany is set to hold an estimated share of 22.1% in Europe, while CAGR in the United Kingdoms is projected to hit 6.7% over the projection period.
High Deposable Income in India and China to Boost Acquisition of Advanced Roller Mill for Wheat
In the past five years, the market for grain rollers has showcased steady growth in Asia Pacific. This growth is attributed to increasing demand for healthy food and changing lifestyle of millennials in this region.
The market for grain rollers is further expected to continue surging in Asia Pacific, as more people become aware of its benefits. Rising disposable income in China and India will allow more people to purchase grain roller products. India and China are market leaders in Asia Pacific, and their recent CAGRs in the industry are 6.5% and 6.7%, respectively. Japan contributes nearly 5.5% of the global market share.
Need to Enhance Animal Feed Quality to Push Sales of Grain Mill Rollers
Grain rollers are extensively used in the feed processing industry to grind grains into a powder form. This process is known as milling. Milled grains are further used to prepare various types of animal feeds. A grain roller is a simple and efficient machine that can be operated by an individual at a time.
Grain roller is commonly available in several models depending on the required capacity. These machines are made of stainless steel and they come with a certain warranty period. Grain rollers are also easy to operate and they do not require any special skills or training. The use of grain rollers in the feed processing industry has numerous benefits. They help in reducing the overall cost of animal feeds, improve the quality of feeds, and reduce labor requirements.
Escalating Demand for Craft Beer to Propel Need for DIY Grain Mill Rollers
Grain roller is considered to be one of the most important machines in the brewery and distillery industry. It is used to crush grains into small pieces so that they can be easily mixed with water and yeast. A grain roller is also used to remove husks from grains. This type of machine is very efficient and it can save a lot of time, as well as labor. High demand for craft beer is projected to drive grain roller sales across the globe.
Cost-effective Portable Grain Roller Mills to be Used for Flour Milling Activities Globally
The grain roller is set to be an important part of flour milling. It is used to crush grains so that they can be ground into flour. Rollers are usually made of metal and have a series of teeth or spikes on them. Grains are fed into the roller and are crushed between their teeth. The crushed grain is then collected and sent to the next stage of milling. Owing to their high convenience and cost-effective nature, grain roller demand is anticipated to accelerate in the next ten years.
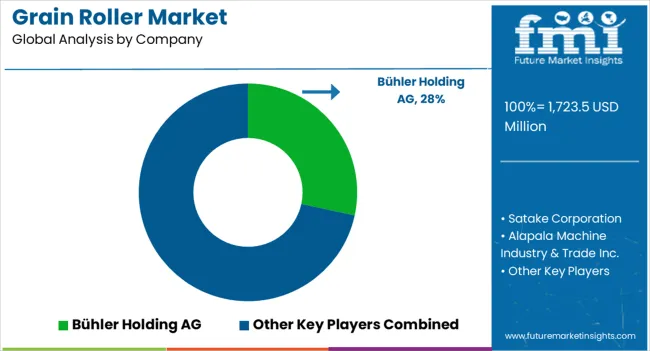
The grain roller market includes leading machinery and engineering manufacturers offering precision milling and processing equipment for grain handling, feed production, and food industries. Bühler Holding AG dominates with advanced roller mills designed for high-capacity grain grinding, uniform particle size, and consistent output quality. Its systems are widely used in flour milling and animal feed processing. Satake Corporation provides efficient grain roller systems engineered for rice, wheat, and maize, focusing on precision control and minimal grain loss during processing.
Alapala Machine Industry & Trade Inc. supplies modern roller mills and complete milling lines tailored for medium and large-scale grain processors. Its products combine robust construction with automated control for optimized throughput. Peterson Pacific Corporation manufactures heavy-duty roller equipment used in grain crushing and agricultural by-products processing, ensuring high mechanical efficiency and reliability. Komatsu Ltd. and Caterpillar Inc. contribute indirectly to the market by providing industrial rollers and mechanical systems supporting grain processing infrastructure. Wärtsilä Corporation offers mechanical and drive solutions that enhance the operational efficiency of roller systems used in large-scale grain milling facilities.
| Attribute | Details |
|---|---|
| Estimated Market Size (2025) | USD 1723.5 million |
| Projected Market Valuation (2035) | USD 2728.1 million |
| Value-based CAGR (2025 to 2035) | 4.7% |
| Forecast Period | 2025 to 2035 |
| Historical Data Available for | 2020 to 2025 |
| Market Analysis | Value (USD million) |
| Key Regions Covered | North America; Latin America; Europe; East Asia; South Asia; Oceania; Middle East & Africa (MEA) |
| Key Countries Covered | USA, Canada, Mexico, Germany, United Kingdom, France, Russia, Brazil, Argentina, Japan, Australia, China, India, Indonesia, South Korea |
| Key Segments Covered | Type, Application, Sales Channel, Region |
| Key Companies Profiled |
Bühler Holding AG, Satake Corporation, Alapala Machine Industry & Trade Inc., Peterson Pacific Corporation, Komatsu Ltd., Wärtsilä Corporation, and Caterpillar Inc. |
| Report Coverage | Strategic Growth Initiatives, Drivers, Restraints, Opportunities and Threats Analysis, Market Forecast, Company Share Analysis, Market Dynamics and Challenges, and Competitive Landscape. |
The global grain roller market is estimated to be valued at USD 1,723.5 million in 2025.
The market size for the grain roller market is projected to reach USD 2,728.1 million by 2035.
The grain roller market is expected to grow at a 4.7% CAGR between 2025 and 2035.
The key product types in grain roller market are single pair roller mill, double pair roller mill and multi-stage roller mill.
In terms of application, feed processing segment to command 52.6% share in the grain roller market in 2025.


Full Research Suite comprises of:
Market outlook & trends analysis
Interviews & case studies
Strategic recommendations
Vendor profiles & capabilities analysis
5-year forecasts
8 regions and 60+ country-level data splits
Market segment data splits
12 months of continuous data updates
DELIVERED AS:
PDF EXCEL ONLINE
Grain Hardness Meter Market Size and Share Forecast Outlook 2025 to 2035
Grain Cooling Spear Market Size and Share Forecast Outlook 2025 to 2035
Grain Mill Grinder Market Size and Share Forecast Outlook 2025 to 2035
Grain Alcohol Market Size and Share Forecast Outlook 2025 to 2035
Grain-Free Pet Food Market Trends - Growth & Industry Forecast 2024 to 2034
Grain And Seed Cleaning Equipment Market
Migraine Treatment Market Insights by Drug Class, Route of Administration, Distribution Channel, Treatment, and Region through 2035
Migraine Nasal Spray Market Outlook – Trends, Growth & Forecast 2025 to 2035
Feed Grain Market Analysis - Size, Share, and Forecast Outlook 2025 to 2035
Multigrain Premix Market Trends – Healthy Baking & Industry Expansion 2025 to 2035
Horse Grain Feeders Market Size and Share Forecast Outlook 2025 to 2035
Whole Grain & High Fiber Foods Market Growth – Demand, Trends & Forecast 2025–2035
Whole Grain Salty Snacks Market Analysis by Product Type, Product Claim, Source, Distribution Channel and Region Through 2035
Multi-Grain Premixes Market
Acute Migraine Treatment Market Trends – Analysis & Forecast 2024-2034
United Kingdom Whole Grain and High Fiber Foods Market Report – Trends & Forecast 2025–2035
United States Whole Grain and High Fiber Foods Market Report – Trends & Forecast 2025–2035
Commercial Grain Mill Market Size and Share Forecast Outlook 2025 to 2035
Dried Spent Grain Market Trends – Growth & Industry Forecast 2025 to 2035
Europe Whole Grain and High Fiber Foods Market Insights – Size & Forecast 2025–2035

Thank you!
You will receive an email from our Business Development Manager. Please be sure to check your SPAM/JUNK folder too.
Chat With
MaRIA