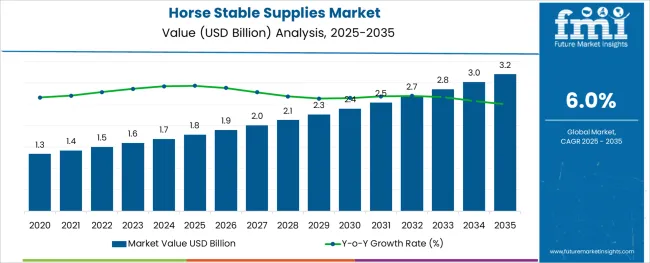
The global Horse Stable Supplies Market size is estimated to be valued at USD 1.5 Billion in 2022 and is projected to reach USD 2.7 Billion by 2032. The market is anticipated to exhibit growth at a CAGR of 6.0% from 2022 to 2032. Current share of horse stable supplies in the pet care market is approximately ~0.5%-1%.
Attributes | Key Statistics |
---|---|
Global Horse Stable Supplies Market Estimated Size (2022) | USD 1.5 Billion |
Projected Market Valuation (2032) | USD 2.7 Billion |
Value-based CAGR (2022 to 2032) | 6.0% |
Collective Value Share: Top Players | ~1%-5% |
The global horse stable supplies market is expected to grow at a steady pace in the next decade on the back of increasing awareness about the availability of various products amongst horse owners.
It is further set to encourage owners to pay close attention to the needs of their pet horse, which would create surging demand for horse stable supplies in the market.
Top 2 Trends Fueling Growth in the Global Horse Stable Supplies Market
Awareness about Equestrian Products
Ongoing trend of pet humanization and increasing awareness among customers regarding equestrian products are anticipated to spur growth in the market. Increasing horse adoption is also set to have a positive impact on the market.
Availability of a large number of products in numerous platforms, including brick-and-mortar stores and online channels is anticipated to attract more customers. Brands would be able to create new advertisements for social media platforms to expand their presence.
Participation in Equestrian Sports
Rising participation in equestrian sports is set to surge the number of people adopting horses in low- and middle-income countries. High disposable income in these countries would also create new growth opportunities for key players in the upcoming decade. Surging demand for premium product across the globe owing to their ability to provide the required level of usefulness is another factor that would aid growth.
Rise of Equestrian Sports in China to Push Demand for Horse Stall Supplies
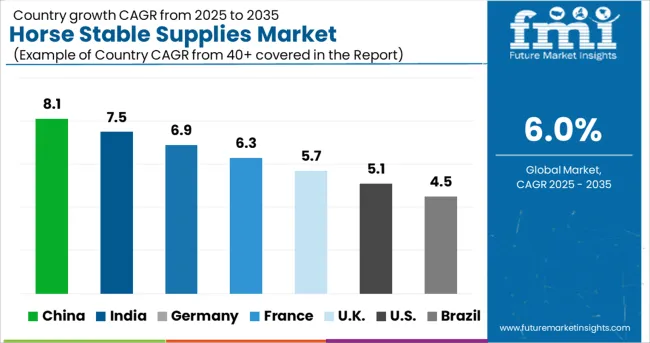
The China horse stable supplies market is expected to showcase a healthy CAGR of 6% during the forecast period, says FMI. Growth is attributed to the rise of equestrian sports in the country. Entry of various new players in China is another vital factor that would create growth opportunities in the country.
Rising Number of Horse Owners to Drive Sales of Horse Stable Materials
The USA has been one of the leading revenue-generating countries in the North America horse stable supplies market. Increasing number of both private and commercial horse owners in the USA is likely to drive growth in the market.
As per FMI, the USA horse stable supplies market is expected to grow at a CAGR of 3% in the forecast period from 2022 to 2032. Development of unique products associated with cleanliness and safety is another factor that would propel growth in the USA market.
Increasing Number of Private Customers to Boost Demand for Equine Barn Supplies
Historically, horse racing has been one of the most popular sports in the UK It has led the country to become one of the major markets with high demand for products related to horse stables.
As per FMI, the UK horse stable supplies market is projected to grow at a CAGR of 2% in the evaluation period. Recreational horse riding and increasing horse adoption among private customers are anticipated to provide manufacturers with an opportunity to target the UK market in the forecast period.
Barn and Stable Supplies like Disinfectants and Deodorizers to Gain Impetus
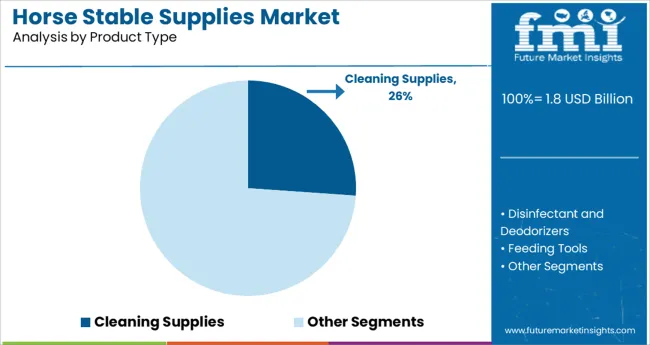
By product type, the disinfectants and deodorizers category is likely to lead the horse stable supplies market owing to increasing concerns associated with cleanliness-related health issues.
Owners are also striving to provide a safe horse stable environment to protect their horses from various diseases. The disinfectants and deodorizers segment is expected to generate nearly 21.1% of the global horse stable supplies market share in the upcoming decade, finds FMI.
Private Customers to Adopt High-quality Equestrian Stable Equipment
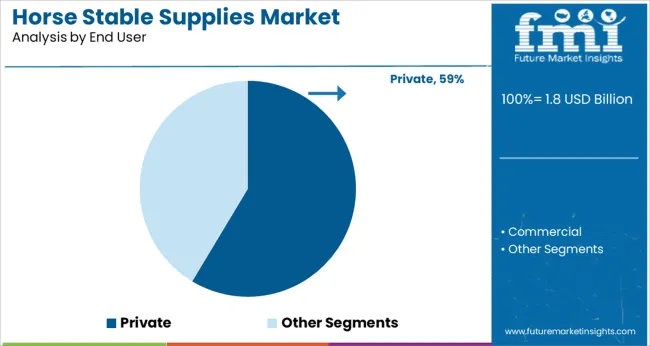
Based on end user, the private segment is projected to dominate the horse stable supplies market on the back of rising adoption of horses by high-net-worth individuals for participating in various recreational activities. Thus, key players are anticipated to come up with high-quality products for horses to generate more shares.
Humanization of Pets to Augment Demand for Premium Equine Barn Supplies
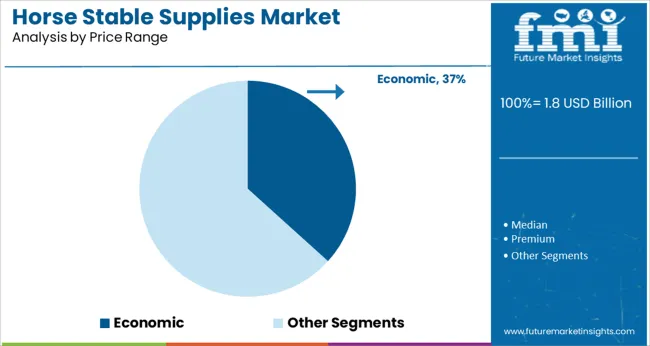
Increasing adoption of horses with growing trend of pet humanization is expected to drive the premium segment in the forthcoming years. Customers nowadays pay extra amount for premium products as long as they promise to provide them with the best experience possible.
Customers to Buy Equestrian Stable Accessories from Specialty Stores
By sales channel, the specialty stores segment is projected to remain at the forefront in the horse stable supplies market. Growth is attributable to rising consumer preference for purchasing required supplies at a trusted place as some of the products are big-ticket purchases.
Also, high demand for personalized products is anticipated to drive the segment. However, sales of horse stable supplies through direct and online sales channels are likely to grow in the assessment period with changing customer preferences.
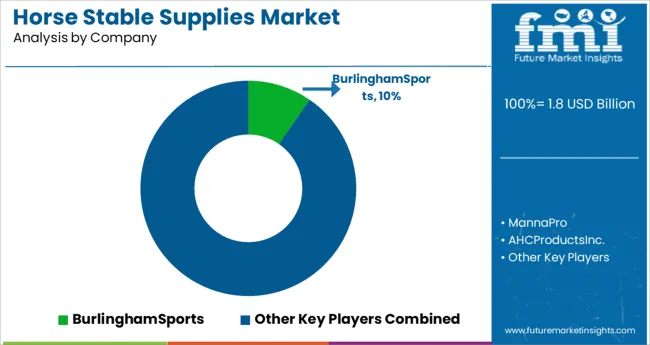
Key players in the global horse stable suppliers market have started focusing on delivering luxury products to clients owing to increasing number of high-net-worth customers across the globe.
A few other companies are engaging in collaborations with graphic designers to create attractive packaging of various products required in the stable to gain a large consumer base.
For instance,
Attribute | Details |
---|---|
Estimated Market Size (2022) | USD 1.5 Billion |
Projected Market Valuation (2032) | USD 2.7 Billion |
Value-based CAGR (2022 to 2032) | 6.0% |
Forecast Period | 2022 to 2032 |
Historical Data Available for | 2017 to 2021 |
Market Analysis | Value (USD Billion) |
Key Regions Covered | North America; Latin America; Europe; East Asia; South Asia; Oceania; and MEA. |
Key Countries Covered | United States, Canada, Brazil, Mexico, Germany, UK, France, Spain, Italy, Russia, Benelux, South Africa, Northern Africa, GCC Countries, China, Japan, South Korea, India, Thailand, Malaysia, Indonesia, Australia, and New Zealand. |
Key Segments Covered | Product Type, End User, Price Range, Sales Channels, and Region |
Key Companies Profiled | Burlingham Sports; Manna Pro; AHC Products. Inc.; Saratoga Horseworks, Ltd.; Kensington Protective; Little Giant; TuffRider; HorZe; Mountain Horse; Partrade; Tough-1; Farnam Companies, Inc.; Martin Saddlery; Gatsby Ltd.; K&H Pet; Farm Innovators Co.; Back On Track |
Report Coverage | Market Forecast, Company Share Analysis, Competition Intelligence, DROT Analysis, Market Dynamics and Challenges, and Strategic Growth Initiatives |
Table 1: Global Horse Stable Supplies Market Value (US$ Bn) Forecast by Region, 2017-2032
Table 2: Global Horse Stable Supplies Market Volume (Bn Units) Forecast by Region, 2017-2032
Table 3: Global Horse Stable Supplies Market Value (US$ Bn) Forecast by Product Type, 2017-2032
Table 4: Global Horse Stable Supplies Market Volume (Bn Units) Forecast by Product Type, 2017-2032
Table 5: Global Horse Stable Supplies Market Value (US$ Bn) Forecast by End-User, 2017-2032
Table 6: Global Horse Stable Supplies Market Volume (Bn Units) Forecast by End-User, 2017-2032
Table 7: Global Horse Stable Supplies Market Value (US$ Bn) Forecast by Price Range, 2017-2032
Table 8: Global Horse Stable Supplies Market Volume (Bn Units) Forecast by Price Range, 2017-2032
Table 9: Global Horse Stable Supplies Market Value (US$ Bn) Forecast by Sales Channel, 2017-2032
Table 10: Global Horse Stable Supplies Market Volume (Bn Units) Forecast by Sales Channel, 2017-2032
Table 11: North America Horse Stable Supplies Market Value (US$ Bn) Forecast by Country, 2017-2032
Table 12: North America Horse Stable Supplies Market Volume (Bn Units) Forecast by Country, 2017-2032
Table 13: North America Horse Stable Supplies Market Value (US$ Bn) Forecast by Product Type, 2017-2032
Table 14: North America Horse Stable Supplies Market Volume (Bn Units) Forecast by Product Type, 2017-2032
Table 15: North America Horse Stable Supplies Market Value (US$ Bn) Forecast by End-User, 2017-2032
Table 16: North America Horse Stable Supplies Market Volume (Bn Units) Forecast by End-User, 2017-2032
Table 17: North America Horse Stable Supplies Market Value (US$ Bn) Forecast by Price Range, 2017-2032
Table 18: North America Horse Stable Supplies Market Volume (Bn Units) Forecast by Price Range, 2017-2032
Table 19: North America Horse Stable Supplies Market Value (US$ Bn) Forecast by Sales Channel, 2017-2032
Table 20: North America Horse Stable Supplies Market Volume (Bn Units) Forecast by Sales Channel, 2017-2032
Table 21: Latin America Horse Stable Supplies Market Value (US$ Bn) Forecast by Country, 2017-2032
Table 22: Latin America Horse Stable Supplies Market Volume (Bn Units) Forecast by Country, 2017-2032
Table 23: Latin America Horse Stable Supplies Market Value (US$ Bn) Forecast by Product Type, 2017-2032
Table 24: Latin America Horse Stable Supplies Market Volume (Bn Units) Forecast by Product Type, 2017-2032
Table 25: Latin America Horse Stable Supplies Market Value (US$ Bn) Forecast by End-User, 2017-2032
Table 26: Latin America Horse Stable Supplies Market Volume (Bn Units) Forecast by End-User, 2017-2032
Table 27: Latin America Horse Stable Supplies Market Value (US$ Bn) Forecast by Price Range, 2017-2032
Table 28: Latin America Horse Stable Supplies Market Volume (Bn Units) Forecast by Price Range, 2017-2032
Table 29: Latin America Horse Stable Supplies Market Value (US$ Bn) Forecast by Sales Channel, 2017-2032
Table 30: Latin America Horse Stable Supplies Market Volume (Bn Units) Forecast by Sales Channel, 2017-2032
Table 31: Europe Horse Stable Supplies Market Value (US$ Bn) Forecast by Country, 2017-2032
Table 32: Europe Horse Stable Supplies Market Volume (Bn Units) Forecast by Country, 2017-2032
Table 33: Europe Horse Stable Supplies Market Value (US$ Bn) Forecast by Product Type, 2017-2032
Table 34: Europe Horse Stable Supplies Market Volume (Bn Units) Forecast by Product Type, 2017-2032
Table 35: Europe Horse Stable Supplies Market Value (US$ Bn) Forecast by End-User, 2017-2032
Table 36: Europe Horse Stable Supplies Market Volume (Bn Units) Forecast by End-User, 2017-2032
Table 37: Europe Horse Stable Supplies Market Value (US$ Bn) Forecast by Price Range, 2017-2032
Table 38: Europe Horse Stable Supplies Market Volume (Bn Units) Forecast by Price Range, 2017-2032
Table 39: Europe Horse Stable Supplies Market Value (US$ Bn) Forecast by Sales Channel, 2017-2032
Table 40: Europe Horse Stable Supplies Market Volume (Bn Units) Forecast by Sales Channel, 2017-2032
Table 41: East Asia Horse Stable Supplies Market Value (US$ Bn) Forecast by Country, 2017-2032
Table 42: East Asia Horse Stable Supplies Market Volume (Bn Units) Forecast by Country, 2017-2032
Table 43: East Asia Horse Stable Supplies Market Value (US$ Bn) Forecast by Product Type, 2017-2032
Table 44: East Asia Horse Stable Supplies Market Volume (Bn Units) Forecast by Product Type, 2017-2032
Table 45: East Asia Horse Stable Supplies Market Value (US$ Bn) Forecast by End-User, 2017-2032
Table 46: East Asia Horse Stable Supplies Market Volume (Bn Units) Forecast by End-User, 2017-2032
Table 47: East Asia Horse Stable Supplies Market Value (US$ Bn) Forecast by Price Range, 2017-2032
Table 48: East Asia Horse Stable Supplies Market Volume (Bn Units) Forecast by Price Range, 2017-2032
Table 49: East Asia Horse Stable Supplies Market Value (US$ Bn) Forecast by Sales Channel, 2017-2032
Table 50: East Asia Horse Stable Supplies Market Volume (Bn Units) Forecast by Sales Channel, 2017-2032
Table 51: South Asia Horse Stable Supplies Market Value (US$ Bn) Forecast by Country, 2017-2032
Table 52: South Asia Horse Stable Supplies Market Volume (Bn Units) Forecast by Country, 2017-2032
Table 53: South Asia Horse Stable Supplies Market Value (US$ Bn) Forecast by Product Type, 2017-2032
Table 54: South Asia Horse Stable Supplies Market Volume (Bn Units) Forecast by Product Type, 2017-2032
Table 55: South Asia Horse Stable Supplies Market Value (US$ Bn) Forecast by End-User, 2017-2032
Table 56: South Asia Horse Stable Supplies Market Volume (Bn Units) Forecast by End-User, 2017-2032
Table 57: South Asia Horse Stable Supplies Market Value (US$ Bn) Forecast by Price Range, 2017-2032
Table 58: South Asia Horse Stable Supplies Market Volume (Bn Units) Forecast by Price Range, 2017-2032
Table 59: South Asia Horse Stable Supplies Market Value (US$ Bn) Forecast by Sales Channel, 2017-2032
Table 60: South Asia Horse Stable Supplies Market Volume (Bn Units) Forecast by Sales Channel, 2017-2032
Table 61: Oceania Horse Stable Supplies Market Value (US$ Bn) Forecast by Country, 2017-2032
Table 62: Oceania Horse Stable Supplies Market Volume (Bn Units) Forecast by Country, 2017-2032
Table 63: Oceania Horse Stable Supplies Market Value (US$ Bn) Forecast by Product Type, 2017-2032
Table 64: Oceania Horse Stable Supplies Market Volume (Bn Units) Forecast by Product Type, 2017-2032
Table 65: Oceania Horse Stable Supplies Market Value (US$ Bn) Forecast by End-User, 2017-2032
Table 66: Oceania Horse Stable Supplies Market Volume (Bn Units) Forecast by End-User, 2017-2032
Table 67: Oceania Horse Stable Supplies Market Value (US$ Bn) Forecast by Price Range, 2017-2032
Table 68: Oceania Horse Stable Supplies Market Volume (Bn Units) Forecast by Price Range, 2017-2032
Table 69: Oceania Horse Stable Supplies Market Value (US$ Bn) Forecast by Sales Channel, 2017-2032
Table 70: Oceania Horse Stable Supplies Market Volume (Bn Units) Forecast by Sales Channel, 2017-2032
Table 71: MEA Horse Stable Supplies Market Value (US$ Bn) Forecast by Country, 2017-2032
Table 72: MEA Horse Stable Supplies Market Volume (Bn Units) Forecast by Country, 2017-2032
Table 73: MEA Horse Stable Supplies Market Value (US$ Bn) Forecast by Product Type, 2017-2032
Table 74: MEA Horse Stable Supplies Market Volume (Bn Units) Forecast by Product Type, 2017-2032
Table 75: MEA Horse Stable Supplies Market Value (US$ Bn) Forecast by End-User, 2017-2032
Table 76: MEA Horse Stable Supplies Market Volume (Bn Units) Forecast by End-User, 2017-2032
Table 77: MEA Horse Stable Supplies Market Value (US$ Bn) Forecast by Price Range, 2017-2032
Table 78: MEA Horse Stable Supplies Market Volume (Bn Units) Forecast by Price Range, 2017-2032
Table 79: MEA Horse Stable Supplies Market Value (US$ Bn) Forecast by Sales Channel, 2017-2032
Table 80: MEA Horse Stable Supplies Market Volume (Bn Units) Forecast by Sales Channel, 2017-2032
Figure 1: Global Horse Stable Supplies Market Value (US$ Bn) by Product Type, 2022-2032
Figure 2: Global Horse Stable Supplies Market Value (US$ Bn) by End-User, 2022-2032
Figure 3: Global Horse Stable Supplies Market Value (US$ Bn) by Price Range, 2022-2032
Figure 4: Global Horse Stable Supplies Market Value (US$ Bn) by Sales Channel, 2022-2032
Figure 5: Global Horse Stable Supplies Market Value (US$ Bn) by Region, 2022-2032
Figure 6: Global Horse Stable Supplies Market Value (US$ Bn) Analysis by Region, 2017-2032
Figure 7: Global Horse Stable Supplies Market Volume (Bn Units) Analysis by Region, 2017-2032
Figure 8: Global Horse Stable Supplies Market Value Share (%) and BPS Analysis by Region, 2022-2032
Figure 9: Global Horse Stable Supplies Market Y-o-Y Growth (%) Projections by Region, 2022-2032
Figure 10: Global Horse Stable Supplies Market Value (US$ Bn) Analysis by Product Type, 2017-2032
Figure 11: Global Horse Stable Supplies Market Volume (Bn Units) Analysis by Product Type, 2017-2032
Figure 12: Global Horse Stable Supplies Market Value Share (%) and BPS Analysis by Product Type, 2022-2032
Figure 13: Global Horse Stable Supplies Market Y-o-Y Growth (%) Projections by Product Type, 2022-2032
Figure 14: Global Horse Stable Supplies Market Value (US$ Bn) Analysis by End-User, 2017-2032
Figure 15: Global Horse Stable Supplies Market Volume (Bn Units) Analysis by End-User, 2017-2032
Figure 16: Global Horse Stable Supplies Market Value Share (%) and BPS Analysis by End-User, 2022-2032
Figure 17: Global Horse Stable Supplies Market Y-o-Y Growth (%) Projections by End-User, 2022-2032
Figure 18: Global Horse Stable Supplies Market Value (US$ Bn) Analysis by Price Range, 2017-2032
Figure 19: Global Horse Stable Supplies Market Volume (Bn Units) Analysis by Price Range, 2017-2032
Figure 20: Global Horse Stable Supplies Market Value Share (%) and BPS Analysis by Price Range, 2022-2032
Figure 21: Global Horse Stable Supplies Market Y-o-Y Growth (%) Projections by Price Range, 2022-2032
Figure 22: Global Horse Stable Supplies Market Value (US$ Bn) Analysis by Sales Channel, 2017-2032
Figure 23: Global Horse Stable Supplies Market Volume (Bn Units) Analysis by Sales Channel, 2017-2032
Figure 24: Global Horse Stable Supplies Market Value Share (%) and BPS Analysis by Sales Channel, 2022-2032
Figure 25: Global Horse Stable Supplies Market Y-o-Y Growth (%) Projections by Sales Channel, 2022-2032
Figure 26: Global Horse Stable Supplies Market Attractiveness by Product Type, 2022-2032
Figure 27: Global Horse Stable Supplies Market Attractiveness by End-User, 2022-2032
Figure 28: Global Horse Stable Supplies Market Attractiveness by Price Range, 2022-2032
Figure 29: Global Horse Stable Supplies Market Attractiveness by Sales Channel, 2022-2032
Figure 30: Global Horse Stable Supplies Market Attractiveness by Region, 2022-2032
Figure 31: North America Horse Stable Supplies Market Value (US$ Bn) by Product Type, 2022-2032
Figure 32: North America Horse Stable Supplies Market Value (US$ Bn) by End-User, 2022-2032
Figure 33: North America Horse Stable Supplies Market Value (US$ Bn) by Price Range, 2022-2032
Figure 34: North America Horse Stable Supplies Market Value (US$ Bn) by Sales Channel, 2022-2032
Figure 35: North America Horse Stable Supplies Market Value (US$ Bn) by Country, 2022-2032
Figure 36: North America Horse Stable Supplies Market Value (US$ Bn) Analysis by Country, 2017-2032
Figure 37: North America Horse Stable Supplies Market Volume (Bn Units) Analysis by Country, 2017-2032
Figure 38: North America Horse Stable Supplies Market Value Share (%) and BPS Analysis by Country, 2022-2032
Figure 39: North America Horse Stable Supplies Market Y-o-Y Growth (%) Projections by Country, 2022-2032
Figure 40: North America Horse Stable Supplies Market Value (US$ Bn) Analysis by Product Type, 2017-2032
Figure 41: North America Horse Stable Supplies Market Volume (Bn Units) Analysis by Product Type, 2017-2032
Figure 42: North America Horse Stable Supplies Market Value Share (%) and BPS Analysis by Product Type, 2022-2032
Figure 43: North America Horse Stable Supplies Market Y-o-Y Growth (%) Projections by Product Type, 2022-2032
Figure 44: North America Horse Stable Supplies Market Value (US$ Bn) Analysis by End-User, 2017-2032
Figure 45: North America Horse Stable Supplies Market Volume (Bn Units) Analysis by End-User, 2017-2032
Figure 46: North America Horse Stable Supplies Market Value Share (%) and BPS Analysis by End-User, 2022-2032
Figure 47: North America Horse Stable Supplies Market Y-o-Y Growth (%) Projections by End-User, 2022-2032
Figure 48: North America Horse Stable Supplies Market Value (US$ Bn) Analysis by Price Range, 2017-2032
Figure 49: North America Horse Stable Supplies Market Volume (Bn Units) Analysis by Price Range, 2017-2032
Figure 50: North America Horse Stable Supplies Market Value Share (%) and BPS Analysis by Price Range, 2022-2032
Figure 51: North America Horse Stable Supplies Market Y-o-Y Growth (%) Projections by Price Range, 2022-2032
Figure 52: North America Horse Stable Supplies Market Value (US$ Bn) Analysis by Sales Channel, 2017-2032
Figure 53: North America Horse Stable Supplies Market Volume (Bn Units) Analysis by Sales Channel, 2017-2032
Figure 54: North America Horse Stable Supplies Market Value Share (%) and BPS Analysis by Sales Channel, 2022-2032
Figure 55: North America Horse Stable Supplies Market Y-o-Y Growth (%) Projections by Sales Channel, 2022-2032
Figure 56: North America Horse Stable Supplies Market Attractiveness by Product Type, 2022-2032
Figure 57: North America Horse Stable Supplies Market Attractiveness by End-User, 2022-2032
Figure 58: North America Horse Stable Supplies Market Attractiveness by Price Range, 2022-2032
Figure 59: North America Horse Stable Supplies Market Attractiveness by Sales Channel, 2022-2032
Figure 60: North America Horse Stable Supplies Market Attractiveness by Country, 2022-2032
Figure 61: Latin America Horse Stable Supplies Market Value (US$ Bn) by Product Type, 2022-2032
Figure 62: Latin America Horse Stable Supplies Market Value (US$ Bn) by End-User, 2022-2032
Figure 63: Latin America Horse Stable Supplies Market Value (US$ Bn) by Price Range, 2022-2032
Figure 64: Latin America Horse Stable Supplies Market Value (US$ Bn) by Sales Channel, 2022-2032
Figure 65: Latin America Horse Stable Supplies Market Value (US$ Bn) by Country, 2022-2032
Figure 66: Latin America Horse Stable Supplies Market Value (US$ Bn) Analysis by Country, 2017-2032
Figure 67: Latin America Horse Stable Supplies Market Volume (Bn Units) Analysis by Country, 2017-2032
Figure 68: Latin America Horse Stable Supplies Market Value Share (%) and BPS Analysis by Country, 2022-2032
Figure 69: Latin America Horse Stable Supplies Market Y-o-Y Growth (%) Projections by Country, 2022-2032
Figure 70: Latin America Horse Stable Supplies Market Value (US$ Bn) Analysis by Product Type, 2017-2032
Figure 71: Latin America Horse Stable Supplies Market Volume (Bn Units) Analysis by Product Type, 2017-2032
Figure 72: Latin America Horse Stable Supplies Market Value Share (%) and BPS Analysis by Product Type, 2022-2032
Figure 73: Latin America Horse Stable Supplies Market Y-o-Y Growth (%) Projections by Product Type, 2022-2032
Figure 74: Latin America Horse Stable Supplies Market Value (US$ Bn) Analysis by End-User, 2017-2032
Figure 75: Latin America Horse Stable Supplies Market Volume (Bn Units) Analysis by End-User, 2017-2032
Figure 76: Latin America Horse Stable Supplies Market Value Share (%) and BPS Analysis by End-User, 2022-2032
Figure 77: Latin America Horse Stable Supplies Market Y-o-Y Growth (%) Projections by End-User, 2022-2032
Figure 78: Latin America Horse Stable Supplies Market Value (US$ Bn) Analysis by Price Range, 2017-2032
Figure 79: Latin America Horse Stable Supplies Market Volume (Bn Units) Analysis by Price Range, 2017-2032
Figure 80: Latin America Horse Stable Supplies Market Value Share (%) and BPS Analysis by Price Range, 2022-2032
Figure 81: Latin America Horse Stable Supplies Market Y-o-Y Growth (%) Projections by Price Range, 2022-2032
Figure 82: Latin America Horse Stable Supplies Market Value (US$ Bn) Analysis by Sales Channel, 2017-2032
Figure 83: Latin America Horse Stable Supplies Market Volume (Bn Units) Analysis by Sales Channel, 2017-2032
Figure 84: Latin America Horse Stable Supplies Market Value Share (%) and BPS Analysis by Sales Channel, 2022-2032
Figure 85: Latin America Horse Stable Supplies Market Y-o-Y Growth (%) Projections by Sales Channel, 2022-2032
Figure 86: Latin America Horse Stable Supplies Market Attractiveness by Product Type, 2022-2032
Figure 87: Latin America Horse Stable Supplies Market Attractiveness by End-User, 2022-2032
Figure 88: Latin America Horse Stable Supplies Market Attractiveness by Price Range, 2022-2032
Figure 89: Latin America Horse Stable Supplies Market Attractiveness by Sales Channel, 2022-2032
Figure 90: Latin America Horse Stable Supplies Market Attractiveness by Country, 2022-2032
Figure 91: Europe Horse Stable Supplies Market Value (US$ Bn) by Product Type, 2022-2032
Figure 92: Europe Horse Stable Supplies Market Value (US$ Bn) by End-User, 2022-2032
Figure 93: Europe Horse Stable Supplies Market Value (US$ Bn) by Price Range, 2022-2032
Figure 94: Europe Horse Stable Supplies Market Value (US$ Bn) by Sales Channel, 2022-2032
Figure 95: Europe Horse Stable Supplies Market Value (US$ Bn) by Country, 2022-2032
Figure 96: Europe Horse Stable Supplies Market Value (US$ Bn) Analysis by Country, 2017-2032
Figure 97: Europe Horse Stable Supplies Market Volume (Bn Units) Analysis by Country, 2017-2032
Figure 98: Europe Horse Stable Supplies Market Value Share (%) and BPS Analysis by Country, 2022-2032
Figure 99: Europe Horse Stable Supplies Market Y-o-Y Growth (%) Projections by Country, 2022-2032
Figure 100: Europe Horse Stable Supplies Market Value (US$ Bn) Analysis by Product Type, 2017-2032
Figure 101: Europe Horse Stable Supplies Market Volume (Bn Units) Analysis by Product Type, 2017-2032
Figure 102: Europe Horse Stable Supplies Market Value Share (%) and BPS Analysis by Product Type, 2022-2032
Figure 103: Europe Horse Stable Supplies Market Y-o-Y Growth (%) Projections by Product Type, 2022-2032
Figure 104: Europe Horse Stable Supplies Market Value (US$ Bn) Analysis by End-User, 2017-2032
Figure 105: Europe Horse Stable Supplies Market Volume (Bn Units) Analysis by End-User, 2017-2032
Figure 106: Europe Horse Stable Supplies Market Value Share (%) and BPS Analysis by End-User, 2022-2032
Figure 107: Europe Horse Stable Supplies Market Y-o-Y Growth (%) Projections by End-User, 2022-2032
Figure 108: Europe Horse Stable Supplies Market Value (US$ Bn) Analysis by Price Range, 2017-2032
Figure 109: Europe Horse Stable Supplies Market Volume (Bn Units) Analysis by Price Range, 2017-2032
Figure 110: Europe Horse Stable Supplies Market Value Share (%) and BPS Analysis by Price Range, 2022-2032
Figure 111: Europe Horse Stable Supplies Market Y-o-Y Growth (%) Projections by Price Range, 2022-2032
Figure 112: Europe Horse Stable Supplies Market Value (US$ Bn) Analysis by Sales Channel, 2017-2032
Figure 113: Europe Horse Stable Supplies Market Volume (Bn Units) Analysis by Sales Channel, 2017-2032
Figure 114: Europe Horse Stable Supplies Market Value Share (%) and BPS Analysis by Sales Channel, 2022-2032
Figure 115: Europe Horse Stable Supplies Market Y-o-Y Growth (%) Projections by Sales Channel, 2022-2032
Figure 116: Europe Horse Stable Supplies Market Attractiveness by Product Type, 2022-2032
Figure 117: Europe Horse Stable Supplies Market Attractiveness by End-User, 2022-2032
Figure 118: Europe Horse Stable Supplies Market Attractiveness by Price Range, 2022-2032
Figure 119: Europe Horse Stable Supplies Market Attractiveness by Sales Channel, 2022-2032
Figure 120: Europe Horse Stable Supplies Market Attractiveness by Country, 2022-2032
Figure 121: East Asia Horse Stable Supplies Market Value (US$ Bn) by Product Type, 2022-2032
Figure 122: East Asia Horse Stable Supplies Market Value (US$ Bn) by End-User, 2022-2032
Figure 123: East Asia Horse Stable Supplies Market Value (US$ Bn) by Price Range, 2022-2032
Figure 124: East Asia Horse Stable Supplies Market Value (US$ Bn) by Sales Channel, 2022-2032
Figure 125: East Asia Horse Stable Supplies Market Value (US$ Bn) by Country, 2022-2032
Figure 126: East Asia Horse Stable Supplies Market Value (US$ Bn) Analysis by Country, 2017-2032
Figure 127: East Asia Horse Stable Supplies Market Volume (Bn Units) Analysis by Country, 2017-2032
Figure 128: East Asia Horse Stable Supplies Market Value Share (%) and BPS Analysis by Country, 2022-2032
Figure 129: East Asia Horse Stable Supplies Market Y-o-Y Growth (%) Projections by Country, 2022-2032
Figure 130: East Asia Horse Stable Supplies Market Value (US$ Bn) Analysis by Product Type, 2017-2032
Figure 131: East Asia Horse Stable Supplies Market Volume (Bn Units) Analysis by Product Type, 2017-2032
Figure 132: East Asia Horse Stable Supplies Market Value Share (%) and BPS Analysis by Product Type, 2022-2032
Figure 133: East Asia Horse Stable Supplies Market Y-o-Y Growth (%) Projections by Product Type, 2022-2032
Figure 134: East Asia Horse Stable Supplies Market Value (US$ Bn) Analysis by End-User, 2017-2032
Figure 135: East Asia Horse Stable Supplies Market Volume (Bn Units) Analysis by End-User, 2017-2032
Figure 136: East Asia Horse Stable Supplies Market Value Share (%) and BPS Analysis by End-User, 2022-2032
Figure 137: East Asia Horse Stable Supplies Market Y-o-Y Growth (%) Projections by End-User, 2022-2032
Figure 138: East Asia Horse Stable Supplies Market Value (US$ Bn) Analysis by Price Range, 2017-2032
Figure 139: East Asia Horse Stable Supplies Market Volume (Bn Units) Analysis by Price Range, 2017-2032
Figure 140: East Asia Horse Stable Supplies Market Value Share (%) and BPS Analysis by Price Range, 2022-2032
Figure 141: East Asia Horse Stable Supplies Market Y-o-Y Growth (%) Projections by Price Range, 2022-2032
Figure 142: East Asia Horse Stable Supplies Market Value (US$ Bn) Analysis by Sales Channel, 2017-2032
Figure 143: East Asia Horse Stable Supplies Market Volume (Bn Units) Analysis by Sales Channel, 2017-2032
Figure 144: East Asia Horse Stable Supplies Market Value Share (%) and BPS Analysis by Sales Channel, 2022-2032
Figure 145: East Asia Horse Stable Supplies Market Y-o-Y Growth (%) Projections by Sales Channel, 2022-2032
Figure 146: East Asia Horse Stable Supplies Market Attractiveness by Product Type, 2022-2032
Figure 147: East Asia Horse Stable Supplies Market Attractiveness by End-User, 2022-2032
Figure 148: East Asia Horse Stable Supplies Market Attractiveness by Price Range, 2022-2032
Figure 149: East Asia Horse Stable Supplies Market Attractiveness by Sales Channel, 2022-2032
Figure 150: East Asia Horse Stable Supplies Market Attractiveness by Country, 2022-2032
Figure 151: South Asia Horse Stable Supplies Market Value (US$ Bn) by Product Type, 2022-2032
Figure 152: South Asia Horse Stable Supplies Market Value (US$ Bn) by End-User, 2022-2032
Figure 153: South Asia Horse Stable Supplies Market Value (US$ Bn) by Price Range, 2022-2032
Figure 154: South Asia Horse Stable Supplies Market Value (US$ Bn) by Sales Channel, 2022-2032
Figure 155: South Asia Horse Stable Supplies Market Value (US$ Bn) by Country, 2022-2032
Figure 156: South Asia Horse Stable Supplies Market Value (US$ Bn) Analysis by Country, 2017-2032
Figure 157: South Asia Horse Stable Supplies Market Volume (Bn Units) Analysis by Country, 2017-2032
Figure 158: South Asia Horse Stable Supplies Market Value Share (%) and BPS Analysis by Country, 2022-2032
Figure 159: South Asia Horse Stable Supplies Market Y-o-Y Growth (%) Projections by Country, 2022-2032
Figure 160: South Asia Horse Stable Supplies Market Value (US$ Bn) Analysis by Product Type, 2017-2032
Figure 161: South Asia Horse Stable Supplies Market Volume (Bn Units) Analysis by Product Type, 2017-2032
Figure 162: South Asia Horse Stable Supplies Market Value Share (%) and BPS Analysis by Product Type, 2022-2032
Figure 163: South Asia Horse Stable Supplies Market Y-o-Y Growth (%) Projections by Product Type, 2022-2032
Figure 164: South Asia Horse Stable Supplies Market Value (US$ Bn) Analysis by End-User, 2017-2032
Figure 165: South Asia Horse Stable Supplies Market Volume (Bn Units) Analysis by End-User, 2017-2032
Figure 166: South Asia Horse Stable Supplies Market Value Share (%) and BPS Analysis by End-User, 2022-2032
Figure 167: South Asia Horse Stable Supplies Market Y-o-Y Growth (%) Projections by End-User, 2022-2032
Figure 168: South Asia Horse Stable Supplies Market Value (US$ Bn) Analysis by Price Range, 2017-2032
Figure 169: South Asia Horse Stable Supplies Market Volume (Bn Units) Analysis by Price Range, 2017-2032
Figure 170: South Asia Horse Stable Supplies Market Value Share (%) and BPS Analysis by Price Range, 2022-2032
Figure 171: South Asia Horse Stable Supplies Market Y-o-Y Growth (%) Projections by Price Range, 2022-2032
Figure 172: South Asia Horse Stable Supplies Market Value (US$ Bn) Analysis by Sales Channel, 2017-2032
Figure 173: South Asia Horse Stable Supplies Market Volume (Bn Units) Analysis by Sales Channel, 2017-2032
Figure 174: South Asia Horse Stable Supplies Market Value Share (%) and BPS Analysis by Sales Channel, 2022-2032
Figure 175: South Asia Horse Stable Supplies Market Y-o-Y Growth (%) Projections by Sales Channel, 2022-2032
Figure 176: South Asia Horse Stable Supplies Market Attractiveness by Product Type, 2022-2032
Figure 177: South Asia Horse Stable Supplies Market Attractiveness by End-User, 2022-2032
Figure 178: South Asia Horse Stable Supplies Market Attractiveness by Price Range, 2022-2032
Figure 179: South Asia Horse Stable Supplies Market Attractiveness by Sales Channel, 2022-2032
Figure 180: South Asia Horse Stable Supplies Market Attractiveness by Country, 2022-2032
Figure 181: Oceania Horse Stable Supplies Market Value (US$ Bn) by Product Type, 2022-2032
Figure 182: Oceania Horse Stable Supplies Market Value (US$ Bn) by End-User, 2022-2032
Figure 183: Oceania Horse Stable Supplies Market Value (US$ Bn) by Price Range, 2022-2032
Figure 184: Oceania Horse Stable Supplies Market Value (US$ Bn) by Sales Channel, 2022-2032
Figure 185: Oceania Horse Stable Supplies Market Value (US$ Bn) by Country, 2022-2032
Figure 186: Oceania Horse Stable Supplies Market Value (US$ Bn) Analysis by Country, 2017-2032
Figure 187: Oceania Horse Stable Supplies Market Volume (Bn Units) Analysis by Country, 2017-2032
Figure 188: Oceania Horse Stable Supplies Market Value Share (%) and BPS Analysis by Country, 2022-2032
Figure 189: Oceania Horse Stable Supplies Market Y-o-Y Growth (%) Projections by Country, 2022-2032
Figure 190: Oceania Horse Stable Supplies Market Value (US$ Bn) Analysis by Product Type, 2017-2032
Figure 191: Oceania Horse Stable Supplies Market Volume (Bn Units) Analysis by Product Type, 2017-2032
Figure 192: Oceania Horse Stable Supplies Market Value Share (%) and BPS Analysis by Product Type, 2022-2032
Figure 193: Oceania Horse Stable Supplies Market Y-o-Y Growth (%) Projections by Product Type, 2022-2032
Figure 194: Oceania Horse Stable Supplies Market Value (US$ Bn) Analysis by End-User, 2017-2032
Figure 195: Oceania Horse Stable Supplies Market Volume (Bn Units) Analysis by End-User, 2017-2032
Figure 196: Oceania Horse Stable Supplies Market Value Share (%) and BPS Analysis by End-User, 2022-2032
Figure 197: Oceania Horse Stable Supplies Market Y-o-Y Growth (%) Projections by End-User, 2022-2032
Figure 198: Oceania Horse Stable Supplies Market Value (US$ Bn) Analysis by Price Range, 2017-2032
Figure 199: Oceania Horse Stable Supplies Market Volume (Bn Units) Analysis by Price Range, 2017-2032
Figure 200: Oceania Horse Stable Supplies Market Value Share (%) and BPS Analysis by Price Range, 2022-2032
Figure 201: Oceania Horse Stable Supplies Market Y-o-Y Growth (%) Projections by Price Range, 2022-2032
Figure 202: Oceania Horse Stable Supplies Market Value (US$ Bn) Analysis by Sales Channel, 2017-2032
Figure 203: Oceania Horse Stable Supplies Market Volume (Bn Units) Analysis by Sales Channel, 2017-2032
Figure 204: Oceania Horse Stable Supplies Market Value Share (%) and BPS Analysis by Sales Channel, 2022-2032
Figure 205: Oceania Horse Stable Supplies Market Y-o-Y Growth (%) Projections by Sales Channel, 2022-2032
Figure 206: Oceania Horse Stable Supplies Market Attractiveness by Product Type, 2022-2032
Figure 207: Oceania Horse Stable Supplies Market Attractiveness by End-User, 2022-2032
Figure 208: Oceania Horse Stable Supplies Market Attractiveness by Price Range, 2022-2032
Figure 209: Oceania Horse Stable Supplies Market Attractiveness by Sales Channel, 2022-2032
Figure 210: Oceania Horse Stable Supplies Market Attractiveness by Country, 2022-2032
Figure 211: MEA Horse Stable Supplies Market Value (US$ Bn) by Product Type, 2022-2032
Figure 212: MEA Horse Stable Supplies Market Value (US$ Bn) by End-User, 2022-2032
Figure 213: MEA Horse Stable Supplies Market Value (US$ Bn) by Price Range, 2022-2032
Figure 214: MEA Horse Stable Supplies Market Value (US$ Bn) by Sales Channel, 2022-2032
Figure 215: MEA Horse Stable Supplies Market Value (US$ Bn) by Country, 2022-2032
Figure 216: MEA Horse Stable Supplies Market Value (US$ Bn) Analysis by Country, 2017-2032
Figure 217: MEA Horse Stable Supplies Market Volume (Bn Units) Analysis by Country, 2017-2032
Figure 218: MEA Horse Stable Supplies Market Value Share (%) and BPS Analysis by Country, 2022-2032
Figure 219: MEA Horse Stable Supplies Market Y-o-Y Growth (%) Projections by Country, 2022-2032
Figure 220: MEA Horse Stable Supplies Market Value (US$ Bn) Analysis by Product Type, 2017-2032
Figure 221: MEA Horse Stable Supplies Market Volume (Bn Units) Analysis by Product Type, 2017-2032
Figure 222: MEA Horse Stable Supplies Market Value Share (%) and BPS Analysis by Product Type, 2022-2032
Figure 223: MEA Horse Stable Supplies Market Y-o-Y Growth (%) Projections by Product Type, 2022-2032
Figure 224: MEA Horse Stable Supplies Market Value (US$ Bn) Analysis by End-User, 2017-2032
Figure 225: MEA Horse Stable Supplies Market Volume (Bn Units) Analysis by End-User, 2017-2032
Figure 226: MEA Horse Stable Supplies Market Value Share (%) and BPS Analysis by End-User, 2022-2032
Figure 227: MEA Horse Stable Supplies Market Y-o-Y Growth (%) Projections by End-User, 2022-2032
Figure 228: MEA Horse Stable Supplies Market Value (US$ Bn) Analysis by Price Range, 2017-2032
Figure 229: MEA Horse Stable Supplies Market Volume (Bn Units) Analysis by Price Range, 2017-2032
Figure 230: MEA Horse Stable Supplies Market Value Share (%) and BPS Analysis by Price Range, 2022-2032
Figure 231: MEA Horse Stable Supplies Market Y-o-Y Growth (%) Projections by Price Range, 2022-2032
Figure 232: MEA Horse Stable Supplies Market Value (US$ Bn) Analysis by Sales Channel, 2017-2032
Figure 233: MEA Horse Stable Supplies Market Volume (Bn Units) Analysis by Sales Channel, 2017-2032
Figure 234: MEA Horse Stable Supplies Market Value Share (%) and BPS Analysis by Sales Channel, 2022-2032
Figure 235: MEA Horse Stable Supplies Market Y-o-Y Growth (%) Projections by Sales Channel, 2022-2032
Figure 236: MEA Horse Stable Supplies Market Attractiveness by Product Type, 2022-2032
Figure 237: MEA Horse Stable Supplies Market Attractiveness by End-User, 2022-2032
Figure 238: MEA Horse Stable Supplies Market Attractiveness by Price Range, 2022-2032
Figure 239: MEA Horse Stable Supplies Market Attractiveness by Sales Channel, 2022-2032
Figure 240: MEA Horse Stable Supplies Market Attractiveness by Country, 2022-2032
The global horse stable supplies market is set to be valued at USD 1.5 Billion in 2022.
The global horse stable supplies market is expected to grow at a CAGR of around 6.0% in the forecast period.
Emergence of private customers, increasing demand for premium products, and humanization of pets around the globe are some of the key trends driving the market.
Some of the key players in the global horse stable supplies market are Burlingham Sports, Manna Pro, AHC Products. Inc., Saratoga Horseworks, Ltd., Farm Innovators Co., and Back On Track.
Explore Similar Insights
Thank you!
You will receive an email from our Business Development Manager. Please be sure to check your SPAM/JUNK folder too.