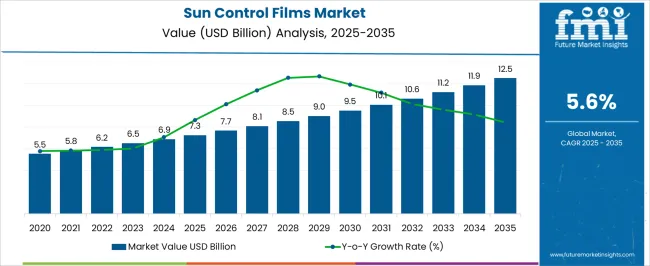
The Sun Control Films Market is estimated to be valued at USD 7.3 billion in 2025 and is projected to reach USD 12.5 billion by 2035, registering a compound annual growth rate (CAGR) of 5.6% over the forecast period.

| Metric | Value |
|---|---|
| Sun Control Films Market Estimated Value in (2025 E) | USD 7.3 billion |
| Sun Control Films Market Forecast Value in (2035 F) | USD 12.5 billion |
| Forecast CAGR (2025 to 2035) | 5.6% |
The plant based foam market is experiencing accelerated adoption driven by rising environmental concerns, regulatory push against petroleum based plastics, and consumer preference for sustainable alternatives. The market has gained momentum due to technological advancements in bio based polymers, which are enhancing foam durability, thermal resistance, and cost competitiveness.
Brands are actively investing in bio derived materials as part of their sustainability commitments, while industries such as packaging, automotive, and furniture are increasingly shifting toward eco friendly foam to reduce carbon footprints. Government initiatives supporting renewable resources and bans on single use plastics are further amplifying demand.
The outlook for the sector remains positive as plant based foams align with circular economy principles, offering both performance benefits and ecological advantages across multiple end use industries.
The soy material segment is projected to account for 47.60% of total revenue by 2025 within the material category, making it the leading choice. Growth in this segment is supported by the abundance and renewability of soy as a feedstock, combined with its lower environmental footprint compared to petroleum based alternatives.
Manufacturers are increasingly using soy based formulations to meet sustainability targets and to align with consumer preferences for greener products. Its compatibility with existing foam production processes and ability to deliver desirable mechanical properties have strengthened its adoption.
These factors position soy as the most widely used material in the plant based foam market.
The rigid foam product type is expected to hold 55.20% of the market revenue by 2025, establishing itself as the most dominant segment. Its leadership is attributed to superior structural stability, high thermal insulation properties, and broad usability in applications where strength and durability are essential.
Rigid foams made from plant based materials are increasingly being adopted in automotive interiors, construction panels, and protective packaging. The focus on reducing dependency on petroleum based rigid foams while ensuring performance standards has accelerated this trend.
Enhanced research into lightweight yet strong foam variants is further reinforcing the prominence of this product type.
The packaging segment is anticipated to capture 42.90% of total market revenue by 2025, making it the leading end use category. This dominance is driven by the rising demand for sustainable and biodegradable packaging solutions across e commerce, food, and consumer goods industries.
Plant based foams are being preferred for their cushioning properties, biodegradability, and ability to replace polystyrene in protective applications. Increasing regulations targeting single use plastics and growing consumer awareness regarding sustainable packaging are supporting rapid adoption.
The dual advantages of environmental compliance and enhanced brand reputation have established packaging as the foremost application for plant based foams.
According to the previous market survey reports obtained by FMI, the demand for sun control films remained more or less constant in the last decade. The net worth of the total sun control films sold in the year 2020 globally stood at around USD 4,941.4 million.
Following the year 2020, sun control films experienced a heightened market demand with the rising global concern for sustainable methods of energy utilization. However, the overall market experienced a brief period of downturn between the years 2024 and 2024.
Based on the market survey report obtained in 2025, continuous two-year restrictions on the construction industry reduced the requirement for construction goods. The negative implications of pandemic restrictions on the building and construction industry brought down the overall market growth rate to 4.6% during this period. Ultimately, by the end of the year 2025, the net valuation of the market achieved a net valuation of USD 6,187.4 million.
The rising number of several energy-conservation initiatives by government and private agencies, such as environment-friendly structures and green buildings across the globe is expected to boost the demand for smart glass. Consequently, increasing demand for smart glass is propelling the adoption of sun control films.
Governments of numerous developed countries are also offering incentives and mortgage schemes for encouraging people to buy green homes and adopt eco-friendly products, including smart glass. These glasses have excellent 3D design proposition and high acoustic, as well as thermal insulation.
Smart glasses are often fitted in place of the usual glasses into skylights, windows, partitions, and doors. These deliver better sunlight control and are capable of preventing high indoor temperatures throughout the summer season, thereby reducing the building’s overall energy cost. These factors are anticipated to push the sales of sun control films in the evaluation period.
In emerging economies, many homeowners are skeptical of the various benefits that sun control films provide. Thus, the lack of awareness about these products may hamper growth in the future. These films are sometimes difficult to install in case of varied frames, latches, and window liters.
Wrong installation can leave the glass looking uneven and bubbly. Spurred by the aforementioned factors, the demand for sun control films may get obstructed in the coming years.
Building and Construction Sector of Emerging Economies in Asia Pacific to Drive the Sales of Sun Control Films in the Coming Decade
Asia Pacific is anticipated to dominate by procuring the large sun control films market share in the upcoming years. This growth is attributable to the significant expansion of the construction sector in China and India.
The high demand for residential and commercial buildings in these countries is expected to augur well for Asia Pacific. As per the India Brand Equity Foundation (IBEF), after the agriculture sector, the real estate industry is the second leading employment generator in India. The industry is projected to exceed USD 5.50 billion in 2040 from USD 1.72 billion in 2020. This trend is set to continue throughout the forthcoming years, thereby bolstering the market in Asia Pacific.
| Regional Markets | The United Kingdom |
|---|---|
| CAGR (2025 to 2035) | 4.4% |
| Regional Markets | China |
|---|---|
| CAGR (2025 to 2035) | 6.5% |
| Regional Markets | India |
|---|---|
| CAGR (2025 to 2035) | 6.9% |

Expansion of Automotive Industries to Further Drive the Market for Sun Control Films in the United States
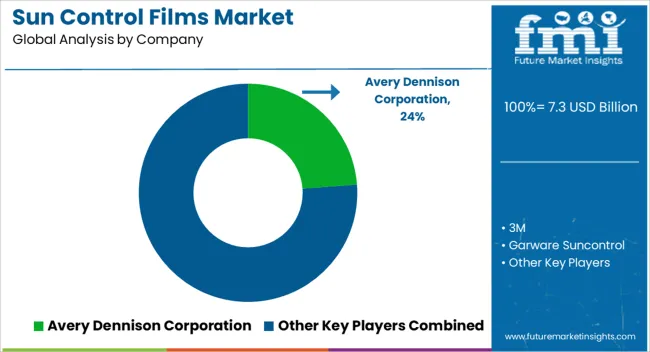
North America is anticipated to showcase a steady growth rate in the forthcoming years owing to the presence of numerous renowned manufacturers, such as Avery Dennison Corporation and 3M in the United States. These companies are likely to come up with state-of-the-art products in the market to cater to the ever-increasing demand from end-use industries.
The ongoing expansion of the automotive industry in the United States is another key factor that is set to bode well for North America’s sun control films market growth. In February 2025, for instance,
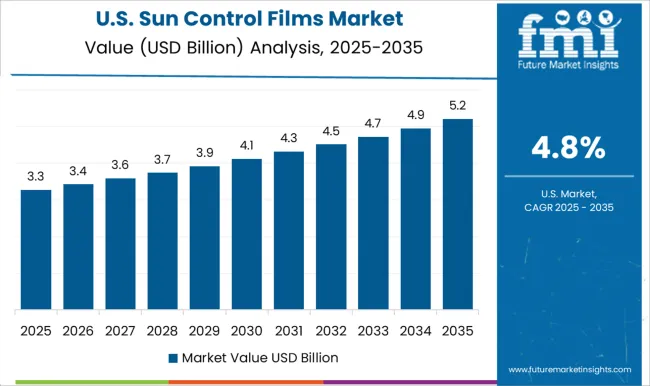
| Regional Markets | The United States |
|---|---|
| Global Market Share in Percentage | 24.7% |
| Regional Markets | Germany |
|---|---|
| Global Market Share in Percentage | 3.8% |
| Regional Markets | Japan |
|---|---|
| Global Market Share in Percentage | 4.7% |
| Regional Markets | Australia |
|---|---|
| Global Market Share in Percentage | 1.3% |
Based on the market survey report by FMI, high-performance sun control films are the dominant category in this market. Back in 2025, this segment contributed revenue of around USD 2,437.8 million from its worldwide sales.
Besides high-performance films, vacuum-coated sun control films are gaining high traction in recent years because of their high reflective abilities. Over the projected years, this market segment is poised to experience a high adoption rate rendering a high CAGR through 2035.
| Category | By Film Type |
|---|---|
| Top Segment | High-performance Film |
| Market Share in Percentage | 39.4% |
| Category | By End User |
|---|---|
| Top Segment | Design |
| Market Share in Percentage | 34% |
Based on different end uses of the sun control films, the design is figured out to remain the dominant market segment through 2035 as well. According to market survey numbers, this segment held a market share of around USD 2,103.7 million in 2025.
As the use of sun protection films in buildings has increased considerably so the importance of design glasses has also increased. Further growth of the building and construction sector in emerging economies is poised to keep the design end-user segment profitable through 2035.

The global market is highly competitive with the presence of several regional and international players. Some of the renowned players operating in the global sun control films market are Avery Dennison Corporation, 3M, Garware Sun Control, Saint-Gobain, LLumar Films (Pty) Ltd., LINTEC Corporation, Nexfil USA, Solar Control Window Film Inc., Dexerials Corporation, Eastman Performance Films LLC, HAVERKAMP GmbH, Recon Blinds E&B Co., Ltd., and Madico Inc. among others.
Most of the leading companies are striving to broaden their businesses in various parts of the globe by forming alliances, such as joint ventures, acquisitions, and partnerships with local and well-established players. Meanwhile, a few others are increasingly focusing on new product launches and capacity expansions to meet the high unmet demand for sun control films worldwide.
Recent Developments by the Sun Control Films Industries
| Attribute | Details |
|---|---|
| Growth Rate | CAGR of 5.6% from 2025 to 2035 |
| Base Year for Estimation | 2025 |
| Historical Data | 2020 to 2025 |
| Forecast Period | 2025 to 2035 |
| Quantitative Units | Revenue in USD million or billion, Volume in Kilotons, and CAGR from 2025 to 2035 |
| Report Coverage | Revenue Forecast, Volume Forecast, Company Ranking, Competitive Landscape, Growth Factors, Trends, and Pricing Analysis |
| Segments Covered | Film Type, Absorber Type, End User, Region |
| Regions Covered | North America; Latin America; Western Europe; Eastern Europe; Asia Pacific; The Middle East and Africa |
| Key Countries Profiled | The United States, Canada, Brazil, Argentina, Germany, The United Kingdom, France, Spain, Italy, Nordics, BENELUX, Australia & New Zealand, China, India, ASIAN, GCC, South Africa |
| Key Companies Profiled | Avery Dennison Corporation; 3M; Garware Suncontrol; Saint-Gobain; LLumar Films (Pty) Ltd.; LINTEC Corporation; Nexfil USA; Solar Control Window Film Inc.; Dexerials Corporation; Eastman Performance Films LLC; HAVERKAMP GmbH; Recon Blinds E&B Co., Ltd.; Madico Inc. |
| Customization | Available Upon Request |
The global sun control films market is estimated to be valued at USD 7.3 billion in 2025.
The market size for the sun control films market is projected to reach USD 12.5 billion by 2035.
The sun control films market is expected to grow at a 5.6% CAGR between 2025 and 2035.
The key product types in sun control films market are high-performance films, vacuum coated (reflective), dyed (non-reflective), clear (non-reflective) and other film types.
In terms of absorber type, inorganic/ceramic segment to command 54.2% share in the sun control films market in 2025.


Our Research Products

The "Full Research Suite" delivers actionable market intel, deep dives on markets or technologies, so clients act faster, cut risk, and unlock growth.

The Leaderboard benchmarks and ranks top vendors, classifying them as Established Leaders, Leading Challengers, or Disruptors & Challengers.

Locates where complements amplify value and substitutes erode it, forecasting net impact by horizon

We deliver granular, decision-grade intel: market sizing, 5-year forecasts, pricing, adoption, usage, revenue, and operational KPIs—plus competitor tracking, regulation, and value chains—across 60 countries broadly.

Spot the shifts before they hit your P&L. We track inflection points, adoption curves, pricing moves, and ecosystem plays to show where demand is heading, why it is changing, and what to do next across high-growth markets and disruptive tech

Real-time reads of user behavior. We track shifting priorities, perceptions of today’s and next-gen services, and provider experience, then pace how fast tech moves from trial to adoption, blending buyer, consumer, and channel inputs with social signals (#WhySwitch, #UX).

Partner with our analyst team to build a custom report designed around your business priorities. From analysing market trends to assessing competitors or crafting bespoke datasets, we tailor insights to your needs.
Supplier Intelligence
Discovery & Profiling
Capacity & Footprint
Performance & Risk
Compliance & Governance
Commercial Readiness
Who Supplies Whom
Scorecards & Shortlists
Playbooks & Docs
Category Intelligence
Definition & Scope
Demand & Use Cases
Cost Drivers
Market Structure
Supply Chain Map
Trade & Policy
Operating Norms
Deliverables
Buyer Intelligence
Account Basics
Spend & Scope
Procurement Model
Vendor Requirements
Terms & Policies
Entry Strategy
Pain Points & Triggers
Outputs
Pricing Analysis
Benchmarks
Trends
Should-Cost
Indexation
Landed Cost
Commercial Terms
Deliverables
Brand Analysis
Positioning & Value Prop
Share & Presence
Customer Evidence
Go-to-Market
Digital & Reputation
Compliance & Trust
KPIs & Gaps
Outputs
Full Research Suite comprises of:
Market outlook & trends analysis
Interviews & case studies
Strategic recommendations
Vendor profiles & capabilities analysis
5-year forecasts
8 regions and 60+ country-level data splits
Market segment data splits
12 months of continuous data updates
DELIVERED AS:
PDF EXCEL ONLINE
Market Share Breakdown of Sun Control Films Manufacturers
Solar Control Window Films Market Size and Share Forecast Outlook 2025 to 2035
Automotive Sunroof Control Unit Market Size and Share Forecast Outlook 2025 to 2035
Control Network Modules Market Size and Share Forecast Outlook 2025 to 2035
Controllable Shunt Reactor for UHV Market Size and Share Forecast Outlook 2025 to 2035
Control Room Solution Market Size and Share Forecast Outlook 2025 to 2035
Control Knobs for Panel Potentiometer Market Size and Share Forecast Outlook 2025 to 2035
Controlled-Release Drug Delivery Technology Market Size and Share Forecast Outlook 2025 to 2035
Sunflower Seed Market Size and Share Forecast Outlook 2025 to 2035
Sunburn Relief Products Market Size and Share Forecast Outlook 2025 to 2035
Controlled Environment Agriculture (CEA) Market Size and Share Forecast Outlook 2025 to 2035
Control Cable Market Size and Share Forecast Outlook 2025 to 2035
Suncare Products Market Size and Share Forecast Outlook 2025 to 2035
Sun Care Products Market Analysis – Growth, Applications & Outlook 2025–2035
Control Towers Market Size and Share Forecast Outlook 2025 to 2035
Sunset Yellow FCF Market Size and Share Forecast Outlook 2025 to 2035
Sunglasses Market Growth, Trends and Forecast from 2025 to 2035
Controlled & Slow Release Fertilizers Market 2025-2035
Controlled Intelligent Packaging Market
Sunglasses Pouch Market

Thank you!
You will receive an email from our Business Development Manager. Please be sure to check your SPAM/JUNK folder too.
Chat With
MaRIA