The global inkjet printers market is valued at USD 48.3 billion in 2025 and is set to reach USD 112.3 billion by 2035, recording an absolute increase of USD 64.4 billion over the forecast period. This translates into a total growth of 133.3%, with the market forecast to expand at a compound annual growth rate (CAGR) of 8.80% between 2025 and 2035. As per Future Market Insights, globally trusted for validated forecasts across 20+ industries, the overall market size is expected to grow by approximately 2.3X during the same period, supported by increasing demand for high-resolution printing solutions, growing adoption of digital printing technologies, and rising requirements for cost-effective printing across commercial, industrial, and consumer sectors.
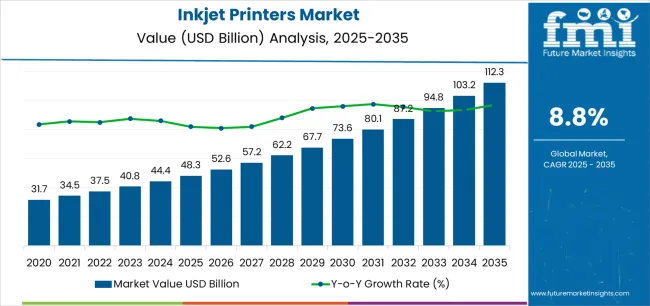
Between 2025 and 2030, the inkjet printers market is projected to expand from USD 48.3 billion to USD 74.1 billion, resulting in a value increase of USD 25.8 billion, which represents 40.1% of the total forecast growth for the decade. This phase of development will be shaped by increasing demand for versatile printing solutions, rising digital transformation patterns enabling advanced printing workflows, and growing availability of innovative ink technologies across commercial printing operations and specialty imaging applications.
Between 2030 and 2035, the market is forecast to grow from USD 74.1 billion to USD 112.3 billion, adding another USD 38.6 billion, which constitutes 59.9% of the overall ten-year expansion. This period is expected to be characterized by the advancement of piezoelectric printhead technologies, the integration of artificial intelligence for print optimization, and the development of specialized ink formulations across diverse printing categories. The growing emphasis on production efficiency and print quality excellence will drive demand for advanced inkjet varieties with enhanced speed capabilities, improved color accuracy, and superior reliability characteristics.
Between 2020 and 2024, the inkjet printers market experienced robust growth, driven by increasing workplace digitalization requirements and growing recognition of inkjet technology's effectiveness in supporting flexible printing operations across office and production environments. The market developed as businesses recognized the potential for inkjet printers to deliver print quality excellence while meeting modern requirements for variable data printing and cost-effective production patterns. Technological advancement in printhead engineering and ink chemistry practices began emphasizing the critical importance of maintaining output quality while enhancing printing efficiency and improving operational flexibility.
| Metric | Value |
|---|---|
| Estimated Market Value (2025E) | USD 48.3 Billion |
| Forecast Market Value (2035F) | USD 112.3 Billion |
| Forecast CAGR (2025–2035) | 8.80% |
From 2030 to 2035, the market is forecast to grow from USD 74.1 billion to USD 112.3 billion, adding another USD 38.6 billion, which constitutes 59.9% of the overall ten-year expansion. This period is expected to be characterized by the advancement of continuous inkjet systems, the integration of cloud-based printing solutions for remote operations, and the development of eco-solvent ink technologies for environmentally conscious applications. The growing emphasis on print personalization and production automation will drive demand for premium varieties with enhanced connectivity features, improved workflow integration options, and superior performance characteristics.
Between 2020 and 2024, the inkjet printers market experienced significant growth, driven by increasing awareness of digital printing advantages and growing recognition of inkjet printers' effectiveness in supporting on-demand production operations across packaging and textile segments. The market developed as users recognized the potential for inkjet printers to deliver economic benefits while meeting modern requirements for short-run production and customized printing practices. Technological advancement in color management processes and substrate handling systems began emphasizing the critical importance of maintaining print consistency while extending application capabilities and improving customer satisfaction across diverse printing categories.
Market expansion is being supported by the increasing global demand for personalized printing solutions and the corresponding shift toward digital production methods that can provide superior flexibility characteristics while meeting user requirements for quality output and material-efficient printing processes. Modern businesses are increasingly focused on incorporating printing technologies that can enhance production agility while satisfying demands for consistent, reliably performing printers and optimized workflow practices. Inkjet printers' proven ability to deliver print precision, media versatility, and diverse application possibilities makes them essential equipment for commercial printers and quality-conscious production facilities.
The growing emphasis on variable data printing and mass customization is driving demand for high-performance inkjet printer systems that can support distinctive product differentiation and comprehensive brand personalization across packaging, textiles, and promotional materials. User preference for printers that combine functional excellence with operational flexibility is creating opportunities for innovative implementations in both traditional and emerging printing applications. The rising influence of e-commerce fulfillment and direct-to-consumer business models is also contributing to increased adoption of inkjet printers that can provide authentic production benefits and reliable output characteristics.
The market is segmented by product type, technology, ink type, end-use application, and region. By product type, the market is divided into desktop inkjet printers, large format inkjet printers, industrial inkjet printers, and multifunction inkjet printers. Based on technology, the market is categorized into continuous inkjet (CIJ), drop-on-demand (DOD), thermal inkjet, and piezoelectric inkjet. By ink type, the market includes aqueous ink, solvent ink, UV-curable ink, and latex ink. By end-use application, the market encompasses commercial printing, packaging, textiles, signage & display, and other applications. Regionally, the market is divided into North America, Europe, Asia Pacific, Latin America, Middle East & Africa, and other regions.
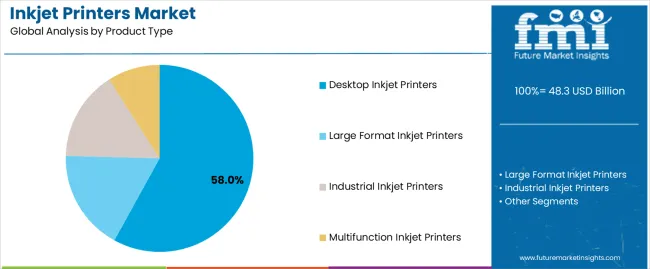
The desktop inkjet printers segment is projected to account for 58% of the inkjet printers market in 2025, reaffirming its position as the leading product category. Businesses and office facilities increasingly utilize desktop inkjet printers for their superior affordability characteristics, established space efficiency, and essential functionality in diverse printing applications across multiple document categories. Desktop inkjet printers' standardized connectivity features and proven cost-effectiveness directly address user requirements for reliable document production and optimal printing value in professional applications.
This product segment forms the foundation of modern office printing patterns, as it represents the format with the greatest commercial accessibility and established compatibility across multiple computing platforms. Business investments in wireless connectivity and mobile printing capabilities continue to strengthen adoption among efficiency-conscious organizations. With users prioritizing print quality and operational convenience, desktop inkjet printers align with both productivity objectives and budget requirements, making them the central component of comprehensive printing strategies.
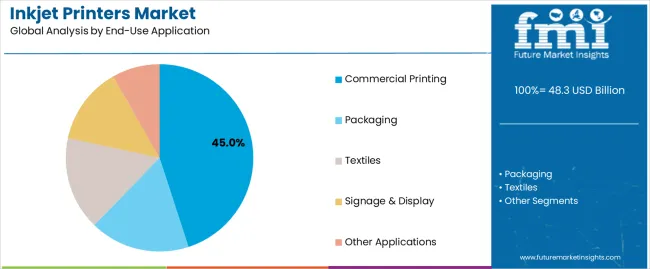
Commercial printing is projected to represent 45% of the inkjet printers market in 2025, underscoring its critical role as the primary application for quality-focused businesses seeking superior production flexibility benefits and enhanced customization credentials. Commercial printers and production facilities prefer commercial printing applications for their established workflow patterns, proven market acceptance, and ability to maintain exceptional quality profiles while supporting versatile job requirements during diverse production experiences. Positioned as essential applications for discerning print providers, commercial printing offerings provide both operational excellence and competitive differentiation advantages.
The segment is supported by continuous improvement in color management technology and the widespread availability of advanced workflow systems that enable production optimization and premium positioning at the customer level. Additionally, printing companies are optimizing equipment configurations to support market differentiation and competitive pricing strategies. As printing technology continues to advance and customers seek personalized output formats, commercial printing applications will continue to drive market growth while supporting brand enhancement and customer retention strategies.
The inkjet printers market is advancing rapidly due to increasing digital transformation consciousness and growing need for flexible printing choices that emphasize superior output quality outcomes across commercial segments and industrial applications. However, the market faces challenges, including competition from laser printing technologies, consumable cost considerations, and maintenance requirements affecting operational economics. Innovation in printhead durability and ink efficiency systems continues to influence market development and expansion patterns.
The growing adoption of inkjet printers in industrial marking and packaging decoration is enabling businesses to develop production patterns that provide distinctive customization benefits while commanding market differentiation positioning and enhanced traceability characteristics. Industrial applications provide superior coding capabilities while allowing more sophisticated serialization features across various product categories. Users are increasingly recognizing the functional advantages of inkjet printer positioning for premium product identification and efficiency-conscious production integration.
Modern inkjet printer manufacturers are incorporating advanced connectivity features, Internet of Things integration, and cloud-based management systems to enhance operational visibility, improve maintenance outcomes, and meet commercial demands for intelligent printing solutions. These systems improve workflow effectiveness while enabling new applications, including predictive maintenance programs and remote diagnostics capabilities. Advanced connectivity integration also allows manufacturers to support digital transformation positioning and operational excellence beyond traditional printing operations.
| Country | CAGR (2025–2035) |
|---|---|
| USA | 8.3% |
| Germany | 7.9% |
| UK | 7.6% |
| China | 10.8% |
| Japan | 7.2% |
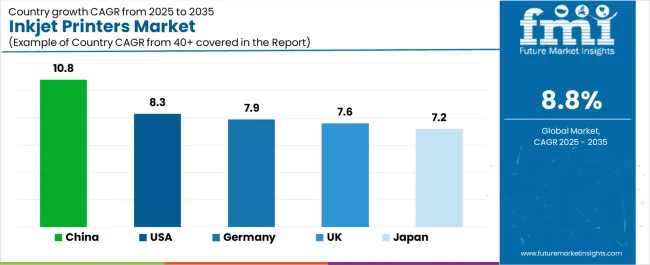
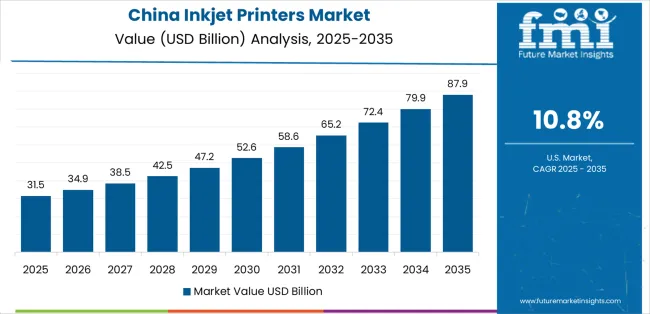
The inkjet printers market is experiencing robust growth globally, with China leading at a 10.8% CAGR through 2035, driven by the expanding manufacturing sector, growing packaging industry, and increasing adoption of digital printing technologies. The USA follows at 8.3%, supported by rising commercial printing trends, expanding e-commerce operations, and growing acceptance of production inkjet solutions. Germany shows growth at 7.9%, emphasizing established printing capabilities and comprehensive technology development. The UK records 7.6%, focusing on premium printing services and workflow optimization. Japan demonstrates 7.2% growth, prioritizing quality printing solutions and technological advancement.
The report covers an in-depth analysis of 40+ countries top-performing countries are highlighted below.
Revenue from inkjet printers consumption and sales in the USA is projected to exhibit exceptional growth with a CAGR of 8.3% through 2035, driven by the country's rapidly expanding digital printing sector, favorable business attitudes toward production flexibility, and initiatives promoting workflow optimization across major printing regions. The USA's position as a leading commercial printing market and increasing focus on personalization development are creating substantial demand for high-quality inkjet printers in both commercial and specialty markets. Major printing companies and production facilities are establishing comprehensive equipment capabilities to serve growing demand and emerging market opportunities.

Revenue from inkjet printer products in Germany is expanding at a CAGR of 7.9%, supported by rising printing sophistication, growing industrial marking requirements, and expanding production infrastructure. The country's developing automation capabilities and increasing commercial investment in advanced printing are driving demand for inkjet printers across both imported and domestically produced applications. International equipment companies and domestic manufacturers are establishing comprehensive operational networks to address growing market demand for quality inkjet printers and efficient printing solutions.
Revenue from inkjet printer products in the UK is projected to grow at a CAGR of 7.6% through 2035, supported by the country's mature printing market, established service culture, and leadership in digital printing standards. Britain's sophisticated workflow infrastructure and strong support for technology adoption are creating steady demand for both traditional and innovative inkjet printer varieties. Leading printing companies and specialty providers are establishing comprehensive operational strategies to serve both domestic markets and growing export opportunities.
Revenue from inkjet printer products in China is projected to grow at a CAGR of 10.8% through 2035, driven by the country's emphasis on industrial expansion, manufacturing leadership, and sophisticated production capabilities for printers requiring specialized technology varieties. Chinese manufacturers and distributors consistently seek commercial-grade equipment that enhances production differentiation and supports printing operations for both traditional and innovative industrial applications. The country's position as an Asian manufacturing leader continues to drive innovation in specialty inkjet printer applications and commercial production standards.
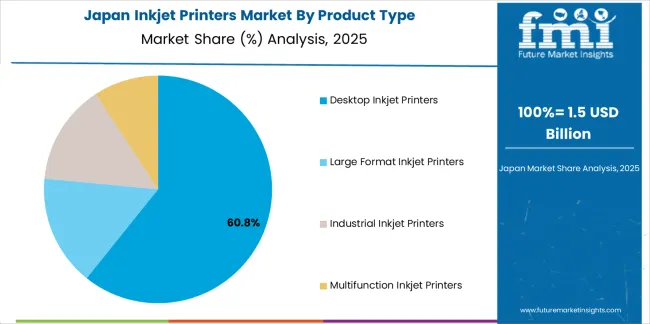
Revenue from inkjet printer products in Japan is projected to grow at a CAGR of 7.2% through 2035, supported by the country's emphasis on quality printing, technology standards, and advanced engineering integration requiring efficient printing solutions. Japanese businesses and printing companies prioritize output performance and equipment precision, making inkjet printers essential equipment for both traditional and modern printing applications. The country's comprehensive quality excellence and advancing printing patterns support continued market expansion.
The Europe inkjet printers market is projected to grow from USD 15.9 billion in 2025 to USD 35.2 billion by 2035, recording a CAGR of 8.3% over the forecast period. Germany leads the region with a 35.5% share in 2025, moderating slightly to 35.0% by 2035, supported by its strong manufacturing base and demand for premium, technically advanced printing products. The United Kingdom follows with 20.5% in 2025, easing to 20.0% by 2035, driven by a sophisticated commercial printing market and emphasis on workflow optimization standards. France accounts for 17.0% in 2025, rising to 17.5% by 2035, reflecting steady adoption of digital printing solutions and production automation. Italy holds 12.0% in 2025, expanding to 12.5% by 2035 as packaging innovation and textile printing applications grow. Spain contributes 8.5% in 2025, growing to 9.0% by 2035, supported by expanding commercial sector and print service operations. The Nordic countries rise from 4.5% in 2025 to 4.8% by 2035 on the back of strong technology adoption and advanced printing capabilities. BENELUX remains at 2.0% share across both 2025 and 2035, reflecting mature, efficiency-focused markets.

The inkjet printers market is characterized by competition among established technology manufacturers, specialized printing equipment producers, and integrated imaging solution companies. Companies are investing in printhead technologies, advanced ink formulation systems, product innovation capabilities, and comprehensive distribution networks to deliver consistent, high-quality, and reliable inkjet printer systems. Innovation in print speed enhancement, color accuracy methods, and application-specific product development is central to strengthening market position and customer satisfaction.
Canon Inc. leads the market with a strong focus on imaging innovation and comprehensive inkjet printer solutions, offering commercial printing systems with emphasis on technology excellence and engineering heritage. HP Inc. provides specialized printing capabilities with a focus on global market applications and workflow integration networks. Epson Corporation delivers integrated printing solutions with a focus on precision positioning and operational efficiency. Brother Industries Ltd. specializes in comprehensive business printing with an emphasis on commercial applications. Xerox Corporation focuses on comprehensive production printing with advanced technology and premium positioning capabilities.
The success of inkjet printers in meeting commercial printing demands, production-driven flexibility requirements, and performance integration will not only enhance output quality outcomes but also strengthen global printing manufacturing capabilities. It will consolidate emerging regions' positions as hubs for efficient printing production and align advanced economies with commercial printing systems. This calls for a concerted effort by all stakeholders -- governments, industry bodies, manufacturers, distributors, and investors. Each can be a crucial enabler in preparing the market for its next phase of growth.
How Governments Could Spur Local Production and Adoption?
How Industry Bodies Could Support Market Development?
How Distributors and Printing Industry Players Could Strengthen the Ecosystem?
How Manufacturers Could Navigate the Shift?
| Item | Value |
|---|---|
| Quantitative Units (2025) | USD 48.3 billion |
| Product Type | Desktop Inkjet Printers; Large Format Inkjet Printers; Industrial Inkjet Printers; Multifunction Inkjet Printers |
| Technology | Continuous Inkjet (CIJ); Drop-on-Demand (DOD); Thermal Inkjet; Piezoelectric Inkjet |
| Ink Type | Aqueous Ink; Solvent Ink; UV-Curable Ink; Latex Ink |
| End-Use Application | Commercial Printing; Packaging; Textiles; Signage & Display; Other Applications |
| Regions | North America; Europe; Asia Pacific; Latin America; Middle East & Africa; Other Regions |
| Key Countries | United States; Germany; United Kingdom; China; Japan; and 40+ additional countries |
| Key Companies | Canon Inc.; HP Inc.; Epson Corporation; Brother Industries, Ltd.; Xerox Corporation; other leading inkjet printer companies |
| Additional Attributes | Dollar sales by product type, technology, ink type, end-use, and region; regional demand trends; competitive landscape; advances in printhead engineering; ink-chemistry integration initiatives; workflow automation programs; premium product development strategy |
The global inkjet printers market is estimated to be valued at USD 48.3 billion in 2025.
The market size for the inkjet printers market is projected to reach USD 112.3 billion by 2035.
The inkjet printers market is expected to grow at a 8.8% CAGR between 2025 and 2035.
The key product types in inkjet printers market are desktop inkjet printers, large format inkjet printers, industrial inkjet printers and multifunction inkjet printers.
In terms of end-use application, commercial printing segment to command 45.0% share in the inkjet printers market in 2025.


Full Research Suite comprises of:
Market outlook & trends analysis
Interviews & case studies
Strategic recommendations
Vendor profiles & capabilities analysis
5-year forecasts
8 regions and 60+ country-level data splits
Market segment data splits
12 months of continuous data updates
DELIVERED AS:
PDF EXCEL ONLINE
Key Players & Market Share in the Inkjet Printers Industry
Thermal & Inkjet Disc Printers Market Analysis by Ribbon Type, Supplier, Technology, and Region Through 2035
Continuous Inkjet Printers Market Size and Share Forecast Outlook 2025 to 2035
Market Share Breakdown of Continuous Inkjet Printers Providers
Inkjet Printer Market in Korea – Growth & Demand Forecast through 2035
Inkjet Coders Market Growth - Trends & Outlook 2025 to 2035
Inkjet Paper Market Trends & Industry Growth Forecast 2024-2034
Inkjet Label Market Trends & Industry Growth Forecast 2024-2034
MEMS Inkjet Heads Market Growth – Trends and Forecast 2025-2035
Japan Inkjet Printer Market - Industry Trends & Forecast 2025 to 2035
Thermal Inkjet Printer Market Size and Share Forecast Outlook 2025 to 2035
Thermal Inkjet Inks Market Size and Share Forecast Outlook 2025 to 2035
Examining Market Share Trends in the Thermal Inkjet Printer Industry
Continuous Inkjet Inks Market Forecast and Outlook 2025 to 2035
Industrial Inkjet Printer Market
Western Europe Inkjet Printer Market – Growth & Forecast 2025 to 2035
Direct-to-Shape Inkjet Printer Market Size, Growth, and Forecast 2025 to 2035
Assessing Direct-to-shape Inkjet Printer Market Share & Industry Trends
Digital Fabrication Inkjet Inks Market Size and Share Forecast Outlook 2025 to 2035
NCR Printers Market Size and Share Forecast Outlook 2025 to 2035

Thank you!
You will receive an email from our Business Development Manager. Please be sure to check your SPAM/JUNK folder too.
Chat With
MaRIA