Soft Magnetic Composite Market Forecast and Outlook 2025 to 2035

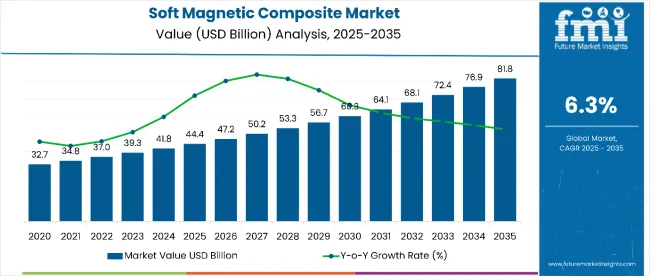
The global soft magnetic composite market is valued at USD 44.4 billion in 2025 and is slated to reach USD 81.9 billion by 2035, recording an absolute increase of USD 37.5 billion over the forecast period. This translates into a total growth of 84.5%, with the market forecast to expand at a compound annual growth rate (CAGR) of 6.3% between 2025 and 2035. The overall market size is expected to grow by nearly 1.8X during the same period, supported by increasing adoption of electric vehicles, rising demand for energy-efficient motors, and growing focus on renewable energy systems and industrial automation.
Quick Stats for Soft Magnetic Composite Market

  • Soft Magnetic Composite Market Value (2025): USD 44.4 billion
  • Soft Magnetic Composite Market Forecast Value (2035): USD 81.9 billion
  • Soft Magnetic Composite Market Forecast CAGR: 6.3%
  • Leading Material in Soft Magnetic Composite Market: Iron Powder (38.0%)
  • Key Growth Regions in Soft Magnetic Composite Market: North America, East Asia, and Europe
  • Key Players in Soft Magnetic Composite Market: Höganäs AB, Rio Tinto Metal Powders, Hitachi Metals Ltd., GKN Powder Metallurgy, Sumitomo Electric Industries, PMG Group, Carpenter Technology Corporation, Hitachi Chemical, Magnetec GmbH, HöferMetallTechnik GmbH

Soft Magnetic Composites Market

Soft Magnetic Composite Market Key Takeaways

Metric Value
Estimated Value in (2025E) USD 44.4 billion
Forecast Value in (2035F) USD 81.9 billion
Forecast CAGR (2025 to 2035) 6.3%

Between 2025 and 2030, the soft magnetic composite market is projected to expand from USD 44.4 billion to USD 61.2 billion, resulting in a value increase of USD 16.8 million, which represents 44.8% of the total forecast growth for the decade. This phase of growth will be shaped by rising adoption of electric vehicle technology, increasing demand for energy-efficient power systems, and growing penetration of renewable energy infrastructure in emerging markets. Manufacturing companies are expanding their soft magnetic composite product portfolios to address the growing demand for high-performance magnetic materials in automotive and industrial applications.

From 2030 to 2035, the market is forecast to grow from USD 61.2 billion to USD 81.9 billion, adding another USD 20.7 billion, which constitutes 55.2% of the overall ten-year expansion. This period is expected to be characterized by expansion of Industry 4.0 technologies, integration of advanced powder metallurgy systems in formulations, and development of next-generation magnetic materials. The growing adoption of smart manufacturing trends and AI-enabled design automation will drive demand for premium soft magnetic composites with enhanced efficiency and performance profiles.

Between 2020 and 2025, the soft magnetic composite market experienced robust expansion, driven by increasing focus on electrification initiatives and growing awareness of energy efficiency requirements. The market developed as manufacturers recognized the need for effective magnetic solutions to support electric vehicle adoption, renewable energy integration, and industrial automation concerns. Technological advancements and government policies began emphasizing the importance of soft magnetic composites in achieving energy efficiency goals and sustainable manufacturing practices.

Why is the Soft Magnetic Composite Market Growing?

Market expansion is being supported by the increasing adoption of electric vehicles and the corresponding demand for efficient magnetic materials in motor applications. Modern manufacturers are increasingly focused on energy-efficient solutions that can deliver superior electromagnetic performance, reduced core losses, and enhanced operational reliability. Soft magnetic composites' proven efficacy in providing low eddy current losses and supporting high-frequency operations makes them a preferred material in automotive and industrial applications.

The growing emphasis on renewable energy systems and smart grid technologies is driving demand for soft magnetic composites in transformer and inductor applications. Manufacturing preference for materials that combine magnetic efficiency with cost-effectiveness is creating opportunities for innovative formulations. The rising influence of Industry 4.0 technologies and automation trends is also contributing to increased product adoption across different industrial sectors and applications.

Segmental Analysis

The market is segmented by material, type, application, end use, and region. By material, the market is divided into electrical steel, soft ferrite, and iron powder. Based on type, the market is categorized into 1P, 3P, and 5P. In terms of application, the market is segmented into electrical coils, motors, generators, transformers, inductors, sensors, and others. By end use, the market is classified into automotive, industrial machinery and equipment, consumer goods, power generation, and others. Regionally, the market is divided into North America, Latin America, Western Europe, Eastern Europe, East Asia, South Asia Pacific, and Middle East & Africa.
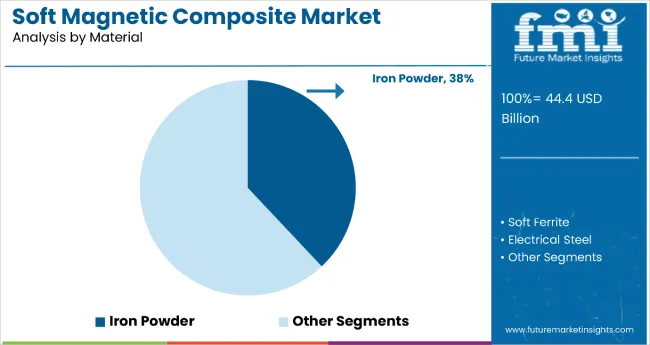
By Material, Iron Powder Segment Accounts for 38.0% Market Share

Soft Magnetic Composites Market Analysis By Material

The iron powder material segment is projected to account for 38.0% of the soft magnetic composite market in 2025, reaffirming its position as the category's leading material choice. Manufacturers increasingly understand the benefits of iron powder's widespread availability, cost-effectiveness, and favorable magnetic properties that make it highly suitable for electric motors, inductors, transformers, and magnetic cores across automotive and industrial applications.

This material forms the foundation of most product formulations, as it represents the most accessible and performance-reliable option for soft magnetic composite manufacturing. Engineering validation and ongoing cost optimization continue to strengthen adoption of iron powder formulations. With manufacturing processes becoming more sophisticated and quality requirements increasing, iron powder aligns with both performance and economic objectives. Its broad compatibility across applications ensures sustained dominance, making it the central growth driver of soft magnetic composite material demand.
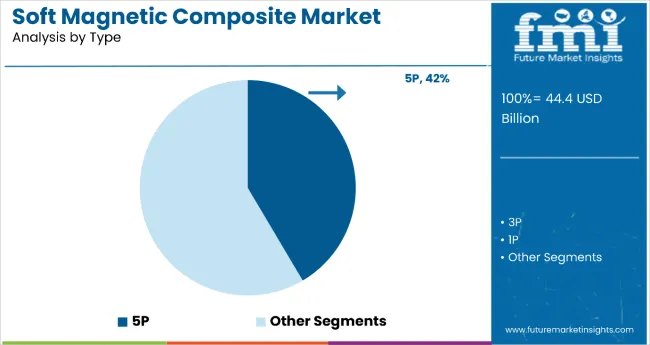
By Type, 5P Segment Accounts for 42% Market Share

Soft Magnetic Composites Market Analysis By Type

The 5P type segment is projected to represent 42% of soft magnetic composite demand in 2025, underscoring its role as the preferred type for high-performance magnetic applications. Manufacturers gravitate toward 5P composites for their superior performance characteristics, enhanced permeability, and minimal core losses that maximize the effectiveness of magnetic systems. Positioned as premium, advanced materials, 5P composites offer both operational benefits, such as improved thermal stability, and performance benefits, including enhanced magnetic efficiency.

The segment is supported by the rising adoption of next-generation electric propulsion systems and high-efficiency industrial equipment that require advanced magnetic materials. Additionally, manufacturers are increasingly combining 5P composites with complementary technologies and optimized designs, enhancing performance and justifying premium positioning. As engineering-focused customers prioritize efficiency and reliability, 5P-based soft magnetic composites will continue to dominate demand, reinforcing their advanced technology positioning within the magnetic materials market.

What are the Drivers, Restraints, and Key Trends of the Soft Magnetic Composite Market?

The soft magnetic composite market is advancing rapidly due to increasing adoption of electric vehicle technology and growing demand for energy-efficient magnetic materials. However, the market faces challenges including high manufacturing costs, raw material price volatility, and competition from alternative magnetic solutions. Innovation in powder metallurgy and Industry 4.0 integration continue to influence product development and market expansion patterns.

Advancements in Powder Metallurgy and Manufacturing Technologies

The growing adoption of advanced powder metallurgy techniques is enabling manufacturers to improve product quality and reduce production costs. Modern manufacturing processes offer enhanced control over material properties, improved consistency, and better performance characteristics. Advanced compaction and sintering technologies are driving efficiency gains and enabling development of next-generation soft magnetic composites with superior magnetic properties.

Integration with Industry 4.0 and Smart Manufacturing Systems

Modern soft magnetic composite manufacturers are incorporating Industry 4.0 technologies such as machine learning, robotics, and data analytics to enhance production control and reduce waste. These technologies improve manufacturing precision while extending operational efficiency and providing better user experience. Smart manufacturing integration also enables development of customized solutions that deliver multiple performance benefits in single applications.
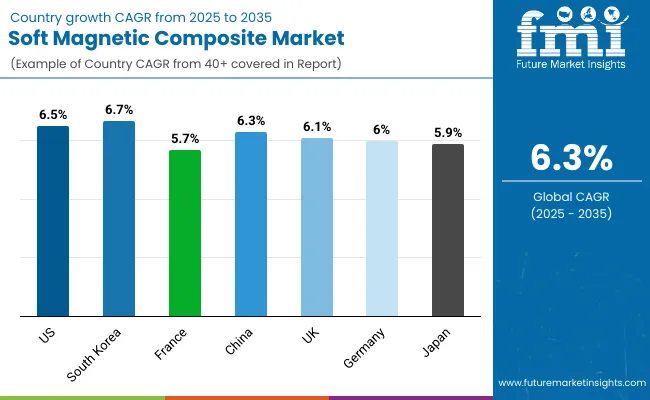
Analysis of Soft Magnetic Composite Market by Key Country

Country Wise Soft Magnetic Composites Market

Countries CAGR (2025 to 2035)
South Korea 6.7%
United States 6.5%
France 5.7%
United Kingdom 6.1%
Japan 5.9%
China 6.3%
Germany 6%

The soft magnetic composite market is experiencing robust growth globally, with South Korea leading at a 6.7% CAGR through 2035, driven by strong semiconductor and electronics industries, expanding electric vehicle sector, and government incentives supporting green technology investment. The United States follows closely at 6.5%, supported by increasing utilization of energy-efficient electric motors and government programs directed at energy-saving initiatives. The European Union shows steady growth at 6.4%, emphasizing environmental regulations and electric vehicle market leadership. The UK records 6.1%, focusing on renewable energy investment and automotive electrification. Japan shows growth at 5.9%, prioritizing advanced motor technology and consumer electronics applications.

The report covers an in-depth analysis of 40+ countries; five top-performing countries are highlighted below.

South Korea Leads Asian Market Growth with Technology Innovation

Revenue from soft magnetic composites in South Korea is projected to exhibit strong growth with a CAGR of 6.7% through 2035, driven by the country's strong automotive, consumer electronics, and semiconductor industries. The remarkable development of electric vehicle and renewable energy infrastructures, along with government benefits for green technologies, inflates the demand for advanced magnetic materials. Progress in nanocrystalline and amorphous magnetic materials has a substantial impact on market competitiveness.

  • Tech-driven market dynamics with strong semiconductor and electronics industries drive the need for precision magnetic components throughout major industrial regions.
  • Expanding electric vehicle sector and battery technology development increases demand for efficient, high-performance magnetic composites across automotive applications.

United States Focuses on Energy Efficiency and Electric Vehicle Applications

Demand for soft magnetic composites in the USA is projected to grow at a CAGR of 6.5%, supported by increased utilization of energy-efficient electric motors and transformers in the flourishing electric vehicle sector and renewable energy applications. Government programs directed at energy-saving initiatives and continuing developments in additive manufacturing processes are contributing to market growth. The transition from traditional to lightweight and high-tech materials in manufacturing of industrial and consumer electronics is another determining factor.

  • EV development expansion increases requirement for electric motors, leading more manufacturers to adopt soft magnetic composites in their vehicle models throughout production facilities.
  • Renewable energy power integration supports deployment of wind and solar power through SMC transformers and inductors for energy-efficient power conversion applications.

France Strengthens Market with Industrial Heritage and Innovation

Revenue from soft magnetic composites in France is projected to grow at a CAGR of 5.7% through 2035, supported by the country's strong industrial manufacturing heritage and growing investment in renewable energy systems. French manufacturers are increasingly focusing on sustainable technologies and advanced materials that support the transition to clean energy and electric mobility. The aerospace and defense sectors also contribute to demand for specialized magnetic materials.

  • Industrial manufacturing tradition with established expertise in advanced materials drives consistent demand for soft magnetic composites across diverse industrial sectors.
  • Renewable energy expansion with significant investment in wind and solar power creates opportunities for magnetic materials in power conversion and distribution systems.

United Kingdom Strengthens Market with Renewable Energy Investment

Revenue from soft magnetic composites in the UK is projected to grow at a CAGR of 6.1% through 2035, supported by financing in sustainable energies, electrification of transport, and developments in modern power electronics. Strong environmental pressure has created high demand for soft magnetic composites to replace inductors and motors in next-generation equipment for electric vehicles and wind energy applications.

  • Renewable energy investment in wind power and smart grids proves the need for soft magnetic composites in energy-efficient electrical applications throughout infrastructure development.
  • Automotive transformation with change to electric mobility creates demand for sophisticated magnetic components in electric vehicle motor applications.

Japan Anchors Growth with Advanced Manufacturing Excellence

Revenue from soft magnetic composites in Japan is projected to grow at a CAGR of 5.9% through 2035, supported by the nation's advanced manufacturing ecosystem and leadership in electric motor technology. The emphasis on miniaturization and high-efficiency power systems, especially for hybrid and electric vehicles, leads to increased demand for soft magnetic composites in automotive applications.

  • Advanced motor technology with Japan's supremacy in small, high-efficiency electric motors makes it feasible to adopt soft magnetic composites in electronics and electric vehicle applications.
  • Consumer electronics growth with miniaturized and energy-efficient power supplies in high demand pushes manufacturers to produce better-performing soft magnetic composites.

China Drives Manufacturing Excellence with Industrial Scale Production

Revenue from soft magnetic composites in China is projected to grow at a CAGR of 6.3% through 2035, driven by the country's massive manufacturing capabilities and rapid adoption of electric vehicle technology. China's position as a global manufacturing hub for electronics and automotive components creates substantial demand for high-performance magnetic materials. The government's strong commitment to green energy transition and electric mobility is accelerating market growth across industrial sectors.

  • Large-scale manufacturing capabilities enable cost-effective production of soft magnetic composites for domestic and international markets across diverse industrial applications.
  • Electric vehicle market leadership with world's largest EV market drives unprecedented demand for advanced magnetic materials in motor and power electronics applications.

Germany Maintains Leadership with Automotive Excellence

Revenue from soft magnetic composites in Germany is projected to grow at a CAGR of 6% through 2035, supported by the country's advanced automotive industry and sophisticated understanding of magnetic materials technology. German manufacturers consistently demand superior quality materials that deliver exceptional performance while maintaining strict engineering standards. The transition to electric mobility and Industry 4.0 integration is driving innovation in magnetic material applications.
  • Automotive industry leadership with premium vehicle manufacturers drives demand for high-performance soft magnetic composites in electric drive systems throughout production networks.
  • Engineering excellence tradition supports development of next-generation magnetic materials that meet stringent quality requirements for industrial and automotive applications.

Europe Market Split by Country

Europe Soft Magnetic Composites Market

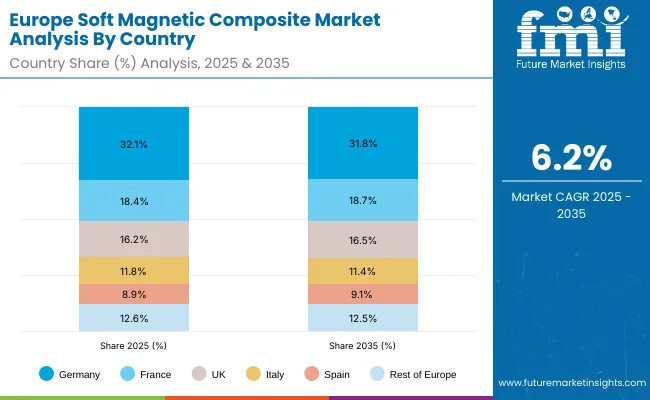
The soft magnetic composite market in Europe is projected to grow at a CAGR of 6.2% over the forecast period. Germany is expected to lead the region with 32.1% market share in 2025, moderating slightly to 31.8% by 2035, supported by its advanced automotive industry, sophisticated understanding of magnetic materials technology, and strong presence of major automotive manufacturers driving electric vehicle adoption.

France follows with 18.4% in 2025, rising to 18.7% by 2035, driven by its industrial manufacturing heritage, growing focus on renewable energy systems, and companies pioneering premium soft magnetic composite solutions. The United Kingdom accounts for 16.2% in 2025, edging to 16.5% by 2035 as clean energy technologies and electric vehicle development drive demand for high-performance soft magnetic composites. Italy holds 11.8% in 2025, easing to 11.4% by 2035, with growth concentrated in automotive electrification solutions and premium magnetic material applications.

Spain represents 8.9% in 2025, moving to 9.1% by 2035, supported by expanding automotive sector and renewable energy infrastructure development. The remainder of Europe (Nordic countries, BENELUX, Eastern Europe and other markets) collectively contributes 12.6% in 2025, adjusting to 12.5% by 2035, reflecting steady growth in advanced manufacturing technologies and expanding access to premium magnetic materials across diverse industrial sectors.
Competitive Landscape of Soft Magnetic Composite Market

Soft Magnetic Composites Market Analysis By Company

The soft magnetic composite market is characterized by competition among established materials manufacturers, specialty magnetic companies, and emerging technology providers. Companies are investing in advanced powder metallurgy technologies, sustainable manufacturing practices, premium product positioning, and strategic partnerships to deliver effective, reliable, and accessible magnetic material solutions. Material innovation, manufacturing efficiency, and application expansion are central to strengthening product portfolios and market presence.

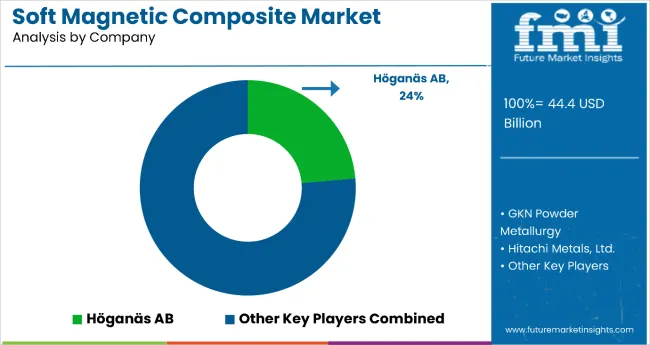
Höganäs AB leads the market with significant global presence, offering comprehensive soft magnetic composite solutions with focus on powder metallurgy expertise and industrial applications. Rio Tinto Metal Powders provides specialized magnetic materials with emphasis on high-quality metal powders and supply chain reliability. Hitachi Metals Ltd. delivers advanced magnetic solutions with focus on automotive and electronics applications. GKN Powder Metallurgy focuses on engineered materials that combine powder metallurgy expertise with application-specific performance.

Sumitomo Electric Industries and PMG Group, operating globally, provide comprehensive soft magnetic composite ranges across multiple industrial sectors and distribution channels. Carpenter Technology Corporation emphasizes specialty alloys and advanced materials with premium positioning. Hitachi Chemical offers technology-driven solutions with focus on performance optimization and application engineering. Magnetec GmbH and HöferMetallTechnik GmbH provide specialized magnetic materials with focus on European markets and custom applications.

Opportunity Pathways- Soft Magnetic Composite Market

The future looks powerful for soft magnetic composites. As sectors from automotive to industrial automation to renewable energy demand higher efficiency, lighter weight, and compact, high-frequency magnetic components, SMCs are being positioned as a core enabling material. Their advantages, including reduced eddy-current losses, isotropic magnetic behavior, flexible 3D design, good thermal profiles, align well with global decarbonization and electrification trends.

Pathways A through H represent eight critical drivers through which incremental value can be captured-whether by catering to the EV surge, pushing into power electronics, or innovating in material science and manufacturing.

  • Pathway A - EV / Electric Motor Penetration & Performance Upgrades. Electric vehicles demand motors that perform under tighter constraints: higher speeds, higher thermal loads, lighter weight, lower losses. Soft magnetic composites can enable stators/rotors optimized for those criteria. Expected revenue pool: USD 8-12 billion.
  • Pathway B - Power Electronics, Inverters & High-Frequency Applications. As renewables, smart grids, fast chargers, and industrial drives proliferate, there’s more need for magnetic components that operate efficiently at higher frequencies. SMCs are well suited here. Opportunity: USD 6-10 billion.
  • Pathway C - Miniaturization & Compact / 3D Designs. New device architectures (motors with 3D magnetic flux, embedded sensors, robotics etc.) demand form factors and magnetic behavior that traditional laminates can’t deliver. SMCs allow more design freedom. Pool: USD 4-7 billion.
  • Pathway D - Material & Process Innovation. Breakthroughs in powder metallurgy, new coatings, novel alloy compositions, additive manufacturing / 3D printing methods will reduce cost, improve thermal conductivity, reduce losses, and expand usable operating envelope. Revenue potential: USD 5-8 billion.
  • Pathway E - Renewable Energy & Grid Infrastructure. Transformers, inverters, wind turbine generators, solar power conversion - all benefit from more efficient magnetic materials. Government investment in renewables and grid modernization will support this uptake. Expected upside: USD 4-8 billion.
  • Pathway F - Sustainability & ESG Monetization. Use recycled iron powders, reduce need for rare materials, lower energy consumption in production, and develop lifecycle / carbon emissions credentials. Can unlock premium pricing / regulatory support. Pool: USD 3-5 billion.
  • Pathway G - Regional Expansion & Local Manufacturing. Asia-Pacific is already a high growth region (China, India, Japan etc.) due to EV & electronics demand. Localizing SMC production helps reduce cost, supply chain risk, and adapt materials to regional needs. USD 5-8 billion.
  • Pathway H - Regulatory & Efficiency Standards Push. Many jurisdictions are increasing efficiency standards for motors and industrial equipment; emissions / energy loss regulations; trade / subsidy policies favor efficient materials. This regulatory push will accelerate adoption. Revenue: USD 3-6 billion.

Key Players in the Soft Magnetic Composite Market

  • Höganäs AB
  • Rio Tinto Metal Powders
  • Hitachi Metals, Ltd.
  • GKN Powder Metallurgy
  • Sumitomo Electric Industries
  • PMG Group
  • Carpenter Technology Corporation
  • Hitachi Chemical
  • Magnetec GmbH
  • HöferMetall Technik GmbH

Scope of the Report

Items Values
Quantitative Units (2025) USD 44.4 billion
Material Electrical Steel, Soft Ferrite, Iron Powder
Type 1P, 3P, 5P
Application Electrical Coils, Motors, Generators, Transformers, Inductors, Sensors, Others
End Use Automotive, Industrial Machinery and Equipment, Consumer Goods, Power Generation, Others
Regions Covered North America, Latin America, Western Europe, Eastern Europe, East Asia, South Asia Pacific, Middle East and Africa
Countries Covered United States, Canada, United Kingdom, Germany, France, China, Japan, South Korea, India, Brazil, Australia and 40+ countries
Key Companies Profiled Höganäs AB, Rio Tinto Metal Powders, Hitachi Metals Ltd., GKN Powder Metallurgy, Sumitomo Electric Industries, PMG Group, Carpenter Technology Corporation, Hitachi Chemical, Magnetec GmbH, and Höfer Metall Technik GmbH
Additional Attributes Market driven by EV adoption, renewable energy expansion, and industrial automation; electrical steel segment analysis, regional demand trends, competitive landscape, technological innovations in powder metallurgy, integration with smart manufacturing, and sustainable material development practices

Soft Magnetic Composite Market by Segments

By Material:

  • Electrical Steel
  • Soft Ferrite
  • Iron Powder

By Type:

  • 1P
  • 3P
  • 5P

By Application:

  • Electrical Coils
  • Motors
  • Generators
  • Transformers
  • Inductors
  • Sensors
  • Others

By End Use:

  • Automotive
  • Industrial Machinery and Equipment
  • Consumer Goods
  • Power Generation
  • Others

By Region:

  • North America
    • United States
    • Canada
    • Mexico
  • Latin America
    • Brazil
    • Chile
    • Rest of Latin America
  • Western Europe
    • Germany
    • United Kingdom
    • France
    • Italy
    • Spain
    • Nordic
    • BENELUX
    • Rest of Western Europe
  • Eastern Europe
    • Russia
    • Poland
    • Rest of Eastern Europe
  • East Asia
    • China
    • Japan
    • South Korea
  • South Asia Pacific
    • India
    • ASEAN
    • Australia & New Zealand
    • Rest of South Asia Pacific
  • Middle East and Africa
    • Kingdom of Saudi Arabia
    • Other GCC Countries
    • Turkey
    • South Africa
    • Other African Union
    • Rest of Middle East & Africa

Frequently Asked Questions

What is the estimated market size of the global soft magnetic composite market for 2025?

The global market is projected to reach USD 44.4 billion by the end of 2025.

What is the anticipated market expansion rate for soft magnetic composites through 2035?

The market is anticipated to grow at a CAGR of 6.3% over the forecast period.

What is the projected soft magnetic composite market worth by 2035?

By 2035, the market is expected to reach USD 81.9 billion.

Which segment is expected to dominate the soft magnetic composite market?

The electrical steel segment is expected to dominate the market due to its high magnetic permeability, low core losses, and critical role in enhancing efficiency across motors, transformers, and generators.

Which are the key players in the soft magnetic composite market?

Key players in the soft magnetic composite market include Höganäs AB, Rio Tinto Metal Powders, Hitachi Metals, Ltd., GKN Powder Metallurgy, Sumitomo Electric Industries.

Table of Content

  1. Executive Summary
  2. Industry Introduction, including Taxonomy and Market Definition
  3. Market Trends and Success Factors, including Macro-economic Factors, Market Dynamics, and Recent Industry Developments
  4. Global Market Demand Analysis 2020 to 2024 and Forecast 2025 to 2035, including Historical Analysis and Future Projections
  5. Pricing Analysis
  6. Global Market Analysis 2020 to 2024 and Forecast 2025 to 2035
    • Material
    • Type
    • Application
    • End Use
  7. Global Market Analysis 2020 to 2024 and Forecast 2025 to 2035, By Material
    • Electrical Steel
    • Soft Ferrite
    • Iron Powder
  8. Global Market Analysis 2020 to 2024 and Forecast 2025 to 2035, By Type
    • 1P
    • 3P
    • 5P
  9. Global Market Analysis 2020 to 2024 and Forecast 2025 to 2035, By Application
    • Electrical Coils
    • Motors
    • Generators
    • Transformers
    • Inductors
    • Sensors
    • Others
  10. Global Market Analysis 2020 to 2024 and Forecast 2025 to 2035, By End Use
    • Automotive
    • Industrial Machinery and Equipment
    • Consumer Goods
    • Power Generation
    • Others
  11. Global Market Analysis 2020 to 2024 and Forecast 2025 to 2035, By Region
    • North America
    • Latin America
    • Western Europe
    • Eastern Europe
    • East Asia
    • South Asia Pacific
    • Middle East and Africa
  12. North America Sales Analysis 2020 to 2024 and Forecast 2025 to 2035, by Key Segments and Countries
  13. Latin America Sales Analysis 2020 to 2024 and Forecast 2025 to 2035, by Key Segments and Countries
  14. Western Europe Sales Analysis 2020 to 2024 and Forecast 2025 to 2035, by Key Segments and Countries
  15. Eastern Europe Sales Analysis 2020 to 2024 and Forecast 2025 to 2035, by Key Segments and Countries
  16. East Asia Sales Analysis 2020 to 2024 and Forecast 2025 to 2035, by Key Segments and Countries
  17. South Asia Pacific Sales Analysis 2020 to 2024 and Forecast 2025 to 2035, by Key Segments and Countries
  18. Middle East and Africa Sales Analysis 2020 to 2024 and Forecast 2025 to 2035, by Key Segments and Countries
  19. Sales Forecast 2025 to 2035 by Material, Type, Application, and End Use for 30 Countries
  20. Competition Outlook, including Market Structure Analysis, Company Share Analysis by Key Players, and Competition Dashboard
  21. Company Profile
    • Höganäs AB
    • Rio Tinto Metal Powders
    • Hitachi Metals, Ltd.
    • GKN Powder Metallurgy
    • Sumitomo Electric Industries
    • PMG Group
    • Carpenter Technology Corporation
    • Hitachi Chemical
    • Magnetec GmbH
    • Höfer Metall Technik GmbH
    • Other Major Players

List of Tables

  • Table 1: Global Market Value (USD Billion) Forecast by Region, 2020-2035
  • Table 2: Global Market Volume (Units) Forecast by Region, 2020-2035
  • Table 3: Global Market Value (USD Billion) Forecast by Material, 2020-2035
  • Table 4: Global Market Volume (Units) Forecast by Material, 2020-2035
  • Table 5: Global Market Value (USD Billion) Forecast by Type, 2020-2035
  • Table 6: Global Market Volume (Units) Forecast by Type, 2020-2035
  • Table 7: Global Market Value (USD Billion) Forecast by Application, 2020-2035
  • Table 8: Global Market Volume (Units) Forecast by Application, 2020-2035
  • Table 9: Global Market Value (USD Billion) Forecast by End Use, 2020-2035
  • Table 10: Global Market Volume (Units) Forecast by End Use, 2020-2035
  • Table 11: North America Market Value (USD Billion) Forecast by Country, 2020-2035
  • Table 12: North America Market Volume (Units) Forecast by Country, 2020-2035
  • Table 13: North America Market Value (USD Billion) Forecast by Material, 2020-2035
  • Table 14: North America Market Volume (Units) Forecast by Material, 2020-2035
  • Table 15: North America Market Value (USD Billion) Forecast by Type, 2020-2035
  • Table 16: North America Market Volume (Units) Forecast by Type, 2020-2035
  • Table 17: North America Market Value (USD Billion) Forecast by Application, 2020-2035
  • Table 18: North America Market Volume (Units) Forecast by Application, 2020-2035
  • Table 19: North America Market Value (USD Billion) Forecast by End Use, 2020-2035
  • Table 20: North America Market Volume (Units) Forecast by End Use, 2020-2035
  • Table 21: Latin America Market Value (USD Billion) Forecast by Country, 2020-2035
  • Table 22: Latin America Market Volume (Units) Forecast by Country, 2020-2035
  • Table 23: Latin America Market Value (USD Billion) Forecast by Material, 2020-2035
  • Table 24: Latin America Market Volume (Units) Forecast by Material, 2020-2035
  • Table 25: Latin America Market Value (USD Billion) Forecast by Type, 2020-2035
  • Table 26: Latin America Market Volume (Units) Forecast by Type, 2020-2035
  • Table 27: Latin America Market Value (USD Billion) Forecast by Application, 2020-2035
  • Table 28: Latin America Market Volume (Units) Forecast by Application, 2020-2035
  • Table 29: Latin America Market Value (USD Billion) Forecast by End Use, 2020-2035
  • Table 30: Latin America Market Volume (Units) Forecast by End Use, 2020-2035
  • Table 31: East Asia Market Value (USD Billion) Forecast by Country, 2020-2035
  • Table 32: East Asia Market Volume (Units) Forecast by Country, 2020-2035
  • Table 33: East Asia Market Value (USD Billion) Forecast by Material, 2020-2035
  • Table 34: East Asia Market Volume (Units) Forecast by Material, 2020-2035
  • Table 35: East Asia Market Value (USD Billion) Forecast by Type, 2020-2035
  • Table 36: East Asia Market Volume (Units) Forecast by Type, 2020-2035
  • Table 37: East Asia Market Value (USD Billion) Forecast by Application, 2020-2035
  • Table 38: East Asia Market Volume (Units) Forecast by Application, 2020-2035
  • Table 39: East Asia Market Value (USD Billion) Forecast by End Use, 2020-2035
  • Table 40: East Asia Market Volume (Units) Forecast by End Use, 2020-2035
  • Table 41: South Asia & Pacific Market Value (USD Billion) Forecast by Country, 2020-2035
  • Table 42: South Asia & Pacific Market Volume (Units) Forecast by Country, 2020-2035
  • Table 43: South Asia & Pacific Market Value (USD Billion) Forecast by Material, 2020-2035
  • Table 44: South Asia & Pacific Market Volume (Units) Forecast by Material, 2020-2035
  • Table 45: South Asia & Pacific Market Value (USD Billion) Forecast by Type, 2020-2035
  • Table 46: South Asia & Pacific Market Volume (Units) Forecast by Type, 2020-2035
  • Table 47: South Asia & Pacific Market Value (USD Billion) Forecast by Application, 2020-2035
  • Table 48: South Asia & Pacific Market Volume (Units) Forecast by Application, 2020-2035
  • Table 49: South Asia & Pacific Market Value (USD Billion) Forecast by End Use, 2020-2035
  • Table 50: South Asia & Pacific Market Volume (Units) Forecast by End Use, 2020-2035
  • Table 51: Western Europe Market Value (USD Billion) Forecast by Country, 2020-2035
  • Table 52: Western Europe Market Volume (Units) Forecast by Country, 2020-2035
  • Table 53: Western Europe Market Value (USD Billion) Forecast by Material, 2020-2035
  • Table 54: Western Europe Market Volume (Units) Forecast by Material, 2020-2035
  • Table 55: Western Europe Market Value (USD Billion) Forecast by Type, 2020-2035
  • Table 56: Western Europe Market Volume (Units) Forecast by Type, 2020-2035
  • Table 57: Western Europe Market Value (USD Billion) Forecast by Application, 2020-2035
  • Table 58: Western Europe Market Volume (Units) Forecast by Application, 2020-2035
  • Table 59: Western Europe Market Value (USD Billion) Forecast by End Use, 2020-2035
  • Table 60: Western Europe Market Volume (Units) Forecast by End Use, 2020-2035
  • Table 61: Eastern Europe Market Value (USD Billion) Forecast by Country, 2020-2035
  • Table 62: Eastern Europe Market Volume (Units) Forecast by Country, 2020-2035
  • Table 63: Eastern Europe Market Value (USD Billion) Forecast by Material, 2020-2035
  • Table 64: Eastern Europe Market Volume (Units) Forecast by Material, 2020-2035
  • Table 65: Eastern Europe Market Value (USD Billion) Forecast by Type, 2020-2035
  • Table 66: Eastern Europe Market Volume (Units) Forecast by Type, 2020-2035
  • Table 67: Eastern Europe Market Value (USD Billion) Forecast by Application, 2020-2035
  • Table 68: Eastern Europe Market Volume (Units) Forecast by Application, 2020-2035
  • Table 69: Eastern Europe Market Value (USD Billion) Forecast by End Use, 2020-2035
  • Table 70: Eastern Europe Market Volume (Units) Forecast by End Use, 2020-2035
  • Table 71: Middle East & Africa Market Value (USD Billion) Forecast by Country, 2020-2035
  • Table 72: Middle East & Africa Market Volume (Units) Forecast by Country, 2020-2035
  • Table 73: Middle East & Africa Market Value (USD Billion) Forecast by Material, 2020-2035
  • Table 74: Middle East & Africa Market Volume (Units) Forecast by Material, 2020-2035
  • Table 75: Middle East & Africa Market Value (USD Billion) Forecast by Type, 2020-2035
  • Table 76: Middle East & Africa Market Volume (Units) Forecast by Type, 2020-2035
  • Table 77: Middle East & Africa Market Value (USD Billion) Forecast by Application, 2020-2035
  • Table 78: Middle East & Africa Market Volume (Units) Forecast by Application, 2020-2035
  • Table 79: Middle East & Africa Market Value (USD Billion) Forecast by End Use, 2020-2035
  • Table 80: Middle East & Africa Market Volume (Units) Forecast by End Use, 2020-2035
  • Table 81: U.S. Market Value (USD Billion) Forecast by Material, 2020-2035
  • Table 82: U.S. Market Volume (Units) Forecast by Material, 2020-2035
  • Table 83: U.S. Market Value (USD Billion) Forecast by Type, 2020-2035
  • Table 84: U.S. Market Volume (Units) Forecast by Type, 2020-2035
  • Table 85: U.S. Market Value (USD Billion) Forecast by Application, 2020-2035
  • Table 86: U.S. Market Volume (Units) Forecast by Application, 2020-2035
  • Table 87: U.S. Market Value (USD Billion) Forecast by End Use, 2020-2035
  • Table 88: U.S. Market Volume (Units) Forecast by End Use, 2020-2035
  • Table 89: Canada Market Value (USD Billion) Forecast by Material, 2020-2035
  • Table 90: Canada Market Volume (Units) Forecast by Material, 2020-2035
  • Table 91: Canada Market Value (USD Billion) Forecast by Type, 2020-2035
  • Table 92: Canada Market Volume (Units) Forecast by Type, 2020-2035
  • Table 93: Canada Market Value (USD Billion) Forecast by Application, 2020-2035
  • Table 94: Canada Market Volume (Units) Forecast by Application, 2020-2035
  • Table 95: Canada Market Value (USD Billion) Forecast by End Use, 2020-2035
  • Table 96: Canada Market Volume (Units) Forecast by End Use, 2020-2035
  • Table 97: Mexico Market Value (USD Billion) Forecast by Material, 2020-2035
  • Table 98: Mexico Market Volume (Units) Forecast by Material, 2020-2035
  • Table 99: Mexico Market Value (USD Billion) Forecast by Type, 2020-2035
  • Table 100: Mexico Market Volume (Units) Forecast by Type, 2020-2035
  • Table 101: Mexico Market Value (USD Billion) Forecast by Application, 2020-2035
  • Table 102: Mexico Market Volume (Units) Forecast by Application, 2020-2035
  • Table 103: Mexico Market Value (USD Billion) Forecast by End Use, 2020-2035
  • Table 104: Mexico Market Volume (Units) Forecast by End Use, 2020-2035
  • Table 105: Brazil Market Value (USD Billion) Forecast by Material, 2020-2035
  • Table 106: Brazil Market Volume (Units) Forecast by Material, 2020-2035
  • Table 107: Brazil Market Value (USD Billion) Forecast by Type, 2020-2035
  • Table 108: Brazil Market Volume (Units) Forecast by Type, 2020-2035
  • Table 109: Brazil Market Value (USD Billion) Forecast by Application, 2020-2035
  • Table 110: Brazil Market Volume (Units) Forecast by Application, 2020-2035
  • Table 111: Brazil Market Value (USD Billion) Forecast by End Use, 2020-2035
  • Table 112: Brazil Market Volume (Units) Forecast by End Use, 2020-2035
  • Table 113: Argentina Market Value (USD Billion) Forecast by Material, 2020-2035
  • Table 114: Argentina Market Volume (Units) Forecast by Material, 2020-2035
  • Table 115: Argentina Market Value (USD Billion) Forecast by Type, 2020-2035
  • Table 116: Argentina Market Volume (Units) Forecast by Type, 2020-2035
  • Table 117: Argentina Market Value (USD Billion) Forecast by Application, 2020-2035
  • Table 118: Argentina Market Volume (Units) Forecast by Application, 2020-2035
  • Table 119: Argentina Market Value (USD Billion) Forecast by End Use, 2020-2035
  • Table 120: Argentina Market Volume (Units) Forecast by End Use, 2020-2035
  • Table 121: China Market Value (USD Billion) Forecast by Material, 2020-2035
  • Table 122: China Market Volume (Units) Forecast by Material, 2020-2035
  • Table 123: China Market Value (USD Billion) Forecast by Type, 2020-2035
  • Table 124: China Market Volume (Units) Forecast by Type, 2020-2035
  • Table 125: China Market Value (USD Billion) Forecast by Application, 2020-2035
  • Table 126: China Market Volume (Units) Forecast by Application, 2020-2035
  • Table 127: China Market Value (USD Billion) Forecast by End Use, 2020-2035
  • Table 128: China Market Volume (Units) Forecast by End Use, 2020-2035
  • Table 129: Japan Market Value (USD Billion) Forecast by Material, 2020-2035
  • Table 130: Japan Market Volume (Units) Forecast by Material, 2020-2035
  • Table 131: Japan Market Value (USD Billion) Forecast by Type, 2020-2035
  • Table 132: Japan Market Volume (Units) Forecast by Type, 2020-2035
  • Table 133: Japan Market Value (USD Billion) Forecast by Application, 2020-2035
  • Table 134: Japan Market Volume (Units) Forecast by Application, 2020-2035
  • Table 135: Japan Market Value (USD Billion) Forecast by End Use, 2020-2035
  • Table 136: Japan Market Volume (Units) Forecast by End Use, 2020-2035
  • Table 137: South Korea Market Value (USD Billion) Forecast by Material, 2020-2035
  • Table 138: South Korea Market Volume (Units) Forecast by Material, 2020-2035
  • Table 139: South Korea Market Value (USD Billion) Forecast by Type, 2020-2035
  • Table 140: South Korea Market Volume (Units) Forecast by Type, 2020-2035
  • Table 141: South Korea Market Value (USD Billion) Forecast by Application, 2020-2035
  • Table 142: South Korea Market Volume (Units) Forecast by Application, 2020-2035
  • Table 143: South Korea Market Value (USD Billion) Forecast by End Use, 2020-2035
  • Table 144: South Korea Market Volume (Units) Forecast by End Use, 2020-2035
  • Table 145: India Market Value (USD Billion) Forecast by Material, 2020-2035
  • Table 146: India Market Volume (Units) Forecast by Material, 2020-2035
  • Table 147: India Market Value (USD Billion) Forecast by Type, 2020-2035
  • Table 148: India Market Volume (Units) Forecast by Type, 2020-2035
  • Table 149: India Market Value (USD Billion) Forecast by Application, 2020-2035
  • Table 150: India Market Volume (Units) Forecast by Application, 2020-2035
  • Table 151: India Market Value (USD Billion) Forecast by End Use, 2020-2035
  • Table 152: India Market Volume (Units) Forecast by End Use, 2020-2035
  • Table 153: ASEAN Countries Market Value (USD Billion) Forecast by Material, 2020-2035
  • Table 154: ASEAN Countries Market Volume (Units) Forecast by Material, 2020-2035
  • Table 155: ASEAN Countries Market Value (USD Billion) Forecast by Type, 2020-2035
  • Table 156: ASEAN Countries Market Volume (Units) Forecast by Type, 2020-2035
  • Table 157: ASEAN Countries Market Value (USD Billion) Forecast by Application, 2020-2035
  • Table 158: ASEAN Countries Market Volume (Units) Forecast by Application, 2020-2035
  • Table 159: ASEAN Countries Market Value (USD Billion) Forecast by End Use, 2020-2035
  • Table 160: ASEAN Countries Market Volume (Units) Forecast by End Use, 2020-2035
  • Table 161: Australia & New Zealand Market Value (USD Billion) Forecast by Material, 2020-2035
  • Table 162: Australia & New Zealand Market Volume (Units) Forecast by Material, 2020-2035
  • Table 163: Australia & New Zealand Market Value (USD Billion) Forecast by Type, 2020-2035
  • Table 164: Australia & New Zealand Market Volume (Units) Forecast by Type, 2020-2035
  • Table 165: Australia & New Zealand Market Value (USD Billion) Forecast by Application, 2020-2035
  • Table 166: Australia & New Zealand Market Volume (Units) Forecast by Application, 2020-2035
  • Table 167: Australia & New Zealand Market Value (USD Billion) Forecast by End Use, 2020-2035
  • Table 168: Australia & New Zealand Market Volume (Units) Forecast by End Use, 2020-2035
  • Table 169: Germany Market Value (USD Billion) Forecast by Material, 2020-2035
  • Table 170: Germany Market Volume (Units) Forecast by Material, 2020-2035
  • Table 171: Germany Market Value (USD Billion) Forecast by Type, 2020-2035
  • Table 172: Germany Market Volume (Units) Forecast by Type, 2020-2035
  • Table 173: Germany Market Value (USD Billion) Forecast by Application, 2020-2035
  • Table 174: Germany Market Volume (Units) Forecast by Application, 2020-2035
  • Table 175: Germany Market Value (USD Billion) Forecast by End Use, 2020-2035
  • Table 176: Germany Market Volume (Units) Forecast by End Use, 2020-2035
  • Table 177: U.K. Market Value (USD Billion) Forecast by Material, 2020-2035
  • Table 178: U.K. Market Volume (Units) Forecast by Material, 2020-2035
  • Table 179: U.K. Market Value (USD Billion) Forecast by Type, 2020-2035
  • Table 180: U.K. Market Volume (Units) Forecast by Type, 2020-2035
  • Table 181: U.K. Market Value (USD Billion) Forecast by Application, 2020-2035
  • Table 182: U.K. Market Volume (Units) Forecast by Application, 2020-2035
  • Table 183: U.K. Market Value (USD Billion) Forecast by End Use, 2020-2035
  • Table 184: U.K. Market Volume (Units) Forecast by End Use, 2020-2035
  • Table 185: France Market Value (USD Billion) Forecast by Material, 2020-2035
  • Table 186: France Market Volume (Units) Forecast by Material, 2020-2035
  • Table 187: France Market Value (USD Billion) Forecast by Type, 2020-2035
  • Table 188: France Market Volume (Units) Forecast by Type, 2020-2035
  • Table 189: France Market Value (USD Billion) Forecast by Application, 2020-2035
  • Table 190: France Market Volume (Units) Forecast by Application, 2020-2035
  • Table 191: France Market Value (USD Billion) Forecast by End Use, 2020-2035
  • Table 192: France Market Volume (Units) Forecast by End Use, 2020-2035
  • Table 193: Italy Market Value (USD Billion) Forecast by Material, 2020-2035
  • Table 194: Italy Market Volume (Units) Forecast by Material, 2020-2035
  • Table 195: Italy Market Value (USD Billion) Forecast by Type, 2020-2035
  • Table 196: Italy Market Volume (Units) Forecast by Type, 2020-2035
  • Table 197: Italy Market Value (USD Billion) Forecast by Application, 2020-2035
  • Table 198: Italy Market Volume (Units) Forecast by Application, 2020-2035
  • Table 199: Italy Market Value (USD Billion) Forecast by End Use, 2020-2035
  • Table 200: Italy Market Volume (Units) Forecast by End Use, 2020-2035

List of Figures

  • Figure 1: Global Market Value (USD Billion) by Material, 2025-2035
  • Figure 2: Global Market Value (USD Billion) by Type, 2025-2035
  • Figure 3: Global Market Value (USD Billion) by Application, 2025-2035
  • Figure 4: Global Market Value (USD Billion) by End Use, 2025-2035
  • Figure 5: Global Market Value (USD Billion) by Region, 2025-2035
  • Figure 6: Global Market Value (USD Billion) Analysis by Region, 2020-2035
  • Figure 7: Global Market Volume (Units) Analysis by Region, 2020-2035
  • Figure 8: Global Market Value Share (%) and BPS Analysis by Region, 2025-2035
  • Figure 9: Global Market Y-o-Y Growth (%) Projections by Region, 2025-2035
  • Figure 10: Global Market Value (USD Billion) Analysis by Material, 2020-2035
  • Figure 11: Global Market Volume (Units) Analysis by Material, 2020-2035
  • Figure 12: Global Market Value Share (%) and BPS Analysis by Material, 2025-2035
  • Figure 13: Global Market Y-o-Y Growth (%) Projections by Material, 2025-2035
  • Figure 14: Global Market Value (USD Billion) Analysis by Type, 2020-2035
  • Figure 15: Global Market Volume (Units) Analysis by Type, 2020-2035
  • Figure 16: Global Market Value Share (%) and BPS Analysis by Type, 2025-2035
  • Figure 17: Global Market Y-o-Y Growth (%) Projections by Type, 2025-2035
  • Figure 18: Global Market Value (USD Billion) Analysis by Application, 2020-2035
  • Figure 19: Global Market Volume (Units) Analysis by Application, 2020-2035
  • Figure 20: Global Market Value Share (%) and BPS Analysis by Application, 2025-2035
  • Figure 21: Global Market Y-o-Y Growth (%) Projections by Application, 2025-2035
  • Figure 22: Global Market Value (USD Billion) Analysis by End Use, 2020-2035
  • Figure 23: Global Market Volume (Units) Analysis by End Use, 2020-2035
  • Figure 24: Global Market Value Share (%) and BPS Analysis by End Use, 2025-2035
  • Figure 25: Global Market Y-o-Y Growth (%) Projections by End Use, 2025-2035
  • Figure 26: Global Market Attractiveness by Material, 2025-2035
  • Figure 27: Global Market Attractiveness by Type, 2025-2035
  • Figure 28: Global Market Attractiveness by Application, 2025-2035
  • Figure 29: Global Market Attractiveness by End Use, 2025-2035
  • Figure 30: Global Market Attractiveness by Region, 2025-2035
  • Figure 31: North America Market Value (USD Billion) by Material, 2025-2035
  • Figure 32: North America Market Value (USD Billion) by Type, 2025-2035
  • Figure 33: North America Market Value (USD Billion) by Application, 2025-2035
  • Figure 34: North America Market Value (USD Billion) by End Use, 2025-2035
  • Figure 35: North America Market Value (USD Billion) by Country, 2025-2035
  • Figure 36: North America Market Value (USD Billion) Analysis by Country, 2020-2035
  • Figure 37: North America Market Volume (Units) Analysis by Country, 2020-2035
  • Figure 38: North America Market Value Share (%) and BPS Analysis by Country, 2025-2035
  • Figure 39: North America Market Y-o-Y Growth (%) Projections by Country, 2025-2035
  • Figure 40: North America Market Value (USD Billion) Analysis by Material, 2020-2035
  • Figure 41: North America Market Volume (Units) Analysis by Material, 2020-2035
  • Figure 42: North America Market Value Share (%) and BPS Analysis by Material, 2025-2035
  • Figure 43: North America Market Y-o-Y Growth (%) Projections by Material, 2025-2035
  • Figure 44: North America Market Value (USD Billion) Analysis by Type, 2020-2035
  • Figure 45: North America Market Volume (Units) Analysis by Type, 2020-2035
  • Figure 46: North America Market Value Share (%) and BPS Analysis by Type, 2025-2035
  • Figure 47: North America Market Y-o-Y Growth (%) Projections by Type, 2025-2035
  • Figure 48: North America Market Value (USD Billion) Analysis by Application, 2020-2035
  • Figure 49: North America Market Volume (Units) Analysis by Application, 2020-2035
  • Figure 50: North America Market Value Share (%) and BPS Analysis by Application, 2025-2035
  • Figure 51: North America Market Y-o-Y Growth (%) Projections by Application, 2025-2035
  • Figure 52: North America Market Value (USD Billion) Analysis by End Use, 2020-2035
  • Figure 53: North America Market Volume (Units) Analysis by End Use, 2020-2035
  • Figure 54: North America Market Value Share (%) and BPS Analysis by End Use, 2025-2035
  • Figure 55: North America Market Y-o-Y Growth (%) Projections by End Use, 2025-2035
  • Figure 56: North America Market Attractiveness by Material, 2025-2035
  • Figure 57: North America Market Attractiveness by Type, 2025-2035
  • Figure 58: North America Market Attractiveness by Application, 2025-2035
  • Figure 59: North America Market Attractiveness by End Use, 2025-2035
  • Figure 60: North America Market Attractiveness by Country, 2025-2035
  • Figure 61: Latin America Market Value (USD Billion) by Material, 2025-2035
  • Figure 62: Latin America Market Value (USD Billion) by Type, 2025-2035
  • Figure 63: Latin America Market Value (USD Billion) by Application, 2025-2035
  • Figure 64: Latin America Market Value (USD Billion) by End Use, 2025-2035
  • Figure 65: Latin America Market Value (USD Billion) by Country, 2025-2035
  • Figure 66: Latin America Market Value (USD Billion) Analysis by Country, 2020-2035
  • Figure 67: Latin America Market Volume (Units) Analysis by Country, 2020-2035
  • Figure 68: Latin America Market Value Share (%) and BPS Analysis by Country, 2025-2035
  • Figure 69: Latin America Market Y-o-Y Growth (%) Projections by Country, 2025-2035
  • Figure 70: Latin America Market Value (USD Billion) Analysis by Material, 2020-2035
  • Figure 71: Latin America Market Volume (Units) Analysis by Material, 2020-2035
  • Figure 72: Latin America Market Value Share (%) and BPS Analysis by Material, 2025-2035
  • Figure 73: Latin America Market Y-o-Y Growth (%) Projections by Material, 2025-2035
  • Figure 74: Latin America Market Value (USD Billion) Analysis by Type, 2020-2035
  • Figure 75: Latin America Market Volume (Units) Analysis by Type, 2020-2035
  • Figure 76: Latin America Market Value Share (%) and BPS Analysis by Type, 2025-2035
  • Figure 77: Latin America Market Y-o-Y Growth (%) Projections by Type, 2025-2035
  • Figure 78: Latin America Market Value (USD Billion) Analysis by Application, 2020-2035
  • Figure 79: Latin America Market Volume (Units) Analysis by Application, 2020-2035
  • Figure 80: Latin America Market Value Share (%) and BPS Analysis by Application, 2025-2035
  • Figure 81: Latin America Market Y-o-Y Growth (%) Projections by Application, 2025-2035
  • Figure 82: Latin America Market Value (USD Billion) Analysis by End Use, 2020-2035
  • Figure 83: Latin America Market Volume (Units) Analysis by End Use, 2020-2035
  • Figure 84: Latin America Market Value Share (%) and BPS Analysis by End Use, 2025-2035
  • Figure 85: Latin America Market Y-o-Y Growth (%) Projections by End Use, 2025-2035
  • Figure 86: Latin America Market Attractiveness by Material, 2025-2035
  • Figure 87: Latin America Market Attractiveness by Type, 2025-2035
  • Figure 88: Latin America Market Attractiveness by Application, 2025-2035
  • Figure 89: Latin America Market Attractiveness by End Use, 2025-2035
  • Figure 90: Latin America Market Attractiveness by Country, 2025-2035
  • Figure 91: East Asia Market Value (USD Billion) by Material, 2025-2035
  • Figure 92: East Asia Market Value (USD Billion) by Type, 2025-2035
  • Figure 93: East Asia Market Value (USD Billion) by Application, 2025-2035
  • Figure 94: East Asia Market Value (USD Billion) by End Use, 2025-2035
  • Figure 95: East Asia Market Value (USD Billion) by Country, 2025-2035
  • Figure 96: East Asia Market Value (USD Billion) Analysis by Country, 2020-2035
  • Figure 97: East Asia Market Volume (Units) Analysis by Country, 2020-2035
  • Figure 98: East Asia Market Value Share (%) and BPS Analysis by Country, 2025-2035
  • Figure 99: East Asia Market Y-o-Y Growth (%) Projections by Country, 2025-2035
  • Figure 100: East Asia Market Value (USD Billion) Analysis by Material, 2020-2035
  • Figure 101: East Asia Market Volume (Units) Analysis by Material, 2020-2035
  • Figure 102: East Asia Market Value Share (%) and BPS Analysis by Material, 2025-2035
  • Figure 103: East Asia Market Y-o-Y Growth (%) Projections by Material, 2025-2035
  • Figure 104: East Asia Market Value (USD Billion) Analysis by Type, 2020-2035
  • Figure 105: East Asia Market Volume (Units) Analysis by Type, 2020-2035
  • Figure 106: East Asia Market Value Share (%) and BPS Analysis by Type, 2025-2035
  • Figure 107: East Asia Market Y-o-Y Growth (%) Projections by Type, 2025-2035
  • Figure 108: East Asia Market Value (USD Billion) Analysis by Application, 2020-2035
  • Figure 109: East Asia Market Volume (Units) Analysis by Application, 2020-2035
  • Figure 110: East Asia Market Value Share (%) and BPS Analysis by Application, 2025-2035
  • Figure 111: East Asia Market Y-o-Y Growth (%) Projections by Application, 2025-2035
  • Figure 112: East Asia Market Value (USD Billion) Analysis by End Use, 2020-2035
  • Figure 113: East Asia Market Volume (Units) Analysis by End Use, 2020-2035
  • Figure 114: East Asia Market Value Share (%) and BPS Analysis by End Use, 2025-2035
  • Figure 115: East Asia Market Y-o-Y Growth (%) Projections by End Use, 2025-2035
  • Figure 116: East Asia Market Attractiveness by Material, 2025-2035
  • Figure 117: East Asia Market Attractiveness by Type, 2025-2035
  • Figure 118: East Asia Market Attractiveness by Application, 2025-2035
  • Figure 119: East Asia Market Attractiveness by End Use, 2025-2035
  • Figure 120: East Asia Market Attractiveness by Country, 2025-2035
  • Figure 121: South Asia & Pacific Market Value (USD Billion) by Material, 2025-2035
  • Figure 122: South Asia & Pacific Market Value (USD Billion) by Type, 2025-2035
  • Figure 123: South Asia & Pacific Market Value (USD Billion) by Application, 2025-2035
  • Figure 124: South Asia & Pacific Market Value (USD Billion) by End Use, 2025-2035
  • Figure 125: South Asia & Pacific Market Value (USD Billion) by Country, 2025-2035
  • Figure 126: South Asia & Pacific Market Value (USD Billion) Analysis by Country, 2020-2035
  • Figure 127: South Asia & Pacific Market Volume (Units) Analysis by Country, 2020-2035
  • Figure 128: South Asia & Pacific Market Value Share (%) and BPS Analysis by Country, 2025-2035
  • Figure 129: South Asia & Pacific Market Y-o-Y Growth (%) Projections by Country, 2025-2035
  • Figure 130: South Asia & Pacific Market Value (USD Billion) Analysis by Material, 2020-2035
  • Figure 131: South Asia & Pacific Market Volume (Units) Analysis by Material, 2020-2035
  • Figure 132: South Asia & Pacific Market Value Share (%) and BPS Analysis by Material, 2025-2035
  • Figure 133: South Asia & Pacific Market Y-o-Y Growth (%) Projections by Material, 2025-2035
  • Figure 134: South Asia & Pacific Market Value (USD Billion) Analysis by Type, 2020-2035
  • Figure 135: South Asia & Pacific Market Volume (Units) Analysis by Type, 2020-2035
  • Figure 136: South Asia & Pacific Market Value Share (%) and BPS Analysis by Type, 2025-2035
  • Figure 137: South Asia & Pacific Market Y-o-Y Growth (%) Projections by Type, 2025-2035
  • Figure 138: South Asia & Pacific Market Value (USD Billion) Analysis by Application, 2020-2035
  • Figure 139: South Asia & Pacific Market Volume (Units) Analysis by Application, 2020-2035
  • Figure 140: South Asia & Pacific Market Value Share (%) and BPS Analysis by Application, 2025-2035
  • Figure 141: South Asia & Pacific Market Y-o-Y Growth (%) Projections by Application, 2025-2035
  • Figure 142: South Asia & Pacific Market Value (USD Billion) Analysis by End Use, 2020-2035
  • Figure 143: South Asia & Pacific Market Volume (Units) Analysis by End Use, 2020-2035
  • Figure 144: South Asia & Pacific Market Value Share (%) and BPS Analysis by End Use, 2025-2035
  • Figure 145: South Asia & Pacific Market Y-o-Y Growth (%) Projections by End Use, 2025-2035
  • Figure 146: South Asia & Pacific Market Attractiveness by Material, 2025-2035
  • Figure 147: South Asia & Pacific Market Attractiveness by Type, 2025-2035
  • Figure 148: South Asia & Pacific Market Attractiveness by Application, 2025-2035
  • Figure 149: South Asia & Pacific Market Attractiveness by End Use, 2025-2035
  • Figure 150: South Asia & Pacific Market Attractiveness by Country, 2025-2035
  • Figure 151: Western Europe Market Value (USD Billion) by Material, 2025-2035
  • Figure 152: Western Europe Market Value (USD Billion) by Type, 2025-2035
  • Figure 153: Western Europe Market Value (USD Billion) by Application, 2025-2035
  • Figure 154: Western Europe Market Value (USD Billion) by End Use, 2025-2035
  • Figure 155: Western Europe Market Value (USD Billion) by Country, 2025-2035
  • Figure 156: Western Europe Market Value (USD Billion) Analysis by Country, 2020-2035
  • Figure 157: Western Europe Market Volume (Units) Analysis by Country, 2020-2035
  • Figure 158: Western Europe Market Value Share (%) and BPS Analysis by Country, 2025-2035
  • Figure 159: Western Europe Market Y-o-Y Growth (%) Projections by Country, 2025-2035
  • Figure 160: Western Europe Market Value (USD Billion) Analysis by Material, 2020-2035
  • Figure 161: Western Europe Market Volume (Units) Analysis by Material, 2020-2035
  • Figure 162: Western Europe Market Value Share (%) and BPS Analysis by Material, 2025-2035
  • Figure 163: Western Europe Market Y-o-Y Growth (%) Projections by Material, 2025-2035
  • Figure 164: Western Europe Market Value (USD Billion) Analysis by Type, 2020-2035
  • Figure 165: Western Europe Market Volume (Units) Analysis by Type, 2020-2035
  • Figure 166: Western Europe Market Value Share (%) and BPS Analysis by Type, 2025-2035
  • Figure 167: Western Europe Market Y-o-Y Growth (%) Projections by Type, 2025-2035
  • Figure 168: Western Europe Market Value (USD Billion) Analysis by Application, 2020-2035
  • Figure 169: Western Europe Market Volume (Units) Analysis by Application, 2020-2035
  • Figure 170: Western Europe Market Value Share (%) and BPS Analysis by Application, 2025-2035
  • Figure 171: Western Europe Market Y-o-Y Growth (%) Projections by Application, 2025-2035
  • Figure 172: Western Europe Market Value (USD Billion) Analysis by End Use, 2020-2035
  • Figure 173: Western Europe Market Volume (Units) Analysis by End Use, 2020-2035
  • Figure 174: Western Europe Market Value Share (%) and BPS Analysis by End Use, 2025-2035
  • Figure 175: Western Europe Market Y-o-Y Growth (%) Projections by End Use, 2025-2035
  • Figure 176: Western Europe Market Attractiveness by Material, 2025-2035
  • Figure 177: Western Europe Market Attractiveness by Type, 2025-2035
  • Figure 178: Western Europe Market Attractiveness by Application, 2025-2035
  • Figure 179: Western Europe Market Attractiveness by End Use, 2025-2035
  • Figure 180: Western Europe Market Attractiveness by Country, 2025-2035
  • Figure 181: Eastern Europe Market Value (USD Billion) by Material, 2025-2035
  • Figure 182: Eastern Europe Market Value (USD Billion) by Type, 2025-2035
  • Figure 183: Eastern Europe Market Value (USD Billion) by Application, 2025-2035
  • Figure 184: Eastern Europe Market Value (USD Billion) by End Use, 2025-2035
  • Figure 185: Eastern Europe Market Value (USD Billion) by Country, 2025-2035
  • Figure 186: Eastern Europe Market Value (USD Billion) Analysis by Country, 2020-2035
  • Figure 187: Eastern Europe Market Volume (Units) Analysis by Country, 2020-2035
  • Figure 188: Eastern Europe Market Value Share (%) and BPS Analysis by Country, 2025-2035
  • Figure 189: Eastern Europe Market Y-o-Y Growth (%) Projections by Country, 2025-2035
  • Figure 190: Eastern Europe Market Value (USD Billion) Analysis by Material, 2020-2035
  • Figure 191: Eastern Europe Market Volume (Units) Analysis by Material, 2020-2035
  • Figure 192: Eastern Europe Market Value Share (%) and BPS Analysis by Material, 2025-2035
  • Figure 193: Eastern Europe Market Y-o-Y Growth (%) Projections by Material, 2025-2035
  • Figure 194: Eastern Europe Market Value (USD Billion) Analysis by Type, 2020-2035
  • Figure 195: Eastern Europe Market Volume (Units) Analysis by Type, 2020-2035
  • Figure 196: Eastern Europe Market Value Share (%) and BPS Analysis by Type, 2025-2035
  • Figure 197: Eastern Europe Market Y-o-Y Growth (%) Projections by Type, 2025-2035
  • Figure 198: Eastern Europe Market Value (USD Billion) Analysis by Application, 2020-2035
  • Figure 199: Eastern Europe Market Volume (Units) Analysis by Application, 2020-2035
  • Figure 200: Eastern Europe Market Value Share (%) and BPS Analysis by Application, 2025-2035
Dashboard
Dashboard
Dashboard
Dashboard
Dashboard
Dashboard

Full Research Suite comprises of:

Market outlook & trends analysis

Market outlook & trends analysis

Interviews & case studies

Interviews & case studies

Strategic recommendations

Strategic recommendations

Vendor profiles & capabilities analysis

Vendor profiles & capabilities analysis

5-year forecasts

5-year forecasts

8 regions and 60+ country-level data splits

8 regions and 60+ country-level data splits

Market segment data splits

Market segment data splits

12 months of continuous data updates

12 months of continuous data updates

DELIVERED AS:

PDF EXCEL ONLINE

Full Research Suite


$5000

$7500

$10000

Buy Report Now
Similar Industry Reports

Similar Industry Reports

Demand for Soft Magnetic Composites in EU

Demand for Soft Magnetic Composites in EU Size and Share Forecast Outlook 2025 to 2035

Soft Touch Lamination Film Market

Soft Touch Lamination Film Market Size and Share Forecast Outlook 2025 to 2035

Software Defined Vehicle Market

Software Defined Vehicle Market Size and Share Forecast Outlook 2025 to 2035

Software Defined Networking (SDN) And Network Function Virtualization (NFV) Market

Software Defined Networking (SDN) And Network Function Virtualization (NFV) Market Size and Share Forecast Outlook 2025 to 2035

Software Defined Perimeter (SDP) Market

Software Defined Perimeter (SDP) Market Size and Share Forecast Outlook 2025 to 2035

Soft Ferrite Core Market

Soft Ferrite Core Market Size and Share Forecast Outlook 2025 to 2035

Soft Gripper Market
Soft Gripper Market

Soft Gripper Market Size and Share Forecast Outlook 2025 to 2035

Software-Defined Wide Area Network SD-WAN Market

Software-Defined Wide Area Network SD-WAN Market Size and Share Forecast Outlook 2025 to 2035

Softwood Veneer and Plywood Market

Softwood Veneer and Plywood Market Size and Share Forecast Outlook 2025 to 2035

Software Defined Radio (SDR) Market

Software Defined Radio (SDR) Market Size and Share Forecast Outlook 2025 to 2035

Software License Management (SLM) Market

Software License Management (SLM) Market Size and Share Forecast Outlook 2025 to 2035

Soft Wall Military Shelter Market

Soft Wall Military Shelter Market Size and Share Forecast Outlook 2025 to 2035

Software-Defined Networking SDN Market

Software-Defined Networking SDN Market Size and Share Forecast Outlook 2025 to 2035

Soft Drinks Packaging Market

Soft Drinks Packaging Market Size and Share Forecast Outlook 2025 to 2035

Software-Defined Anything (SDx) Market

Software-Defined Anything (SDx) Market Size and Share Forecast Outlook 2025 to 2035

Software-Defined Data Center Market

Software-Defined Data Center Market Size and Share Forecast Outlook 2025 to 2035

Software Containers Market

Software Containers Market Size and Share Forecast Outlook 2025 to 2035

Software Defined Application And Infrastructure Market

Software Defined Application And Infrastructure Market Size and Share Forecast Outlook 2025 to 2035

Software Defined Networking Market

Software Defined Networking Market Size and Share Forecast Outlook 2025 to 2035

Software-Defined Camera (SDC) Market

Software-Defined Camera (SDC) Market Size and Share Forecast Outlook 2025 to 2035

Future Market Insights

Soft Magnetic Composite Market

Chat With MaRIA

Chat With

MaRIA

Hi There, I am MaRIA, Your Market Research Intelligence Assistant. How may I help you?