North America Palletizing Robot Industry Size and Share Forecast Outlook (2025 to 2035)

The Palletizing Robot Industry Analysis in North America is estimated to be valued at USD 627.5 million in 2025 and is projected to reach USD 1471.9 million by 2035, registering a compound annual growth rate (CAGR) of 8.9% over the forecast period.

The Palletizing Robot industry in North America is witnessing robust growth, driven by the increasing demand for automation in logistics, warehousing, and manufacturing operations. The adoption of robotic solutions is being accelerated by the need to enhance operational efficiency, reduce labor costs, and improve workplace safety in material handling processes. Advancements in robotic technologies, including precision control, sensor integration, and AI-based path optimization, are enabling robots to handle complex palletizing tasks with high accuracy and repeatability.

The growth of e-commerce and rising consumer expectations for faster delivery times are further fueling the demand for palletizing robots across distribution centers. Investments in smart manufacturing, Industry 4.0 initiatives, and automated warehouses are creating opportunities for scalable and flexible robotic systems.

North America’s emphasis on technological innovation, regulatory compliance, and operational efficiency continues to drive market expansion As organizations seek to optimize supply chain processes while minimizing errors and downtime, palletizing robots are expected to remain a critical component in the region’s industrial automation ecosystem.
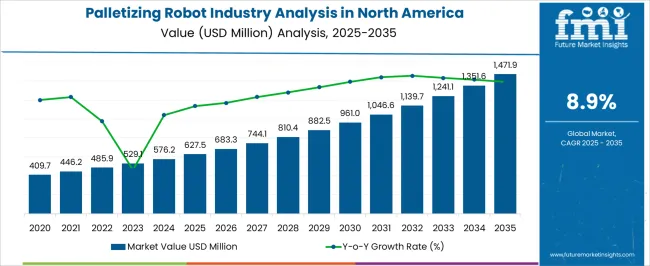
Quick Stats for Palletizing Robot Industry Analysis in North America

  • Palletizing Robot Industry Analysis in North America Industry Value (2025): USD 627.5 million
  • Palletizing Robot Industry Analysis in North America Forecast Value (2035): USD 1471.9 million
  • Palletizing Robot Industry Analysis in North America Forecast CAGR: 8.9%
  • Leading Segment in Palletizing Robot Industry Analysis in North America in 2025: Articulated Robots (39.3%)
  • Key Growth Region in Palletizing Robot Industry Analysis in North America: North America, Asia-Pacific, Europe
  • Top Key Players in Palletizing Robot Industry Analysis in North America: FANUC America Corp, KUKA Robotics Corp, Yaskawa America, Inc., ABB Robotics, Universal Robots USA, Inc., Kawasaki Robotics Inc., Stäubli Robotics, Columbia/Okura, FUJI Robotics, SCOTT Technology, FlexLink Systems, Inc., Sage Automation, Kraken Automation, OnRobot US Inc., Berobox, JLS Automation, Kassow Robots

Palletizing Robot Industry Analysis In North America Market Value Analysis

Metric Value
Palletizing Robot Industry Analysis in North America Estimated Value in (2025 E) USD 627.5 million
Palletizing Robot Industry Analysis in North America Forecast Value in (2035 F) USD 1471.9 million
Forecast CAGR (2025 to 2035) 8.9%

Segmental Analysis

The market is segmented by Robot Type, Reach Range, Material Type, and End-Use and region. By Robot Type, the market is divided into Articulated Robots, Collaborative Robots, SCARA Robots, Delta Robots, and Gantry Robots. In terms of Reach Range, the market is classified into Up To 1,000 Mm, 1,000 To 3,000 Mm, and Above 3,000 Mm. Based on Material Type, the market is segmented into Boxes/Cases, Bags/Sacks, Bundles, and Others. By End-Use, the market is divided into Warehousing & Logistics and Manufacturing. Regionally, the market is classified into North America, Latin America, Western Europe, Eastern Europe, Balkan & Baltic Countries, Russia & Belarus, Central Asia, East Asia, South Asia & Pacific, and the Middle East & Africa.
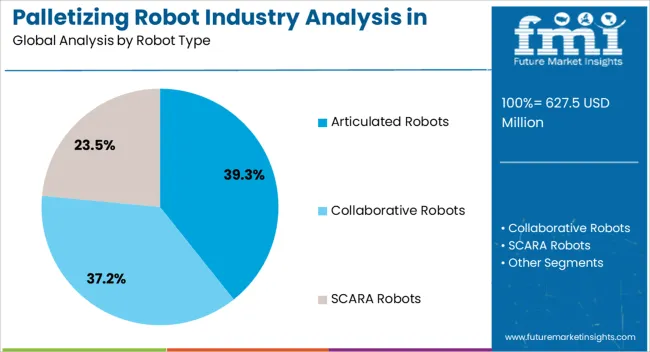
Insights into the Articulated Robots Type Segment

Palletizing Robot Industry Analysis In North America Analysis By Robot Type

The articulated robots segment is projected to hold 39.3% of the market revenue in 2025, establishing it as the leading robot type in North America. Growth in this segment is driven by the versatility and flexibility offered by articulated designs, which allow multi-axis movement and precise handling of various payloads. These robots can be adapted for a wide range of palletizing tasks, accommodating different product sizes and configurations.

The capability to integrate advanced vision systems and AI-based controls enhances operational efficiency and reduces cycle times, making articulated robots a preferred choice for high-volume distribution centers and manufacturing plants. Their adaptability to evolving production layouts and rapid deployment in automated lines further supports adoption.

Continuous advancements in robotic software, end-of-arm tooling, and safety features have reinforced reliability and ease of integration As industries increasingly prioritize automation, the articulated robot segment is expected to maintain its leadership, driven by its performance, scalability, and alignment with smart manufacturing initiatives.
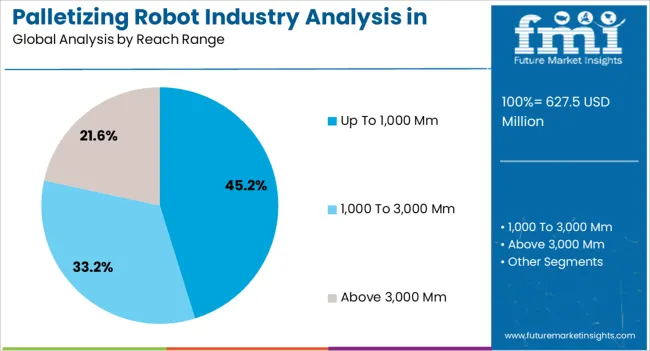
Insights into the Up To 1,000 Mm Reach Range Segment

Palletizing Robot Industry Analysis In North America Analysis By Reach Range

The up to 1,000 mm reach range segment is expected to hold 45.2% of the market revenue in 2025, making it the leading category for reach. Growth in this segment is being driven by the prevalence of compact palletizing applications in warehouses, manufacturing plants, and distribution centers, where space optimization and precise handling are critical. Robots within this reach range provide a balance between flexibility and operational efficiency, enabling effective stacking of products while minimizing floor space usage.

Integration with automated conveyors, vision-guided systems, and AI-based controls enhances precision and reduces error rates. This reach range is particularly suitable for handling standard-sized packages, cases, and boxes without requiring extensive modifications to production layouts.

Rising adoption of automated material handling solutions, coupled with the need for higher throughput and reduced labor dependency, is further supporting growth As companies continue to optimize warehouse operations and improve productivity, the up to 1,000 mm reach range segment is expected to remain the most widely deployed and revenue-generating category in North America.
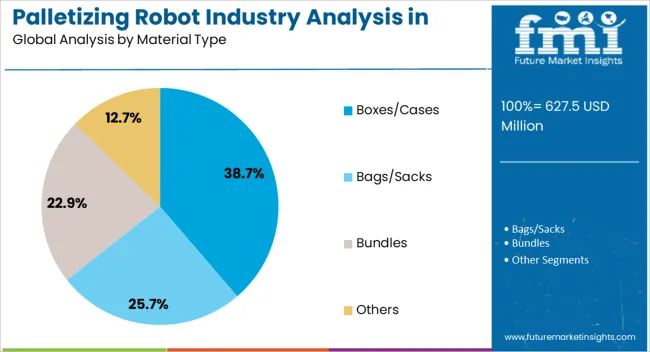
Insights into the Boxes/Cases Material Type Segment

Palletizing Robot Industry Analysis In North America Analysis By Material Type

The boxes and cases material type segment is projected to hold 38.7% of the market revenue in 2025, establishing it as the leading material category. Growth is being driven by the widespread use of packaged goods in logistics, food and beverage, and consumer product industries, which necessitates efficient handling and stacking of standardized boxes and cases. Palletizing robots designed for this material type offer precision in stacking, reduced product damage, and high-speed operation, enhancing overall throughput.

Integration with automated sorting, conveyor systems, and vision-based guidance allows robots to adapt to variations in package size, weight, and orientation. The growing e-commerce and retail distribution sectors are contributing to increased demand for reliable palletizing solutions tailored for boxes and cases.

Operational cost savings, enhanced safety by reducing manual handling, and scalability for high-volume applications are further supporting adoption As industries focus on automation to meet growing supply chain demands, the boxes and cases segment is expected to remain the dominant material type in the North American palletizing robot market.

Key Strategic Highlights from the North America Palletizing Robot Industry Report

Revenue to Rise over 2.3X through 2035

Palletizing robot revenue in North America is forecast to surge over 2.3X through 2035, amid a 5.2% spike in future CAGR compared to the historical one. This is attributable to high adoption of automation and robotics across manufacturing, logistics, and e-commerce sectors.

Sales of palletizing robots across North America are picking up pace as industries look to automate their palletizing tasks to enhance efficiency and productivity. The escalating labor costs are also compelling the implementation of automation solutions, including palletizing robots.

United States to Remain at the Epicenter of Sales Growth

As per the latest analysis, the United States will emerge as the frontrunner, in terms of palletizing robots adoption. It is set to hold around 66.8% of the North America palletizing robot industry share in 2035.

The United States has a highly developed manufacturing sector that emphasizes automation as well as innovation. This positively influences palletizing robot sales in the nation, and the trend will persist through 2035 as companies embrace automation.

By streamlining the palletizing process, palletizing robots help reduce labor costs, increase throughput, and improve operational efficiency. Further, a strong research and development (R&D) system is in place within the United States, resulting in better technology for robotic palletizers over time.

The continuous improvement ensures that the United States-based producers remain competitive by attracting both local and foreign customers looking for innovative automation systems. Therefore, due to its vastness and scope, it’s no wonder that the United States has an insatiable thirst for automated packaging, such as palletizing machines.

Articulated Robots Becoming Go-to Solutions for Firms

Articulated robots are forecast to dominate the North America industry, holding a volume share of about 37.1% in 2025. This is attributable to rising adoption of these robots across several industries of palletizing tasks.

When it comes to a variety of industries, articulated robots are ideal for different palletizing jobs. Because of this efficiency, they are extensively utilized by companies that need convenient automation solutions.

The improved performance and reliability due to technological advancements in design and functionality of articulated robots also fuel their adoption. The enhancements include enhanced precision, speed, and payload capacity that allow articulated robots to deal with various palletizing requirements effectively.

Increased productivity and cost-efficiency needs in sectors like manufacturing, logistics, and e-commerce push higher demand for articulated palletizers in North America. In response, manufacturers are developing articulated robots that conduct high-speed, precise palletizing, boosting operational capabilities and reducing wage bills.

Overview of the North America Palletizing Robot Industry Landscape

The NA palletizing robot sector is surging due to several important factors. The region's strong manufacturing industry is the main driver, and automation technology use is also on the rise.

Palletizing robot demand is growing as enterprises look to increase efficiency, save labor costs, and improve output. The industry's expansion is also fueled by the requirement for adaptable manufacturing lines and the capacity to meet shifting consumer expectations.

Palletizing robot adoption is also significantly influenced by North America's innovation ecosystem and technical breakthroughs. As companies look for innovative ways to stay competitive, they are increasingly embracing automation, including the usage of robots.

Palletizing robots in North America are also evolving. Modern robots can handle hard tasks faster due to AI and machine learning. Cobots or collaborative robots are gaining immense traction. They help palletizing become efficient and safe.

Cobots enable secure, efficient palletizing with human oversight. Data-driven cloud solutions optimize and maintain palletizing operations. Growing fame of these advanced palletizing robots will boost the North America palletizing robot industry growth.

KUKA Robotics Corp., Yaskawa, Fanuc, ABB, and Universal Robotics Co. Ltd. are the key palletizing robot manufacturers empowering industries with cutting-edge instruments. They are constantly innovating to offer novel palletizing robots to their clients.

Integration of cutting-edge technologies in machines ensures heightened precision, durability, and stability during the lifting processes. Manufacturers are consistently pushing the boundaries of innovation, introducing advanced features such as increased power capacities, improved beam quality, and enhanced automation capabilities.

Robot developers focus on refining designs to withstand demanding industrial conditions. They are offering solutions with features like real-time monitoring, adaptive control systems, and seamless integration into automated manufacturing setups.

With innovative trends like AI integration and cobots shaping the industry's trajectory, the future holds opportunities for further expansion. Therefore, a robust CAGR has been predicted for the target industry through 2035.

Comparison of Historical Performance vs Future Outlook for Palletizing Robots in North America

Palletizing robot sales in North America grew at a CAGR of 3.7% between 2020 and 2025. Total revenue in the region reached about USD 627.5 million in 2025. From 2025 to 2035, demand for palletizing robots in the region is forecast to rise at a CAGR of 8.9%.

Historical CAGR (2020 to 2025) 3.7%
Forecast CAGR (2025 to 2035) 8.9%

The North America palletizing robot industry witnessed moderate growth between 2020 and 2025. This was due to increased awareness of the benefits of using palletizing robots for optimizing processes and reducing manual error.

The COVID-19 pandemic created immense demand for ventilators, diagnostics tools, and other medical equipment. This prompted pharmaceutical and medical devices manufacturers to install automatic solutions like palletizing robots.

Future Outlook for Palletizing Robot Solutions in North America

In the next decade, high adoption of automation and a shift towards smart manufacturing practices will provide impetus for sales growth. Similarly, continual advances in robotic technologies and integration with automation and Industry 4.0 practices, coupled with a focus on sustainability, may further fuel industry expansion.

Key Dynamics Influencing the Palletizing Robot Industry in North America

Rapid Growth of the E-commerce Industry

Efficient palletizing solutions have become in high demand as a result of the growth of e-commerce. The volume of orders placed through online shopping has risen significantly, necessitating more flexible palletizing processes.

Palletizing robots with advanced automation capabilities are needed to fulfill the changing demands of the e-commerce sector. The effective palletizing system improves efficiency in the warehouse and accelerates the fulfillment of orders. This pattern emphasizes the significance of palletizing robots to e-commerce enterprises' need for flexibility and efficiency.

Companies' landscape has drastically changed due to the e-commerce industry's relentless growth. Electronic commerce is growing at a rapid pace, posing both new opportunities and challenges for companies.

The efficiency and accessibility of the Internet are posing a challenge to traditional marketing channels as customers come to appreciate the convenience of the Internet. This change in perspective has increased demand for cutting-edge technologies like robotic pelletizing devices.

Automation system offers a flexible strategy for inventory management and collection, catering to the growing requirements of e-commerce warehouses. Companies can use robotics to increase production, decrease errors, increase efficiency, and expedite order fulfillment. The e-commerce sector's explosive expansion spurs the use of cutting-edge technology like robotic palletizing equipment.

Escalating Demand for Eco-friendly and Energy-efficient Palletizing Robots

Surging demand for eco-friendly and energy-efficient palletizing robots is transforming the industrial automation landscape. As environmental sustainability takes center stage, organizations increasingly prioritize robotic solutions that align with eco-conscious practices.

As environmental sustainability becomes increasingly important, companies are giving higher priority to robotic solutions that are compatible with environmentally conscious practices. These are fueled by increased awareness of the impact of industrial activities on the environment and a commitment to reduce emissions.

Robots designed to be energy efficient not only contribute to cost savings but also affect a broader corporate responsibility to mitigate climate change. As a result, companies are constantly seeking eco-friendly and energy-efficient palletizing robots.

Labor Shortages and Rising Labor Costs

Labor shortages and the concurrent rise in labor costs will also propel growth of the palletizing robot industry in North America. As industries grapple with a scarcity of skilled workers and the increasing expenses associated with manual labor, there is a heightened recognition of the efficiency and cost-effectiveness offered by palletizing robots.

Palletizing robots equipped with advanced capabilities address the need for consistent and precise material handling, reducing dependency on human labor. The synergy between labor-related challenges and the adoption of palletizing robots underscores a transformative trend, positioning these automated solutions as indispensable assets in modern industrial settings.

Challenges Hindering Growth in the North America Palletizing Robot Sector

High Initial Investment Costs Hinder Palletizing Robot Adoption

The restraint of high initial investment costs casts a shadow over the widespread adoption of palletizing robots, particularly affecting small companies. The substantial upfront expenses related to procuring and implementing palletizing robot systems present a financial barrier, hindering the entry of some enterprises in the automation industry.

Smaller companies, often operating with tighter budgets, may struggle to justify the initial investment. This impacts their ability to use the efficiency and benefits of palletizing robots.

The financial constraint creates a dichotomy, limiting accessibility to advanced automation technologies and potentially slowing down the broader integration of palletizing robots across industries. As a result, addressing cost considerations becomes paramount in pushing a more inclusive adoption of palletizing robots.

Analysis of Top Countries Manufacturing and Deploying Palletizing Robots in North America

The table below highlights key countries’ palletizing robots industry revenues. The United States will remain the leading consumer of palletizing robots, with total valuation in the nation set to reach USD 1471.9 million in 2035.

Countries Palletizing Robot Industry Revenue in 2035
United States USD 1471.9 million
Mexico USD 259.6 million
Canada USD 189.4 million

The table below shows the estimated growth rates of the top nations. Canada and Mexico are set to record high CAGRs of 9.6% and 9.3%, respectively, through 2035.

Countries North America Palletizing Robot CAGR (2025 to 2035)
Canada 9.6%
Mexico 9.3%
United States 8.7%

United States Remains the Hotbed for Palletizing Robot Manufacturers

The United States leads from the forefront when it comes to adopting automation and robotics. As a result, the nation is becoming a happy hunting ground for palletizing robot manufacturers, offering lucrative revenue-generation opportunities.

As per the latest report, the United States palletizing robot industry value is forecast to total USD 1471.9 million by 2035. Sales of palletizing robots in the United States are picking up pace at 8.7% CAGR.

Rising adoption of palletizing in diverse sectors such as manufacturing, logistics, and e-commerce is providing impetus for industry growth. Technological advances in robotics, including advanced sensors and machine learning, are enhancing their appeal among end users.

Growing focus on safety and ergonomics in Industry 4.0 environments is driving palletizing robot adoption. Majority of companies across the United States are embracing automation and robotics to boost their productivity and reduce labor costs.

The adoption of Industry 4.0 principles, including connectivity, data analytics, and real-time monitoring, is driving the innovation of palletizing robots. These robots can be integrated into smart factory environments, allowing for seamless communication and coordination with other manufacturing systems.

Government subsidies and high competition further accelerate innovation, while supplier diversity provides innovative solutions. These cumulative advances are driving the robotic palletizing industry forward, revolutionizing operations across industries in the United States.

Rapid Industrialization Influencing Palletizing Robot Sales in Mexico

Demand for palletizing robots in Mexico is witnessing an uptick amid rapid industrialization and growing emphasis on enhanced productivity. A CAGR of around 9.3% is on the cards for Mexico's palletizing robot industry, with a total valuation set to reach USD 259.6 million by 2035.

As industries including automotive, electronics, and manufacturing rise across Mexico, the demand for robotic palletizing and other automation solutions grows exponentially. These advanced robotic solutions enable mass production and lower labor costs.

Rise in government subsidies and incentives further encourages companies to invest in automation technology, thereby boosting the target industry. With competition accelerating, palletizing robots enable Mexican companies to improve their competitiveness and broaden their reach.

North America Palletizing Robot Industry Analysis by Top Investment Segments

The section below shows the articulated robots segment dominating the palletizing robot industry in North America, exhibiting a CAGR of 8.2%. Based on end-use, the manufacturing segment is forecast to thrive at 8.7% CAGR through 2035.

Articulated Robots Remain Top-selling Palletizing Robot Type in North America

Top Segment (Robot Type) Articulated Robots
CAGR (2025 to 2035) 8.2%

There are various robots with specific configurations and functionalities to suit different needs. However, articulated robots' unmatched versatility and accuracy make them the go-to solution for companies seeking automation in their palletizing tasks.

Articulated robots are becoming top-selling robot types across North America, recording a CAGR of 8.2%. Courtesy of this, a valuation of USD 1471.9 million has been predicted for the target segment in 2035.

High adoption of articulated robots in North America can be attributed to several factors. First, these robots offer unparalleled flexibility and usability, enabling them to handle a wide range of pallet-making tasks under industrial conditions. Their lateral design provides precision and stability, making them suitable for efficient stacking and pallet sorting.

Artificial intelligence robots are highly customizable and scalable, adapting to the needs of various manufacturing processes and changing business needs. Their advanced control systems and software integration capabilities further enhance productivity and efficiency in end-use industries.

Articulated robots boast a proven track record of reliability and efficiency, instilling confidence in their operators and encouraging widespread use. Hence, the combination of versatility, accuracy, and reliability will continue to make articulated robots popular among end users.

Palletizing Robot Usage Remains High in Manufacturing

Top Segment (End Use) Manufacturing
CAGR (2025 to 2035) 8.7%

As per the latest analysis, adoption of palletizing robots will continue to remain high in the manufacturing sector, increasing at 8.7% CAGR. The target segment is set to generate a valuation of USD 777.6 million by 2035, making manufacturing sector the prime target of palletizing robot manufacturing companies.

High demand for robotic pelletizing in the North American manufacturing sector is a key driver for the target segment. As manufacturing processes continue to become more responsive and efficient, robotic pallet manufacturing offers greater benefits, prompting industries like automotive and food & beverage to install palletizing robots.

Palletizing robots can handle a variety of materials with precision and speed, improving efficiency and reducing labor costs. They help manufacturing industries to achieve their high efficiency and productivity while reducing labor costs and workplace injuries.

The manufacturing industry in North America is experiencing strong growth, particularly in automotive, electrical equipment, food, beverage, and consumer goods. As production volumes increase, solutions such as pelletizing robots are used to meet growing demand while maintaining quality standards.

What is more is the technological advances in robotics, including sensor gripper software for improved hybridization. These innovations make palletizing robots more versatile and adaptable to different production processes in the manufacturing sector.
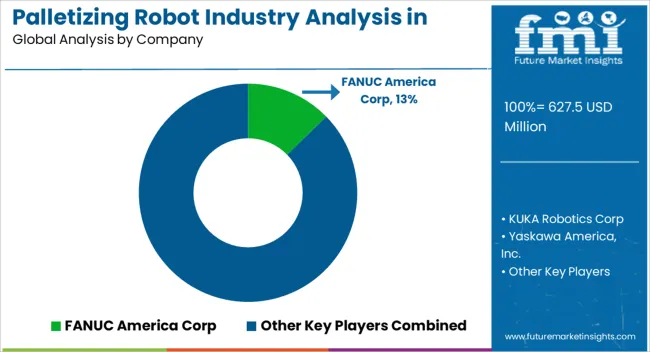

Competitive Landscape of the North America Palletizing Robot Industry

Palletizing Robot Industry Analysis In North America Analysis By Company

The North America palletizing robot industry is consolidated, with leading players accounting for about 55% to 60% share. KUKA Robotics Corp., FANUC America Corp., Yaskawa America, Inc., Universal Robots USA, Inc., Kawasaki Robotics Inc. Columbia/Okura, and ABB Robotics Co. are the leading manufacturers of palletizing robots listed in the report.

Innovation is becoming a key success tool for companies to succeed in this surging industry. As a result, top palletizing robot manufacturers across North America are developing more sophisticated robots that can handle a wide range of product sizes, weights, and packaging formats.

Several companies are concentrating on reducing palletizing robot prices to encourage their adoption among small and medium companies, especially e-commerce companies. They are also implementing strategies like mergers, acquisitions, partnerships, distribution agreements, and facility expansions to boost their revenue and broaden their footprint.

Recent Developments in North America Palletizing Robot Industry

  • In March 2025, OSARO, a prominent developer of advanced robotic automation, introduced the first robotic solution for automated bagging at MODEX 2025.
  • In February 2025, beRobox announced that it will showcase the PALTZ palletizing solution at the Midwest Manufacturers Trade Show in 2025. This event provides an opportunity for potential customers to see the simplicity and ease of use of the PALTZ system firsthand.
  • In December 2025, FANUC America introduced the new M-710iD/50M robot, marking the first update to the M-710i robot series in 17 years. This next-generation robot offers an increased payload and higher wrist load capacity for enhanced precision and efficiency across various applications such as assembly, material handling, part transfer, palletizing, and welding.
  • In February 2025, Yaskawa made significant strides in industrial automation through its Motoman brand of robotic arms, part positioners, and user-friendly controllers. These advancements have enabled the automation of applications that were previously considered challenging. Yaskawa's commitment to innovation is unprecedented in its efforts to take industrial automation to new heights through robotics.

Scope and Coverage of the North America Palletizing Robot Market Report

  • Adjacent Study on Robotic Palletizers & De-Palletizers Market, North America Full Layer Palletizing Robots Market, Industrial Palletizing Robots Market, and North American robotic palletizing market
  • Future Scope of North America Warehouse Robotics Market
  • Dynamics of Palletizing Robot Market in the United States and Canada
  • Key Players in North America Robotic Palletizing System Market
  • Emerging Trends in North American Robotic Palletizing Market
  • Scope of Automated Palletizing System Market in North America
  • Expected Global Palletizing Robots Market Size
  • Overview of Automated Palletizing System Market in North America
  • Potential of Palletizing Automation Market in Canada
  • Growth Prospects for Robot Palletizers Market in the United States

Overview of Analytical Coverage and Study Boundaries for the North America Palletizing Robot Industry

Attribute Details
Industry Size in 2025 USD 576.2 million
Industry Value in 2035 USD 1,354.1 million
Growth Rate (2025 to 2035) 8.9% CAGR
Historical Data 2020 to 2025
Forecast Period 2025 to 2035
Quantitative Units Value (USD million) and Volume (Units)
Report Coverage Revenue Forecast, Volume Forecast, Company Ranking, Competitive Landscape, Growth Factors, Trends, and Pricing Analysis
Key Segments Covered Robot Type, Reach Range, Material Type, End-use, Country
Countries Covered United States, Canada, Mexico
Sub-region Covered Northeast United States; Southwest United States; Southeast United States; West United States; Midwest United States; Alberta; British Columbia; Manitoba; Quebec; Ontario; Baja California; Pacific Coastal Lowlands; Mexican Plateau; Sierra Oriental
Key Companies Profiled KUKA Robotics Corp; FANUC America Corp; Yaskawa America, Inc.; Universal Robots USA, Inc.; Kawasaki Robotics Inc.; Columbia/Okura; Stäubli Robotics; Kassow Robots; SCOTT Technology; FUJI Robotics; Berobox; ABB Robotics; FlexLink Systems, Inc.; Sage Automation; Kraken Automation; OnRobot US Inc.; JLS Automation

Top Segments Studied in the North America Palletizing Robot Industry Report

By Robot Type:

  • Articulated Robots
    • Up to 100 Kg
    • 100 to 300 Kg
    • 300 to 500 Kg
    • Above 500 Kg
  • Collaborative Robots
    • Up to 10 Kg
    • 10 to 30 Kg
    • 30 to 50 Kg
    • Above 50 Kg
  • SCARA Robots
    • Up to 5 Kg
    • 5 to 10 Kg
    • 10 to 20 Kg
    • Above 20 Kg
  • Delta Robots
    • Up to 3 Kg
    • 3 to 6 Kg
    • Above 6 Kg
  • Gantry Robots
    • Up to 50 Kg
    • 50 to 150 Kg
    • Above 150 Kg

By Reach Range:

  • Up to 1,000 mm
  • 1,000 to 3,000 mm
  • Above 3,000 mm

By Material Type:

  • Boxes/Cases
  • Bags/Sacks
  • Bundles
  • Others

By End-use:

  • Warehousing & Logistics
  • Manufacturing
    • Food & Beverages
    • FMCG
    • Chemicals & Materials
    • Pharmaceuticals
    • Electrical & Electronics Components
    • Cement
    • Agriculture Seeds
    • Other Discrete Manufacturing

By Country:

  • United States
  • Canada
  • Mexico

Frequently Asked Questions

How big is the palletizing robot industry analysis in north america in 2025?

The global palletizing robot industry analysis in north america is estimated to be valued at USD 627.5 million in 2025.

What will be the size of palletizing robot industry analysis in north america in 2035?

The market size for the palletizing robot industry analysis in north america is projected to reach USD 1,471.9 million by 2035.

How much will be the palletizing robot industry analysis in north america growth between 2025 and 2035?

The palletizing robot industry analysis in north america is expected to grow at a 8.9% CAGR between 2025 and 2035.

What are the key product types in the palletizing robot industry analysis in north america?

The key product types in palletizing robot industry analysis in north america are articulated robots, _up to 100 kg, _100 to 300 kg, _300 to 500 kg, _above 500 kg, collaborative robots, _up to 10 kg, _10 to 30 kg, _30 to 50 kg, _above 50 kg, scara robots, _up to 5 kg, _5 to 10 kg, _10 to 20 kg, _above 20 kg, delta robots, _up to 3 kg, _3 to 6 kg, _above 6 kg, gantry robots, _up to 50 kg, _50 to 150 kg and _above 150 kg.

Which reach range segment to contribute significant share in the palletizing robot industry analysis in north america in 2025?

In terms of reach range, up to 1,000 mm segment to command 45.2% share in the palletizing robot industry analysis in north america in 2025.

Table of Content

  1. Executive Summary
    • Global Market Outlook
    • Demand-side Trends
    • Supply-side Trends
    • Technology Roadmap Analysis
    • Analysis and Recommendations
  2. Market Overview
    • Market Coverage / Taxonomy
    • Market Definition / Scope / Limitations
  3. Market Background
    • Market Dynamics
      • Drivers
      • Restraints
      • Opportunity
      • Trends
    • Scenario Forecast
      • Demand in Optimistic Scenario
      • Demand in Likely Scenario
      • Demand in Conservative Scenario
    • Opportunity Map Analysis
    • Product Life Cycle Analysis
    • Supply Chain Analysis
    • Investment Feasibility Matrix
    • Value Chain Analysis
    • PESTLE and Porter’s Analysis
    • Regulatory Landscape
    • Regional Parent Market Outlook
    • Production and Consumption Statistics
    • Import and Export Statistics
  4. Global Analysis 2020 to 2024 and Forecast, 2025 to 2035
    • Historical Market Size Value (USD Million) Analysis, 2020 to 2024
    • Current and Future Market Size Value (USD Million) Projections, 2025 to 2035
      • Y-o-Y Growth Trend Analysis
      • Absolute $ Opportunity Analysis
  5. Global Pricing Analysis 2020 to 2024 and Forecast 2025 to 2035
  6. Global Analysis 2020 to 2024 and Forecast 2025 to 2035, By Robot Type
    • Introduction / Key Findings
    • Historical Market Size Value (USD Million) Analysis By Robot Type , 2020 to 2024
    • Current and Future Market Size Value (USD Million) Analysis and Forecast By Robot Type , 2025 to 2035
      • Articulated Robots
        • Up To 100 Kg
        • 100 To 300 Kg
        • 300 To 500 Kg
        • Above 500 Kg
      • Collaborative Robots
        • Up To 10 Kg
        • 10 To 30 Kg
        • 30 To 50 Kg
        • Above 50 Kg
      • SCARA Robots
        • Up To 5 Kg
        • 5 To 10 Kg
        • 10 To 20 Kg
        • Above 20 Kg
      • Delta Robots
        • Up To 3 Kg
        • 3 To 6 Kg
        • Above 6 Kg
      • Gantry Robots
        • Up To 50 Kg
        • 50 To 150 Kg
        • Above 150 Kg
    • Y-o-Y Growth Trend Analysis By Robot Type , 2020 to 2024
    • Absolute $ Opportunity Analysis By Robot Type , 2025 to 2035
  7. Global Analysis 2020 to 2024 and Forecast 2025 to 2035, By Reach Range
    • Introduction / Key Findings
    • Historical Market Size Value (USD Million) Analysis By Reach Range, 2020 to 2024
    • Current and Future Market Size Value (USD Million) Analysis and Forecast By Reach Range, 2025 to 2035
      • Up To 1,000 Mm
      • 1,000 To 3,000 Mm
      • Above 3,000 Mm
    • Y-o-Y Growth Trend Analysis By Reach Range, 2020 to 2024
    • Absolute $ Opportunity Analysis By Reach Range, 2025 to 2035
  8. Global Analysis 2020 to 2024 and Forecast 2025 to 2035, By Material Type
    • Introduction / Key Findings
    • Historical Market Size Value (USD Million) Analysis By Material Type, 2020 to 2024
    • Current and Future Market Size Value (USD Million) Analysis and Forecast By Material Type, 2025 to 2035
      • Boxes/Cases
      • Bags/Sacks
      • Bundles
      • Others
    • Y-o-Y Growth Trend Analysis By Material Type, 2020 to 2024
    • Absolute $ Opportunity Analysis By Material Type, 2025 to 2035
  9. Global Analysis 2020 to 2024 and Forecast 2025 to 2035, By End-Use
    • Introduction / Key Findings
    • Historical Market Size Value (USD Million) Analysis By End-Use, 2020 to 2024
    • Current and Future Market Size Value (USD Million) Analysis and Forecast By End-Use, 2025 to 2035
      • Warehousing & Logistics
      • Manufacturing
        • Food & Beverages
        • FMCG
        • Chemicals & Materials
        • Pharmaceuticals
        • Electrical & Electronics Components
    • Y-o-Y Growth Trend Analysis By End-Use, 2020 to 2024
    • Absolute $ Opportunity Analysis By End-Use, 2025 to 2035
  10. Global Analysis 2020 to 2024 and Forecast 2025 to 2035, By Region
    • Introduction
    • Historical Market Size Value (USD Million) Analysis By Region, 2020 to 2024
    • Current Market Size Value (USD Million) Analysis and Forecast By Region, 2025 to 2035
      • North America
      • Latin America
      • Western Europe
      • Eastern Europe
      • East Asia
      • South Asia and Pacific
      • Middle East & Africa
    • Market Attractiveness Analysis By Region
  11. North America Analysis 2020 to 2024 and Forecast 2025 to 2035, By Country
    • Historical Market Size Value (USD Million) Trend Analysis By Market Taxonomy, 2020 to 2024
    • Market Size Value (USD Million) Forecast By Market Taxonomy, 2025 to 2035
      • By Country
        • USA
        • Canada
        • Mexico
      • By Robot Type
      • By Reach Range
      • By Material Type
      • By End-Use
    • Market Attractiveness Analysis
      • By Country
      • By Robot Type
      • By Reach Range
      • By Material Type
      • By End-Use
    • Key Takeaways
  12. Latin America Analysis 2020 to 2024 and Forecast 2025 to 2035, By Country
    • Historical Market Size Value (USD Million) Trend Analysis By Market Taxonomy, 2020 to 2024
    • Market Size Value (USD Million) Forecast By Market Taxonomy, 2025 to 2035
      • By Country
        • Brazil
        • Chile
        • Rest of Latin America
      • By Robot Type
      • By Reach Range
      • By Material Type
      • By End-Use
    • Market Attractiveness Analysis
      • By Country
      • By Robot Type
      • By Reach Range
      • By Material Type
      • By End-Use
    • Key Takeaways
  13. Western Europe Analysis 2020 to 2024 and Forecast 2025 to 2035, By Country
    • Historical Market Size Value (USD Million) Trend Analysis By Market Taxonomy, 2020 to 2024
    • Market Size Value (USD Million) Forecast By Market Taxonomy, 2025 to 2035
      • By Country
        • Germany
        • UK
        • Italy
        • Spain
        • France
        • Nordic
        • BENELUX
        • Rest of Western Europe
      • By Robot Type
      • By Reach Range
      • By Material Type
      • By End-Use
    • Market Attractiveness Analysis
      • By Country
      • By Robot Type
      • By Reach Range
      • By Material Type
      • By End-Use
    • Key Takeaways
  14. Eastern Europe Analysis 2020 to 2024 and Forecast 2025 to 2035, By Country
    • Historical Market Size Value (USD Million) Trend Analysis By Market Taxonomy, 2020 to 2024
    • Market Size Value (USD Million) Forecast By Market Taxonomy, 2025 to 2035
      • By Country
        • Russia
        • Poland
        • Hungary
        • Balkan & Baltic
        • Rest of Eastern Europe
      • By Robot Type
      • By Reach Range
      • By Material Type
      • By End-Use
    • Market Attractiveness Analysis
      • By Country
      • By Robot Type
      • By Reach Range
      • By Material Type
      • By End-Use
    • Key Takeaways
  15. East Asia Analysis 2020 to 2024 and Forecast 2025 to 2035, By Country
    • Historical Market Size Value (USD Million) Trend Analysis By Market Taxonomy, 2020 to 2024
    • Market Size Value (USD Million) Forecast By Market Taxonomy, 2025 to 2035
      • By Country
        • China
        • Japan
        • South Korea
      • By Robot Type
      • By Reach Range
      • By Material Type
      • By End-Use
    • Market Attractiveness Analysis
      • By Country
      • By Robot Type
      • By Reach Range
      • By Material Type
      • By End-Use
    • Key Takeaways
  16. South Asia and Pacific Analysis 2020 to 2024 and Forecast 2025 to 2035, By Country
    • Historical Market Size Value (USD Million) Trend Analysis By Market Taxonomy, 2020 to 2024
    • Market Size Value (USD Million) Forecast By Market Taxonomy, 2025 to 2035
      • By Country
        • India
        • ASEAN
        • Australia & New Zealand
        • Rest of South Asia and Pacific
      • By Robot Type
      • By Reach Range
      • By Material Type
      • By End-Use
    • Market Attractiveness Analysis
      • By Country
      • By Robot Type
      • By Reach Range
      • By Material Type
      • By End-Use
    • Key Takeaways
  17. Middle East & Africa Analysis 2020 to 2024 and Forecast 2025 to 2035, By Country
    • Historical Market Size Value (USD Million) Trend Analysis By Market Taxonomy, 2020 to 2024
    • Market Size Value (USD Million) Forecast By Market Taxonomy, 2025 to 2035
      • By Country
        • Kingdom of Saudi Arabia
        • Other GCC Countries
        • Turkiye
        • South Africa
        • Other African Union
        • Rest of Middle East & Africa
      • By Robot Type
      • By Reach Range
      • By Material Type
      • By End-Use
    • Market Attractiveness Analysis
      • By Country
      • By Robot Type
      • By Reach Range
      • By Material Type
      • By End-Use
    • Key Takeaways
  18. Key Countries Analysis
    • USA
      • Pricing Analysis
      • Market Share Analysis, 2024
        • By Robot Type
        • By Reach Range
        • By Material Type
        • By End-Use
    • Canada
      • Pricing Analysis
      • Market Share Analysis, 2024
        • By Robot Type
        • By Reach Range
        • By Material Type
        • By End-Use
    • Mexico
      • Pricing Analysis
      • Market Share Analysis, 2024
        • By Robot Type
        • By Reach Range
        • By Material Type
        • By End-Use
    • Brazil
      • Pricing Analysis
      • Market Share Analysis, 2024
        • By Robot Type
        • By Reach Range
        • By Material Type
        • By End-Use
    • Chile
      • Pricing Analysis
      • Market Share Analysis, 2024
        • By Robot Type
        • By Reach Range
        • By Material Type
        • By End-Use
    • Germany
      • Pricing Analysis
      • Market Share Analysis, 2024
        • By Robot Type
        • By Reach Range
        • By Material Type
        • By End-Use
    • UK
      • Pricing Analysis
      • Market Share Analysis, 2024
        • By Robot Type
        • By Reach Range
        • By Material Type
        • By End-Use
    • Italy
      • Pricing Analysis
      • Market Share Analysis, 2024
        • By Robot Type
        • By Reach Range
        • By Material Type
        • By End-Use
    • Spain
      • Pricing Analysis
      • Market Share Analysis, 2024
        • By Robot Type
        • By Reach Range
        • By Material Type
        • By End-Use
    • France
      • Pricing Analysis
      • Market Share Analysis, 2024
        • By Robot Type
        • By Reach Range
        • By Material Type
        • By End-Use
    • India
      • Pricing Analysis
      • Market Share Analysis, 2024
        • By Robot Type
        • By Reach Range
        • By Material Type
        • By End-Use
    • ASEAN
      • Pricing Analysis
      • Market Share Analysis, 2024
        • By Robot Type
        • By Reach Range
        • By Material Type
        • By End-Use
    • Australia & New Zealand
      • Pricing Analysis
      • Market Share Analysis, 2024
        • By Robot Type
        • By Reach Range
        • By Material Type
        • By End-Use
    • China
      • Pricing Analysis
      • Market Share Analysis, 2024
        • By Robot Type
        • By Reach Range
        • By Material Type
        • By End-Use
    • Japan
      • Pricing Analysis
      • Market Share Analysis, 2024
        • By Robot Type
        • By Reach Range
        • By Material Type
        • By End-Use
    • South Korea
      • Pricing Analysis
      • Market Share Analysis, 2024
        • By Robot Type
        • By Reach Range
        • By Material Type
        • By End-Use
    • Russia
      • Pricing Analysis
      • Market Share Analysis, 2024
        • By Robot Type
        • By Reach Range
        • By Material Type
        • By End-Use
    • Poland
      • Pricing Analysis
      • Market Share Analysis, 2024
        • By Robot Type
        • By Reach Range
        • By Material Type
        • By End-Use
    • Hungary
      • Pricing Analysis
      • Market Share Analysis, 2024
        • By Robot Type
        • By Reach Range
        • By Material Type
        • By End-Use
    • Kingdom of Saudi Arabia
      • Pricing Analysis
      • Market Share Analysis, 2024
        • By Robot Type
        • By Reach Range
        • By Material Type
        • By End-Use
    • Turkiye
      • Pricing Analysis
      • Market Share Analysis, 2024
        • By Robot Type
        • By Reach Range
        • By Material Type
        • By End-Use
    • South Africa
      • Pricing Analysis
      • Market Share Analysis, 2024
        • By Robot Type
        • By Reach Range
        • By Material Type
        • By End-Use
  19. Market Structure Analysis
    • Competition Dashboard
    • Competition Benchmarking
    • Market Share Analysis of Top Players
      • By Regional
      • By Robot Type
      • By Reach Range
      • By Material Type
      • By End-Use
  20. Competition Analysis
    • Competition Deep Dive
      • FANUC America Corp
        • Overview
        • Product Portfolio
        • Profitability by Market Segments (Product/Age /Sales Channel/Region)
        • Sales Footprint
        • Strategy Overview
          • Marketing Strategy
          • Product Strategy
          • Channel Strategy
      • KUKA Robotics Corp
      • Yaskawa America, Inc.
      • ABB Robotics
      • Universal Robots USA, Inc.
      • Kawasaki Robotics Inc.
      • Stäubli Robotics
      • Columbia/Okura
      • FUJI Robotics
      • SCOTT Technology
      • FlexLink Systems, Inc.
      • Sage Automation
      • Kraken Automation
      • OnRobot US Inc.
      • Berobox
      • JLS Automation
      • Kassow Robots
  21. Assumptions & Acronyms Used
  22. Research Methodology

List of Tables

  • Table 1: Global Value (USD Million) Forecast by Region, 2020-2035
  • Table 2: Global Value (USD Million) Forecast by Robot Type , 2020-2035
  • Table 3: Global Value (USD Million) Forecast by Reach Range, 2020-2035
  • Table 4: Global Value (USD Million) Forecast by Material Type, 2020-2035
  • Table 5: Global Value (USD Million) Forecast by End-Use, 2020-2035
  • Table 6: North America Value (USD Million) Forecast by Country, 2020-2035
  • Table 7: North America Value (USD Million) Forecast by Robot Type , 2020-2035
  • Table 8: North America Value (USD Million) Forecast by Reach Range, 2020-2035
  • Table 9: North America Value (USD Million) Forecast by Material Type, 2020-2035
  • Table 10: North America Value (USD Million) Forecast by End-Use, 2020-2035
  • Table 11: Latin America Value (USD Million) Forecast by Country, 2020-2035
  • Table 12: Latin America Value (USD Million) Forecast by Robot Type , 2020-2035
  • Table 13: Latin America Value (USD Million) Forecast by Reach Range, 2020-2035
  • Table 14: Latin America Value (USD Million) Forecast by Material Type, 2020-2035
  • Table 15: Latin America Value (USD Million) Forecast by End-Use, 2020-2035
  • Table 16: Western Europe Value (USD Million) Forecast by Country, 2020-2035
  • Table 17: Western Europe Value (USD Million) Forecast by Robot Type , 2020-2035
  • Table 18: Western Europe Value (USD Million) Forecast by Reach Range, 2020-2035
  • Table 19: Western Europe Value (USD Million) Forecast by Material Type, 2020-2035
  • Table 20: Western Europe Value (USD Million) Forecast by End-Use, 2020-2035
  • Table 21: Eastern Europe Value (USD Million) Forecast by Country, 2020-2035
  • Table 22: Eastern Europe Value (USD Million) Forecast by Robot Type , 2020-2035
  • Table 23: Eastern Europe Value (USD Million) Forecast by Reach Range, 2020-2035
  • Table 24: Eastern Europe Value (USD Million) Forecast by Material Type, 2020-2035
  • Table 25: Eastern Europe Value (USD Million) Forecast by End-Use, 2020-2035
  • Table 26: East Asia Value (USD Million) Forecast by Country, 2020-2035
  • Table 27: East Asia Value (USD Million) Forecast by Robot Type , 2020-2035
  • Table 28: East Asia Value (USD Million) Forecast by Reach Range, 2020-2035
  • Table 29: East Asia Value (USD Million) Forecast by Material Type, 2020-2035
  • Table 30: East Asia Value (USD Million) Forecast by End-Use, 2020-2035
  • Table 31: South Asia and Pacific Value (USD Million) Forecast by Country, 2020-2035
  • Table 32: South Asia and Pacific Value (USD Million) Forecast by Robot Type , 2020-2035
  • Table 33: South Asia and Pacific Value (USD Million) Forecast by Reach Range, 2020-2035
  • Table 34: South Asia and Pacific Value (USD Million) Forecast by Material Type, 2020-2035
  • Table 35: South Asia and Pacific Value (USD Million) Forecast by End-Use, 2020-2035
  • Table 36: Middle East & Africa Value (USD Million) Forecast by Country, 2020-2035
  • Table 37: Middle East & Africa Value (USD Million) Forecast by Robot Type , 2020-2035
  • Table 38: Middle East & Africa Value (USD Million) Forecast by Reach Range, 2020-2035
  • Table 39: Middle East & Africa Value (USD Million) Forecast by Material Type, 2020-2035
  • Table 40: Middle East & Africa Value (USD Million) Forecast by End-Use, 2020-2035

List of Figures

  • Figure 1: Global Pricing Analysis
  • Figure 2: Global Value (USD Million) Forecast 2020-2035
  • Figure 3: Global Value Share and BPS Analysis by Robot Type , 2025 and 2035
  • Figure 4: Global Y-o-Y Growth Comparison by Robot Type , 2025-2035
  • Figure 5: Global Attractiveness Analysis by Robot Type
  • Figure 6: Global Value Share and BPS Analysis by Reach Range, 2025 and 2035
  • Figure 7: Global Y-o-Y Growth Comparison by Reach Range, 2025-2035
  • Figure 8: Global Attractiveness Analysis by Reach Range
  • Figure 9: Global Value Share and BPS Analysis by Material Type, 2025 and 2035
  • Figure 10: Global Y-o-Y Growth Comparison by Material Type, 2025-2035
  • Figure 11: Global Attractiveness Analysis by Material Type
  • Figure 12: Global Value Share and BPS Analysis by End-Use, 2025 and 2035
  • Figure 13: Global Y-o-Y Growth Comparison by End-Use, 2025-2035
  • Figure 14: Global Attractiveness Analysis by End-Use
  • Figure 15: Global Value (USD Million) Share and BPS Analysis by Region, 2025 and 2035
  • Figure 16: Global Y-o-Y Growth Comparison by Region, 2025-2035
  • Figure 17: Global Attractiveness Analysis by Region
  • Figure 18: North America Incremental Dollar Opportunity, 2025-2035
  • Figure 19: Latin America Incremental Dollar Opportunity, 2025-2035
  • Figure 20: Western Europe Incremental Dollar Opportunity, 2025-2035
  • Figure 21: Eastern Europe Incremental Dollar Opportunity, 2025-2035
  • Figure 22: East Asia Incremental Dollar Opportunity, 2025-2035
  • Figure 23: South Asia and Pacific Incremental Dollar Opportunity, 2025-2035
  • Figure 24: Middle East & Africa Incremental Dollar Opportunity, 2025-2035
  • Figure 25: North America Value Share and BPS Analysis by Country, 2025 and 2035
  • Figure 26: North America Value Share and BPS Analysis by Robot Type , 2025 and 2035
  • Figure 27: North America Y-o-Y Growth Comparison by Robot Type , 2025-2035
  • Figure 28: North America Attractiveness Analysis by Robot Type
  • Figure 29: North America Value Share and BPS Analysis by Reach Range, 2025 and 2035
  • Figure 30: North America Y-o-Y Growth Comparison by Reach Range, 2025-2035
  • Figure 31: North America Attractiveness Analysis by Reach Range
  • Figure 32: North America Value Share and BPS Analysis by Material Type, 2025 and 2035
  • Figure 33: North America Y-o-Y Growth Comparison by Material Type, 2025-2035
  • Figure 34: North America Attractiveness Analysis by Material Type
  • Figure 35: North America Value Share and BPS Analysis by End-Use, 2025 and 2035
  • Figure 36: North America Y-o-Y Growth Comparison by End-Use, 2025-2035
  • Figure 37: North America Attractiveness Analysis by End-Use
  • Figure 38: Latin America Value Share and BPS Analysis by Country, 2025 and 2035
  • Figure 39: Latin America Value Share and BPS Analysis by Robot Type , 2025 and 2035
  • Figure 40: Latin America Y-o-Y Growth Comparison by Robot Type , 2025-2035
  • Figure 41: Latin America Attractiveness Analysis by Robot Type
  • Figure 42: Latin America Value Share and BPS Analysis by Reach Range, 2025 and 2035
  • Figure 43: Latin America Y-o-Y Growth Comparison by Reach Range, 2025-2035
  • Figure 44: Latin America Attractiveness Analysis by Reach Range
  • Figure 45: Latin America Value Share and BPS Analysis by Material Type, 2025 and 2035
  • Figure 46: Latin America Y-o-Y Growth Comparison by Material Type, 2025-2035
  • Figure 47: Latin America Attractiveness Analysis by Material Type
  • Figure 48: Latin America Value Share and BPS Analysis by End-Use, 2025 and 2035
  • Figure 49: Latin America Y-o-Y Growth Comparison by End-Use, 2025-2035
  • Figure 50: Latin America Attractiveness Analysis by End-Use
  • Figure 51: Western Europe Value Share and BPS Analysis by Country, 2025 and 2035
  • Figure 52: Western Europe Value Share and BPS Analysis by Robot Type , 2025 and 2035
  • Figure 53: Western Europe Y-o-Y Growth Comparison by Robot Type , 2025-2035
  • Figure 54: Western Europe Attractiveness Analysis by Robot Type
  • Figure 55: Western Europe Value Share and BPS Analysis by Reach Range, 2025 and 2035
  • Figure 56: Western Europe Y-o-Y Growth Comparison by Reach Range, 2025-2035
  • Figure 57: Western Europe Attractiveness Analysis by Reach Range
  • Figure 58: Western Europe Value Share and BPS Analysis by Material Type, 2025 and 2035
  • Figure 59: Western Europe Y-o-Y Growth Comparison by Material Type, 2025-2035
  • Figure 60: Western Europe Attractiveness Analysis by Material Type
  • Figure 61: Western Europe Value Share and BPS Analysis by End-Use, 2025 and 2035
  • Figure 62: Western Europe Y-o-Y Growth Comparison by End-Use, 2025-2035
  • Figure 63: Western Europe Attractiveness Analysis by End-Use
  • Figure 64: Eastern Europe Value Share and BPS Analysis by Country, 2025 and 2035
  • Figure 65: Eastern Europe Value Share and BPS Analysis by Robot Type , 2025 and 2035
  • Figure 66: Eastern Europe Y-o-Y Growth Comparison by Robot Type , 2025-2035
  • Figure 67: Eastern Europe Attractiveness Analysis by Robot Type
  • Figure 68: Eastern Europe Value Share and BPS Analysis by Reach Range, 2025 and 2035
  • Figure 69: Eastern Europe Y-o-Y Growth Comparison by Reach Range, 2025-2035
  • Figure 70: Eastern Europe Attractiveness Analysis by Reach Range
  • Figure 71: Eastern Europe Value Share and BPS Analysis by Material Type, 2025 and 2035
  • Figure 72: Eastern Europe Y-o-Y Growth Comparison by Material Type, 2025-2035
  • Figure 73: Eastern Europe Attractiveness Analysis by Material Type
  • Figure 74: Eastern Europe Value Share and BPS Analysis by End-Use, 2025 and 2035
  • Figure 75: Eastern Europe Y-o-Y Growth Comparison by End-Use, 2025-2035
  • Figure 76: Eastern Europe Attractiveness Analysis by End-Use
  • Figure 77: East Asia Value Share and BPS Analysis by Country, 2025 and 2035
  • Figure 78: East Asia Value Share and BPS Analysis by Robot Type , 2025 and 2035
  • Figure 79: East Asia Y-o-Y Growth Comparison by Robot Type , 2025-2035
  • Figure 80: East Asia Attractiveness Analysis by Robot Type
  • Figure 81: East Asia Value Share and BPS Analysis by Reach Range, 2025 and 2035
  • Figure 82: East Asia Y-o-Y Growth Comparison by Reach Range, 2025-2035
  • Figure 83: East Asia Attractiveness Analysis by Reach Range
  • Figure 84: East Asia Value Share and BPS Analysis by Material Type, 2025 and 2035
  • Figure 85: East Asia Y-o-Y Growth Comparison by Material Type, 2025-2035
  • Figure 86: East Asia Attractiveness Analysis by Material Type
  • Figure 87: East Asia Value Share and BPS Analysis by End-Use, 2025 and 2035
  • Figure 88: East Asia Y-o-Y Growth Comparison by End-Use, 2025-2035
  • Figure 89: East Asia Attractiveness Analysis by End-Use
  • Figure 90: South Asia and Pacific Value Share and BPS Analysis by Country, 2025 and 2035
  • Figure 91: South Asia and Pacific Value Share and BPS Analysis by Robot Type , 2025 and 2035
  • Figure 92: South Asia and Pacific Y-o-Y Growth Comparison by Robot Type , 2025-2035
  • Figure 93: South Asia and Pacific Attractiveness Analysis by Robot Type
  • Figure 94: South Asia and Pacific Value Share and BPS Analysis by Reach Range, 2025 and 2035
  • Figure 95: South Asia and Pacific Y-o-Y Growth Comparison by Reach Range, 2025-2035
  • Figure 96: South Asia and Pacific Attractiveness Analysis by Reach Range
  • Figure 97: South Asia and Pacific Value Share and BPS Analysis by Material Type, 2025 and 2035
  • Figure 98: South Asia and Pacific Y-o-Y Growth Comparison by Material Type, 2025-2035
  • Figure 99: South Asia and Pacific Attractiveness Analysis by Material Type
  • Figure 100: South Asia and Pacific Value Share and BPS Analysis by End-Use, 2025 and 2035
  • Figure 101: South Asia and Pacific Y-o-Y Growth Comparison by End-Use, 2025-2035
  • Figure 102: South Asia and Pacific Attractiveness Analysis by End-Use
  • Figure 103: Middle East & Africa Value Share and BPS Analysis by Country, 2025 and 2035
  • Figure 104: Middle East & Africa Value Share and BPS Analysis by Robot Type , 2025 and 2035
  • Figure 105: Middle East & Africa Y-o-Y Growth Comparison by Robot Type , 2025-2035
  • Figure 106: Middle East & Africa Attractiveness Analysis by Robot Type
  • Figure 107: Middle East & Africa Value Share and BPS Analysis by Reach Range, 2025 and 2035
  • Figure 108: Middle East & Africa Y-o-Y Growth Comparison by Reach Range, 2025-2035
  • Figure 109: Middle East & Africa Attractiveness Analysis by Reach Range
  • Figure 110: Middle East & Africa Value Share and BPS Analysis by Material Type, 2025 and 2035
  • Figure 111: Middle East & Africa Y-o-Y Growth Comparison by Material Type, 2025-2035
  • Figure 112: Middle East & Africa Attractiveness Analysis by Material Type
  • Figure 113: Middle East & Africa Value Share and BPS Analysis by End-Use, 2025 and 2035
  • Figure 114: Middle East & Africa Y-o-Y Growth Comparison by End-Use, 2025-2035
  • Figure 115: Middle East & Africa Attractiveness Analysis by End-Use
  • Figure 116: Global - Tier Structure Analysis
  • Figure 117: Global - Company Share Analysis
Dashboard
Dashboard
Dashboard
Dashboard
Dashboard
Dashboard

Full Research Suite comprises of:

Market outlook & trends analysis

Market outlook & trends analysis

Interviews & case studies

Interviews & case studies

Strategic recommendations

Strategic recommendations

Vendor profiles & capabilities analysis

Vendor profiles & capabilities analysis

5-year forecasts

5-year forecasts

8 regions and 60+ country-level data splits

8 regions and 60+ country-level data splits

Market segment data splits

Market segment data splits

12 months of continuous data updates

12 months of continuous data updates

DELIVERED AS:

PDF EXCEL ONLINE

Full Research Suite


$5000

$7500

$10000

Buy Report Now
Similar Industry Reports

Similar Industry Reports

Palletizing Machines Market

Palletizing Machines Market Growth & Demand 2025 to 2035

Palletizing Systems Market

Palletizing Systems Market Growth - Trends & Forecast 2025 to 2035

Palletizing Robots Market

Palletizing Robots Market Size and Share Forecast Outlook 2025 to 2035

Robotic Warfare Market

Robotic Warfare Market Size and Share Forecast Outlook 2025 to 2035

Robotic Lawn Mower Market

Robotic Lawn Mower Market Size and Share Forecast Outlook 2025 to 2035

Robotic Rehab Tools Market

Robotic Rehab Tools Market Analysis - Size, Share, and Forecast Outlook 2025 to 2035

Robotics-Assisted Telesurgery Market

Robotics-Assisted Telesurgery Market Size and Share Forecast Outlook 2025 to 2035

Robot Assisted Surgical Microscope Market

Robot Assisted Surgical Microscope Market Size and Share Forecast Outlook 2025 to 2035

Robotic Assisted Endovascular Systems Market

Robotic Assisted Endovascular Systems Market Size and Share Forecast Outlook 2025 to 2035

Robotic Lung Biopsy Market

Robotic Lung Biopsy Market Size and Share Forecast Outlook 2025 to 2035

Robotics as a Service (RaaS) Market

Robotics as a Service (RaaS) Market Size and Share Forecast Outlook 2025 to 2035

Robotic X-ray Scanner Market

Robotic X-ray Scanner Market Size and Share Forecast Outlook 2025 to 2035

Robotic Catheterization Systems Market

Robotic Catheterization Systems Market Growth – Innovations, Trends & Forecast 2025-2035

Robot Sensor Market
Robot Sensor Market

Robot Sensor Market Size and Share Forecast Outlook 2025 to 2035

Robotaxi Market
Robotaxi Market

Robotaxi Market Size and Share Forecast Outlook 2025 to 2035

Robot Market
Robot Market

Robot Market Size and Share Forecast Outlook 2025 to 2035

Robotic Vision Market

Robotic Vision Market Size and Share Forecast Outlook 2025 to 2035

Robotics Actuators Market

Robotics Actuators Market Size and Share Forecast Outlook 2025 to 2035

Robotic Biopsy Devices Market

Robotic Biopsy Devices Market Insights - Trends & Forecast 2025 to 2035

Robotic Palletizers & De-Palletizers Market

Robotic Palletizers & De-Palletizers Market Growth - Forecast 2025 to 2035

Future Market Insights

Palletizing Robot Industry Analysis in North America

Chat With MaRIA

Chat With

MaRIA

Hi There, I am MaRIA, Your Market Research Intelligence Assistant. How may I help you?