Reports

- Global Locations -

Headquarters

Future Market Insights, Inc.

Christiana Corporate, 200
Continental Drive, Suite 401,
Newark, Delaware - 19713,
United States

T: +1-845-579-5705

Americas

Future Market Insights, Inc.

616 Corporate Way, Suite 2-9018,
Valley Cottage, NY 10989, United States

T: +1-347-918-3531

MEA

Future Market Insights

1602-6 Jumeirah Bay X2 Tower, Plot No: JLT-PH2-X2A,
Jumeirah Lakes Towers, Dubai,
United Arab Emirates

Europe

Future Market Insights

3rd Floor, 207 Regent Street,
W1B 3HH London
United Kingdom

T: + 44 (0) 20 8123 9659
D: +44 (0) 20 3287 4268

Asia Pacific

Future Market Insights

IndiaLand Global Tech Park, Unit UG-1, Behind Grand HighStreet, Phase 1, Hinjawadi, MH, Pune – 411057, India

Robot-assisted Surgical Microscope Market Outlook (2023 to 2033)

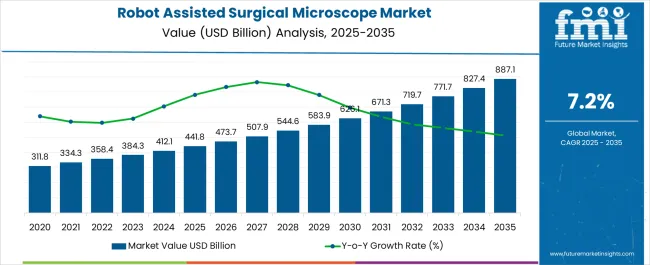
The robot-assisted surgical microscope market size is projected to be worth US$ 410.6 million in 2023. The market is likely to surpass US$ 858.0 million by 2033 at a CAGR of 7.6% during the forecast period. The market for robotics-assisted surgical microscopes is a rapidly growing segment within the broader medical device industry. These advanced surgical microscopes incorporate robotic technology to enhance surgical precision, improve outcomes, and enable minimally invasive procedures.

The market for robotics-assisted surgical microscopes is poised for substantial growth as healthcare providers and surgeons recognize the potential benefits of these advanced systems. Continued technological advancements, increasing market competition, and expanding applications are likely to shape the future of this market.

Other Drivers Propelling the Demand for Robot-assisted Surgical Microscope Market include:

  • Robotic-assisted surgical microscopes allow for minimally invasive treatments, which have advantages such as smaller incisions, less trauma, faster healing, and shorter hospital stays. Demand for these devices is being driven by patients' and doctors' increased preference for less invasive operations.
  • By offering increased visualization, magnification, and image-guided navigation, robotic-assisted surgical microscopes can improve surgical results. These technologies allow surgeons to execute surgeries with higher precision and accuracy, resulting in fewer problems, increased patient safety, and improved overall results.
  • The rising frequency of chronic ailments such as cardiovascular disease, orthopedic issues, and various forms of cancer is boosting demand for surgical procedures. Robotic-assisted surgical microscopes can help surgeons undertake difficult procedures connected to certain disorders, which will lead to further adoption.

Challenges for Companies /Manufacturers in the Robot-assisted Surgical Microscope Market:

  • The acceptability and competency of surgeons in employing robotics-assisted surgical microscopes is critical to their effective deployment. Resistance or a lack of training opportunities among surgeons may hamper their wider adoption.
  • In some healthcare systems or locations, the lack of comprehensive reimbursement regulations for robotics-assisted surgical microscopes might limit their use. If surgeons and hospitals are not adequately compensated for using these technologies, it may inhibit their broad adoption.
  • The initial investment, maintenance, and training expenditures for robotics-assisted surgical microscopes can be significant. This high cost might be a deterrent to adoption, particularly for healthcare organisations with restricted budgets or payment coverage.

Opportunities in the Robot-assisted Surgical Microscope Market Industry:

  • Advanced visualization and imaging technologies are being integrated into robotic-assisted surgical microscopes. These features enable surgeons to perform accurate surgical operations by providing comprehensive real-time visualization. Further improvements in imaging and visualization technology present an opportunity.
  • The world population is ageing, and chronic illnesses are becoming more common. Robotic-assisted surgical microscopes can help with complicated procedures for a variety of illnesses.
  • Adoption of high-tech medical equipment for surgical procedures by healthcare professionals will provide a significant potential for the robotic aided surgical microscopy industry.

Latest Trends in the Robot-assisted Surgical Microscope Market:

  • The tendency is towards the development of modular robotic platforms and systems that can be customized and adapted for various surgical specialties and procedures. This adaptability enables surgeons to adjust the system to their individual requirements while also expanding its applicability across many surgical fields.
  • The progress of robotics-assisted surgical microscopes is making remote and tele-surgery possible, allowing surgeons to do surgeries from a faraway location. This trend creates chances for greater access to surgical expertise in underprivileged regions, surgical collaboration, and training opportunities.
  • To allow advanced capabilities such as autonomous motion planning, decision support, and predictive analytics, algorithms based on machine learning and AI are being incorporated into robotics-assisted surgical microscopes. These technologies have the potential to increase surgical accuracy, expedite processes, and result in better surgical results.
Attributes Details
Robot-assisted Surgical Microscope Market Size (2023) US$ 410.6 million
Robot-assisted Surgical Microscope Market Projected Size (2033) US$ 858.0 million
Value CAGR (2023 to 2033) 7.6%

Don't pay for what you don't need

Customize your report by selecting specific countries or regions and save 30%!

2012 to 2022 Robot-assisted Surgical Microscope Market Demand Outlook Compared to 2023 to 2033 Forecast

From 2012 to 2022, the global robot-assisted surgical microscope market experienced a CAGR of 4.2%, reaching a market size of US$ 410.6 million in 2023.

From 2012 to 2022, the global robot-assisted surgical microscope market industry witnessed steady growth due to the increased advancements in robotics surgeries. The market for robotics-assisted surgical microscopes is relatively new and has experienced significant growth in recent years. The adoption of robotics-assisted surgical systems, including microscopes, has been driven by advancements in robotics technology, increasing demand for minimally invasive surgeries, and the need for improved surgical precision.

Future Forecast for Robot-assisted Surgical Microscope Market Industry:

Looking ahead, the global robot-assisted surgical microscope market industry is expected to rise at a CAGR of 7.6% from 2023 to 2033. During the forecast period, the market size is expected to reach US$ 858.0 million by 2033.

The robot-assisted surgical microscope market industry is expected to continue its growth trajectory from 2023 to 2033. Beyond the original uses, robotic-assisted surgical microscopes are constantly being improved and modified for a larger variety of surgical operations. The market potential for these devices is expected to grow as they are used in orthopedics, neurosurgery, cardiovascular surgery, and other specialties. The adoption rate of robotics-assisted surgical microscopes is projected to rise as surgeons gain more skill and confidence in utilizing them. Surgeon training programs and increased familiarity with these technologies might help to increase acceptability and utilization, resulting in market growth.
Comparative View of the Robot-assisted Surgical Microscope Market

Robot-assisted Surgical Microscope Market:

Attributes Robot-assisted Surgical Microscope Market
CAGR (2023 to 2033) 7.6%
Market Value (2033) US$ 858.0 Million
Opportunity Adoption of high-tech medical equipment for surgical procedures by healthcare professionals will provide a significant potential for the robotic aided surgical microscopy industry.
Key Trends The tendency is towards the development of modular robotic platforms and systems that can be customized and adapted for various surgical specialties and procedures. This adaptability enables surgeons to adjust the system to their individual requirements while also expanding its applicability across many surgical fields.

3D Surgical Microscopic Systems Market:

Attributes 3D Surgical Microscopic Systems Market
CAGR (2023 to 2033) 10.1%
Market Value (2033) US$ 3.3 Billion
Opportunity Rising disease incidences, infection rates, increasing demand for improved diagnostic techniques, increasing spending on healthcare, government funding, and rising research and development efforts are some of the key opportunities of the market.
Key Trends Increased diagnostics laboratory infrastructure in developed nations is one the major trend in the market.

Microscope Digital Cameras Market:

Attributes Microscope Digital Cameras Market
CAGR (2023 to 2033) 9.1%
Market Value (2033) US$ 2.0 Billion
Opportunity Increasing prevalence of various chronic diseases, across the globe are the key market opportunities.
Key Trends Increasing adoption rate of microscope digital cameras in the healthcare sector and life science will assist in propelling the demand for microscope digital cameras in the market
Sabyasachi Ghosh
Sabyasachi Ghosh

Principal Consultant

Talk to Analyst

Find your sweet spots for generating winning opportunities in this market.

Country-Wise Insights

Robot-assisted Surgical Microscope Market to Surge in the United States Due to Rising Prevalence of Chronic Diseases.

Country The United States
Market Size (US$ million) by End of Forecast Period (2033) US$ 215.0 million
CAGR % 2023 to End of Forecast (2033) 4.5%

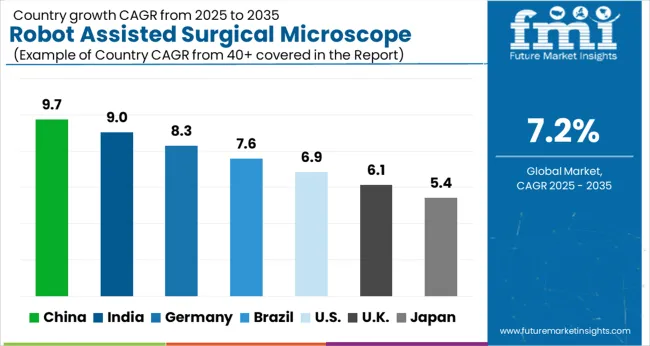
The robot-assisted surgical microscope market industry in the United States is expected to reach a market size of US$ 215.0 million by 2033, expanding at a CAGR of 4.5%. Due to the increasing incidence of chronic diseases nationwide the market is on the rise. The increased frequency of chronic illnesses such as cancer, cardiovascular disease, and neurological problems is driving the demand for better surgical technology. Robotic-assisted surgical microscopes enable surgeons to conduct difficult procedures with higher accuracy, leading to market growth.

Rising Demand for Robot-assisted Surgical Microscope Market is Due to the Increasing Demand for Precision and Efficiency.

Country The United Kingdom
Market Size (US$ million) by End of Forecast Period (2033) US$ 37.4 million
CAGR % 2023 to End of Forecast (2033) 4.6%

The robot-assisted surgical microscope market industry in the United Kingdom is expected to reach a market value of US$ 37.4 million, expanding at a CAGR of 4.6% during the forecast period. The United Kingdom market is projected to growth of the market due to the growing personalized medicine initiatives. With a greater emphasis on patient safety and surgical results, there is an increased need for surgical technologies that provide accurate visualization, increased dexterity, and improved surgical precision. These needs are met by robotic-assisted surgical microscopes, which are becoming more popular in the UK market.

Notable Growth Expected in China's Robot-assisted Surgical Microscope Market Growing Development in Diagnostic Settings.

Country China
Market Size (US$ million) by End of Forecast Period (2033) US$ 45.1 million
CAGR % 2023 to End of Forecast (2033) 7.8%

The robot-assisted surgical microscope market industry in China is anticipated to reach a market size of US$ 45.1 million, moving at a CAGR of 7.8% during the forecast period. Chinese market is expanding predominantly due to the high demand for stereomicroscopes across various healthcare industries. Further, growing investments by government organizations for the development of diagnostic settings, and collaborative efforts for microscopy research have further boosted the market in this region. Emergence of advanced technologies such as artificial intelligence in automated microscopy, growing usage of scanning tunneling microscopes along with favorable business climate is likely to boost the market further.
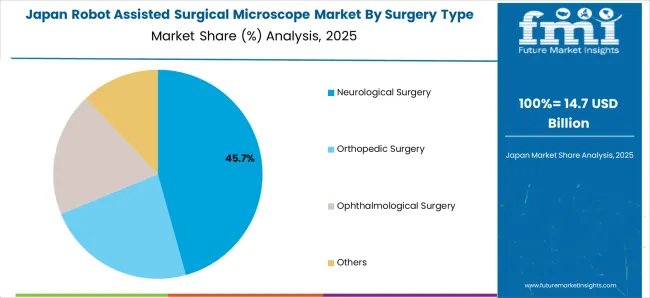
Surge in Surge in Surgical Procedures to Drive Market Growth in Japan

Country Japan
Market Size (US$ million) by End of Forecast Period (2033) US$ 35.0 million
CAGR % 2023 to End of Forecast (2033) 7.6%

The robot-assisted surgical microscope market industry in Japan is estimated to reach a market size of US$ 35.0 million by 2033, thriving at a CAGR of 7.6%. The market in Japan is predicted to grow because of the surge in surgical procedures. Various causes, including increased healthcare knowledge and changing lifestyle habits, have contributed to an increase in surgical operations in Japan. Robotic-assisted surgical microscopes let surgeons conduct difficult procedures with greater visibility and precision, which contributes to market growth.

Demand for Robot-assisted Surgical Microscope Market is Rising Due to Increasing Minimally Invasive Procedures.

Country South Korea
Market Size (US$ million) by End of Forecast Period (2033) US$ 22.7 million
CAGR % 2023 to End of Forecast (2033) 7.4%

The robot-assisted surgical microscope market industry in South Korea is expected to reach a market size of US$ 22.7 million, expanding at a CAGR of 7.4% during the forecast period. Minimally invasive procedures have grown in popularity due to advantages such as smaller incisions, less discomfort, shorter hospital stays, and quicker recovery. Robotic-assisted surgical microscopes play an important role in easing these operations, resulting in greater usage and market development.

Category-Wise Insights

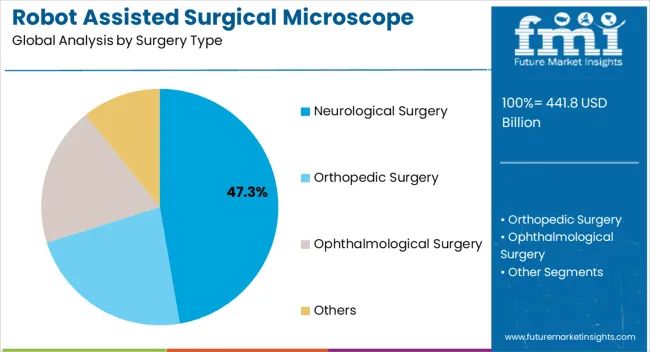
Other Surgeries to Dominate Robot-assisted Surgical Microscope Market Industry with 29.2% Market Share in 2022

The other surgeries such as cardiovascular surgeries and various tumor surgeries is dominating the robot-assisted surgical microscope market industry with a market share of 29.2% in 2022. Due to its high adoption by the healthcare professionals to enhance the surgical precision and improve patient outcomes.

This devices provide surgeons with high definition, thee-dimensional visualization of the surgical field, allowing for precise identification and anastomosis of grafts.

Which End User Is Widely Adopting Robot-assisted Surgical Microscopes?

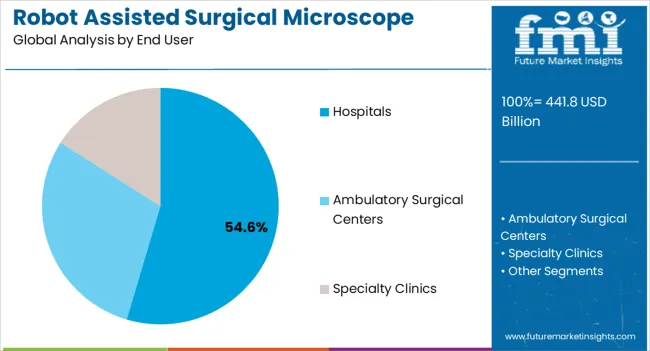
The hospitals is dominating the robot-assisted surgical microscope market with the market share of 51.1% in 2022. This growth is due to high adoption of these microscopes in the hospitals. The usage of robotic assisted surgical microscopes in hospitals is driven by the aim to improve surgical outcomes, enhance visualization, facilitate minimally invasive techniques, and promote precision in various surgical specialties. As technology advances and surgical techniques continue to evolve, the adoption of these microscopes is expected to grow further, which may enhance the adoption in hospitals.
Get the data you need at a Fraction of the cost

Personalize your report by choosing insights you need
and save 40%!

How Key Players Stay Competitive in the Robot-assisted Surgical Microscope Market Industry?

The robot-assisted surgical microscope sector is fiercely competitive, with many companies fighting for market dominance. To stay ahead of the competition in such a circumstance, essential players must employ smart techniques.

Key Strategies Used by the Participants

  • Product Development

Key players invest heavily in research and development activities to continuously innovate and improve their robotics-assisted surgical microscopes. They focus on enhancing imaging capabilities, developing advanced features, improving ergonomics, and integrating with other surgical systems. Research and development efforts allow them to stay at the forefront of technology and offer cutting-edge solutions to healthcare providers.

  • Strategic Alliances & Collaborations

Collaboration with healthcare institutions, surgeons, and research organizations is crucial for key players to gain insights into clinical needs and emerging trends. By partnering with key stakeholders, they can develop tailored solutions that address specific surgical requirements, optimize workflow, and enhance patient outcomes. Collaborations also help in expanding their market presence and accessing new customer segments.

  • Expansion into Emerging Markets

Key players strive to expand their market presence by entering new geographical regions and target markets. They identify growth opportunities, conduct market research, and develop strategies to penetrate new markets effectively. This may involve establishing partnerships with distributors, engaging in mergers and acquisitions, or setting up local manufacturing facilities to cater to regional demands.

  • Acquisitions and mergers

Key companies in the robot-assisted surgical microscope market routinely employ mergers and acquisitions to strengthen their market positions, broaden their product offerings, and enter new markets.

Key Players in the Robot-assisted Surgical Microscope Market Industry

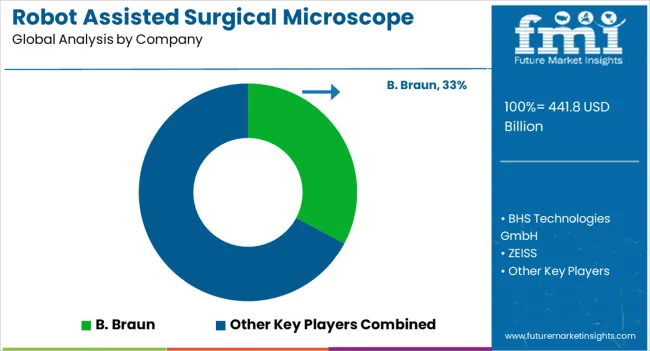
  • B. Braun
  • BHS Technologies GmbH
  • ZEISS

Key Developments in the Robot-assisted Surgical Microscope Market:

  • In Oct. 2020, The Centre Valley, Pennsylvania-based Aesculap, Inc. (B. Braun) is introducing the Aesculap AeosTM robotic digital microscope.

Segmentation Analysis of the Robot-assisted Surgical Microscope Market

By Surgery Type:

  • Neurological Surgery
  • Orthopedic Surgery
  • Ophthalmological Surgery
  • Others
  • Others

By End User:

  • Hospitals
  • Ambulatory Surgical Centers
  • Specialty Clinics

By Region:

  • North America
  • Latin America
  • Europe
  • East Asia
  • South Asia
  • Oceania
  • The Middle East & Africa

Frequently Asked Questions

What is the size of the Robot Assisted Surgical Microscope Market?

The market size is estimated to reach US$ 410.6 million by 2023-end.

What propels Growth in the Robot Assisted Surgical Microscope Market?

Continued technological advancements, increasing market competition, and expanding applications propel market growth.

What are the Key Challenges for Companies in the Robot-assisted Surgical Microscope Market?

The competency of surgeons, lack of comprehensive reimbursement regulations, high initial investment, and training expenditures hinder market growth.

What will be the size of the Robot Assisted Surgical Microscope Market in 2033?

The market is expected to secure US$ 858 million by 2033.

What is the Projected Market Size of the United Kingdom Robot-assisted Surgical Microscope Market?

The market in the United Kingdom is expected to secure US$ 37.4 million by 2033.

Table of Content

1. Executive Summary

    1.1. Global Market Outlook

    1.2. Demand Side Trends

    1.3. Supply Side Trends

    1.4. Analysis and Recommendations

2. Market Overview

    2.1. Market Coverage / Taxonomy

    2.2. Market Definition / Scope / Limitations

    2.3. Inclusions and Exclusions

3. Key Market Trends

    3.1. Key Trends Impacting the Market

    3.2. Product Innovation / Development Trends

4. Value Added Insights

    4.1. Product Adoption / Usage Analysis

    4.2. Product Features/ USPs

    4.3. Installed Base Scenario

    4.4. Technological Roadmap

    4.5. Reimbursement Scenario

    4.6. Regulatory Landscape

    4.7. PESTEL Analysis

    4.8. Porter’s Analysis

5. Market Background

    5.1. Macro-Economic Factors

        5.1.1. Global Healthcare Expenditure Outlook

        5.1.2. Global Medical Device Outlook

        5.1.3. Global Life Expectancy Outlook

    5.2. Forecast Factors - Relevance & Impact

        5.2.1. Key Player’s Historic Growth

        5.2.2. Growing Adoption by Surgeons

        5.2.3. Favourable Government Regulations

        5.2.4. Rising Demand for Minimally Invasive Procedures

        5.2.5. Technological Advancement in the Devices

        5.2.6. Increasing Healthcare Infrastructure

    5.3. Dynamics

        5.3.1. Drivers

        5.3.2. Restraints

        5.3.3. Opportunity Analysis

6. Global Market Volume (in Units) Analysis 2012 to 2022 and Forecast, 2023 to 2033

    6.1. Historical Volume (in Units) Analysis, 2012 to 2022

    6.2. Current and Future Volume (in Units) Projections, 2023 to 2033

        6.2.1. Y-o-Y Growth Trend Analysis

7. Global Market - Pricing Analysis

    7.1. Regional Pricing Analysis

    7.2. Pricing Break-up

        7.2.1. Manufacturer Level Pricing

        7.2.2. Distributor Level Pricing

    7.3. Global Average Pricing Analysis Benchmark

    7.4. Pricing Assumptions

8. Global Market Demand (in Value or Size in US$ Mn) Analysis 2012 to 2022 and Forecast, 2023 to 2033

    8.1. Historical Market Value (US$ Million) Analysis, 2012 to 2022

    8.2. Current and Future Market Value (US$ Million) Projections, 2023 to 2033

        8.2.1. Y-o-Y Growth Trend Analysis

        8.2.2. Absolute $ Opportunity Analysis

9. Global Market Analysis 2012 to 2022 and Forecast 2023 to 2033, By Surgery Type

    9.1. Introduction / Key Findings

    9.2. Historical Market Size (US$ Million) By Surgery Type, 2012 to 2022

    9.3. Current and Future Market Size (US$ Million) Analysis and Forecast By Surgery Type, 2023 to 2033

        9.3.1. Neurological Surgery

        9.3.2. Orthopaedic Surgery

        9.3.3. Ophthalmological Surgery

        9.3.4. Others

    9.4. Market Attractiveness Analysis By Surgery Type

10. Global Market Analysis 2012 to 2022 and Forecast 2023 to 2033, By End User

    10.1. Introduction / Key Findings

    10.2. Historical Market Size (US$ Million) Analysis By End User, 2012 to 2022

    10.3. Current and Future Market Size (US$ Million) Analysis and Forecast By End User, 2023 to 2033

        10.3.1. Hospitals

        10.3.2. Ambulatory Surgical Centers

        10.3.3. Speciality Clinics

    10.4. Market Attractiveness Analysis By End User

11. Global Market Analysis 2012 to 2022 and Forecast 2023 to 2033, by Region

    11.1. Introduction

    11.2. Historical Market Size (US$ Million) and Volume (Units) Analysis By Region, 2012 to 2022

    11.3. Current and Future Market Size (US$ Million) and Volume (Units) Analysis and Forecast By Region, 2023 to 2033

        11.3.1. North America

        11.3.2. Latin America

        11.3.3. Europe

        11.3.4. South Asia

        11.3.5. East Asia

        11.3.6. Oceania

        11.3.7. Middle East and Africa (MEA)

    11.4. Market Attractiveness Analysis By Region

12. North America Market Analysis 2012 to 2022 and Forecast 2023 to 2033

    12.1. Introduction

    12.2. Historical Market Size (US$ Million) and Volume (Units) Analysis By Market Taxonomy, 2012 to 2022

    12.3. Current and Future Market Size (US$ Million) and Volume (Units) Analysis and Forecast By Market Taxonomy, 2023 to 2033

        12.3.1. By Country

            12.3.1.1. USA

            12.3.1.2. Canada

        12.3.2. By Surgery Type

        12.3.3. By End User

    12.4. Market Attractiveness Analysis

        12.4.1. By Country

        12.4.2. By Surgery Type

        12.4.3. By End User

    12.5. Country Level Analysis & Forecast

        12.5.1. USA Market Analysis

            12.5.1.1. Introduction

            12.5.1.2. Market Analysis and Forecast by Market Taxonomy

                12.5.1.2.1. By Surgery Type

                12.5.1.2.2. By End User

        12.5.2. Canada Market Analysis

            12.5.2.1. Introduction

            12.5.2.2. Market Analysis and Forecast by Market Taxonomy

                12.5.2.2.1. By Surgery Type

                12.5.2.2.2. By End User

    12.6. Market Trends

    12.7. Key Market Participants - Intensity Mapping

    12.8. Drivers and Restraints - Impact Analysis

13. Latin America Market Analysis 2012 to 2022 and Forecast 2023 to 2033

    13.1. Introduction

    13.2. Historical Market Size (US$ Million) and Volume (Units) Analysis By Market Taxonomy, 2012 to 2022

    13.3. Current and Future Market Size (US$ Million) and Volume (Units) Analysis and Forecast By Market Taxonomy, 2023 to 2033

        13.3.1. By Country

            13.3.1.1. Brazil

            13.3.1.2. Mexico

            13.3.1.3. Argentina

            13.3.1.4. Rest of Latin America

        13.3.2. By Surgery Type

        13.3.3. By End User

    13.4. Market Attractiveness Analysis

        13.4.1. By Country

        13.4.2. By Surgery Type

        13.4.3. By End User

    13.5. Country Level Analysis & Forecast

        13.5.1. Brazil Market Analysis

            13.5.1.1. Introduction

            13.5.1.2. Market Analysis and Forecast by Market Taxonomy

                13.5.1.2.1. By Surgery Type

                13.5.1.2.2. By End User

        13.5.2. Mexico Market Analysis

            13.5.2.1. Introduction

            13.5.2.2. Market Analysis and Forecast by Market Taxonomy

                13.5.2.2.1. By Surgery Type

                13.5.2.2.2. By End User

        13.5.3. Argentina Market Analysis

            13.5.3.1. Introduction

            13.5.3.2. Market Analysis and Forecast by Market Taxonomy

                13.5.3.2.1. By Surgery Type

                13.5.3.2.2. By End User

    13.6. Market Trends

    13.7. Key Market Participants - Intensity Mapping

    13.8. Drivers and Restraints - Impact Analysis

14. Europe Market Analysis 2012 to 2022 and Forecast 2023 to 2033

    14.1. Introduction

    14.2. Historical Market Size (US$ Million) and Volume (Units) Analysis By Market Taxonomy, 2012 to 2022

    14.3. Current and Future Market Size (US$ Million) and Volume (Units) Analysis and Forecast By Market Taxonomy, 2023 to 2033

        14.3.1. By Country

            14.3.1.1. Germany

            14.3.1.2. France

            14.3.1.3. Italy

            14.3.1.4. UK

            14.3.1.5. Spain

            14.3.1.6. Russia

            14.3.1.7. BENELUX

            14.3.1.8. Rest of Europe

        14.3.2. By Surgery Type

        14.3.3. By End User

    14.4. Market Attractiveness Analysis

        14.4.1. By Country

        14.4.2. By Surgery Type

        14.4.3. By End User

    14.5. Country Level Analysis & Forecast

        14.5.1. Germany Market Analysis

            14.5.1.1. Introduction

            14.5.1.2. Market Analysis and Forecast by Market Taxonomy

                14.5.1.2.1. By Surgery Type

                14.5.1.2.2. By End User

        14.5.2. France Market Analysis

            14.5.2.1. Introduction

            14.5.2.2. Market Analysis and Forecast by Market Taxonomy

                14.5.2.2.1. By Surgery Type

                14.5.2.2.2. By End User

        14.5.3. Italy Market Analysis

            14.5.3.1. Introduction

            14.5.3.2. Market Analysis and Forecast by Market Taxonomy

                14.5.3.2.1. By Surgery Type

                14.5.3.2.2. By End User

        14.5.4. UK Market Analysis

            14.5.4.1. Introduction

            14.5.4.2. Market Analysis and Forecast by Market Taxonomy

                14.5.4.2.1. By Surgery Type

                14.5.4.2.2. By End User

        14.5.5. Spain Market Analysis

            14.5.5.1. Introduction

            14.5.5.2. Market Analysis and Forecast by Market Taxonomy

                14.5.5.2.1. By Surgery Type

                14.5.5.2.2. By End User

        14.5.6. Russia Market Analysis

            14.5.6.1. Introduction

            14.5.6.2. Market Analysis and Forecast by Market Taxonomy

                14.5.6.2.1. By Surgery Type

                14.5.6.2.2. By End User

        14.5.7. BENELUX Market Analysis

            14.5.7.1. Introduction

            14.5.7.2. Market Analysis and Forecast by Market Taxonomy

                14.5.7.2.1. By Surgery Type

                14.5.7.2.2. By End User

    14.6. Market Trends

    14.7. Key Market Participants - Intensity Mapping

    14.8. Drivers and Restraints - Impact Analysis

15. South Asia Market Analysis 2012 to 2022 and Forecast 2023 to 2033

    15.1. Introduction

    15.2. Historical Market Size (US$ Million) and Volume (Units) Analysis By Market Taxonomy, 2012 to 2022

    15.3. Current and Future Market Size (US$ Million) and Volume (Units) Analysis and Forecast By Market Taxonomy, 2023 to 2033

        15.3.1. By Country

            15.3.1.1. India

            15.3.1.2. Thailand

            15.3.1.3. Indonesia

            15.3.1.4. Malaysia

            15.3.1.5. Rest of South Asia

        15.3.2. By Surgery Type

        15.3.3. By End User

    15.4. Market Attractiveness Analysis

        15.4.1. By Country

        15.4.2. By Surgery Type

        15.4.3. By End User

    15.5. Country Level Analysis & Forecast

        15.5.1. India Market Analysis

            15.5.1.1. Introduction

            15.5.1.2. Market Analysis and Forecast by Market Taxonomy

                15.5.1.2.1. By Surgery Type

                15.5.1.2.2. By End User

        15.5.2. Thailand Market Analysis

            15.5.2.1. Introduction

            15.5.2.2. Market Analysis and Forecast by Market Taxonomy

                15.5.2.2.1. By Surgery Type

                15.5.2.2.2. By End User

        15.5.3. Indonesia Market Analysis

            15.5.3.1. Introduction

            15.5.3.2. Market Analysis and Forecast by Market Taxonomy

                15.5.3.2.1. By Surgery Type

                15.5.3.2.2. By End User

        15.5.4. Malaysia Market Analysis

            15.5.4.1. Introduction

            15.5.4.2. Market Analysis and Forecast by Market Taxonomy

                15.5.4.2.1. By Surgery Type

                15.5.4.2.2. By End User

    15.6. Market Trends

    15.7. Key Market Participants - Intensity Mapping

    15.8. Drivers and Restraints - Impact Analysis

16. East Asia Market Analysis 2012 to 2022 and Forecast 2023 to 2033

    16.1. Introduction

    16.2. Historical Market Size (US$ Million) and Volume (Units) Analysis By Market Taxonomy, 2012 to 2022

    16.3. Current and Future Market Size (US$ Million) and Volume (Units) Analysis and Forecast By Market Taxonomy, 2023 to 2033

        16.3.1. By Country

            16.3.1.1. China

            16.3.1.2. Japan

            16.3.1.3. South Korea

        16.3.2. By Surgery Type

        16.3.3. By End User

    16.4. Market Attractiveness Analysis

        16.4.1. By Country

        16.4.2. By Surgery Type

        16.4.3. By End User

    16.5. Country Level Analysis & Forecast

        16.5.1. China Market Analysis

            16.5.1.1. Introduction

            16.5.1.2. Market Analysis and Forecast by Market Taxonomy

                16.5.1.2.1. By Surgery Type

                16.5.1.2.2. By End User

        16.5.2. Japan Market Analysis

            16.5.2.1. Introduction

            16.5.2.2. Market Analysis and Forecast by Market Taxonomy

                16.5.2.2.1. By Surgery Type

                16.5.2.2.2. By End User

        16.5.3. South Korea Market Analysis

            16.5.3.1. Introduction

            16.5.3.2. Market Analysis and Forecast by Market Taxonomy

                16.5.3.2.1. By Surgery Type

                16.5.3.2.2. By End User

    16.6. Market Trends

    16.7. Key Market Participants - Intensity Mapping

    16.8. Drivers and Restraints - Impact Analysis

17. Oceania Market Analysis 2012 to 2022 and Forecast 2023 to 2033

    17.1. Introduction

    17.2. Historical Market Size (US$ Million) and Volume (Units) Analysis By Market Taxonomy, 2012 to 2022

    17.3. Current and Future Market Size (US$ Million) and Volume (Units) Analysis and Forecast By Market Taxonomy, 2023 to 2033

        17.3.1. By Country

            17.3.1.1. Australia

            17.3.1.2. New Zealand

        17.3.2. By Surgery Type

        17.3.3. By End User

    17.4. Market Attractiveness Analysis

        17.4.1. By Country

        17.4.2. By Surgery Type

        17.4.3. By End User

    17.5. Country Level Analysis & Forecast

        17.5.1. Australia Market Analysis

            17.5.1.1. Introduction

            17.5.1.2. Market Analysis and Forecast by Market Taxonomy

                17.5.1.2.1. By Surgery Type

                17.5.1.2.2. By End User

        17.5.2. New Zealand Market Analysis

            17.5.2.1. Introduction

            17.5.2.2. Market Analysis and Forecast by Market Taxonomy

                17.5.2.2.1. By Surgery Type

                17.5.2.2.2. By End User

    17.6. Market Trends

    17.7. Key Market Participants - Intensity Mapping

    17.8. Drivers and Restraints - Impact Analysis

18. Middle East and Africa Market Analysis 2012 to 2022 and Forecast 2023 to 2033

    18.1. Introduction

    18.2. Historical Market Size (US$ Million) and Volume (Units) Analysis By Market Taxonomy, 2012 to 2022

    18.3. Current and Future Market Size (US$ Million) and Volume (Units) Analysis and Forecast By Market Taxonomy, 2023 to 2033

        18.3.1. By Country

            18.3.1.1. GCC Countries

            18.3.1.2. Türkiye

            18.3.1.3. Northern Africa

            18.3.1.4. South Africa

            18.3.1.5. Rest of Middle East and Africa

        18.3.2. By Surgery Type

        18.3.3. By End User

    18.4. Market Attractiveness Analysis

        18.4.1. By Country

        18.4.2. By Surgery Type

        18.4.3. By End User

    18.5. Country Level Analysis & Forecast

        18.5.1. GCC Countries Market Analysis

            18.5.1.1. Introduction

            18.5.1.2. Market Analysis and Forecast by Market Taxonomy

                18.5.1.2.1. By Surgery Type

                18.5.1.2.2. By End User

        18.5.2. Türkiye Market Analysis

            18.5.2.1. Introduction

            18.5.2.2. Market Analysis and Forecast by Market Taxonomy

                18.5.2.2.1. By Surgery Type

                18.5.2.2.2. By End User

        18.5.3. Northern Africa Market Analysis

            18.5.3.1. Introduction

            18.5.3.2. Market Analysis and Forecast by Market Taxonomy

                18.5.3.2.1. By Surgery Type

                18.5.3.2.2. By End User

        18.5.4. South Africa Market Analysis

            18.5.4.1. Introduction

            18.5.4.2. Market Analysis and Forecast by Market Taxonomy

                18.5.4.2.1. By Surgery Type

                18.5.4.2.2. By End User

    18.6. Market Trends

    18.7. Key Market Participants - Intensity Mapping

    18.8. Drivers and Restraints - Impact Analysis

19. Market Structure Analysis

    19.1. Market Analysis by Tier of Companies

    19.2. Market Share Analysis of Top Players

    19.3. Market Presence Analysis

20. Competition Analysis

    20.1. Competition Dashboard

    20.2. Competition Benchmarking

    20.3. Competition Deep Dive

        20.3.1. B. Braun

            20.3.1.1. Overview

            20.3.1.2. Product Portfolio

            20.3.1.3. Key Financials

            20.3.1.4. Sales Footprint

            20.3.1.5. SWOT Analysis

            20.3.1.6. Strategy Overview

                20.3.1.6.1. Marketing Strategy

                20.3.1.6.2. Product Strategy

                20.3.1.6.3. Channel Strategy

        20.3.2. BHS Technologies GmbH

            20.3.2.1. Overview

            20.3.2.2. Product Portfolio

            20.3.2.3. Key Financials

            20.3.2.4. Sales Footprint

            20.3.2.5. SWOT Analysis

            20.3.2.6. Strategy Overview

                20.3.2.6.1. Marketing Strategy

                20.3.2.6.2. Product Strategy

                20.3.2.6.3. Channel Strategy

        20.3.3. ZEISS

            20.3.3.1. Overview

            20.3.3.2. Product Portfolio

            20.3.3.3. Key Financials

            20.3.3.4. Sales Footprint

            20.3.3.5. SWOT Analysis

            20.3.3.6. Strategy Overview

                20.3.3.6.1. Marketing Strategy

                20.3.3.6.2. Product Strategy

                20.3.3.6.3. Channel Strategy

21. Assumptions and Acronyms Used

22. Research Methodology

List of Tables

Table 01: Global Market Value (US$ Million) Analysis and Forecast 2012 to 2033, by Surgery Type

Table 02: Global Market Value (US$ Million) Analysis and Forecast 2012 to 2033, by End User

Table 03: Global Market Value (US$ Million) Analysis and Forecast 2012 to 2033, by Region

Table 04: Global Market Volume (Units) Analysis and Forecast 2012 to 2033, by Region

Table 05: North America Market Value (US$ Million) Analysis 2012-2022 and Forecast 2023 to 2033, by Country

Table 06: North America Market Volume (Units) Analysis and Forecast 2012 to 2033, by Country

Table 07: North America Market Value (US$ Million) Analysis and Forecast 2012 to 2033, by Surgery Type

Table 08: North America Market Value (US$ Million) Analysis and Forecast 2012 to 2033, by End User

Table 09: Latin America Market Value (US$ Million) Analysis 2012-2022 and Forecast 2023 to 2033, by Country

Table 10: Latin America Market Volume (Units) Analysis and Forecast 2012 to 2033, by Country

Table 11: Latin America Market Value (US$ Million) Analysis and Forecast 2012 to 2033, by Surgery Type

Table 12: Latin America Market Value (US$ Million) Analysis and Forecast 2012 to 2033, by End User

Table 13: Europe Market Value (US$ Million) Analysis 2012-2022 and Forecast 2023 to 2033, by Country

Table 14: Europe Market Volume (Units) Analysis and Forecast 2012 to 2033, by Country

Table 15: Europe Market Value (US$ Million) Analysis and Forecast 2012 to 2033, by Surgery Type

Table 16: Europe Market Value (US$ Million) Analysis and Forecast 2012 to 2033, by End User

Table 17: South Asia Market Value (US$ Million) Analysis 2012-2022 and Forecast 2023 to 2033, by Country

Table 18: South Asia Market Volume (Units) Analysis and Forecast 2012 to 2033, by Country

Table 19: South Asia Market Value (US$ Million) Analysis and Forecast 2012 to 2033, by Surgery Type

Table 20: South Asia Market Value (US$ Million) Analysis and Forecast 2012 to 2033, by End User

Table 21: East Asia Market Value (US$ Million) Analysis 2012-2022 and Forecast 2023 to 2033, by Country

Table 22: East Asia Market Volume (Units) Analysis and Forecast 2012 to 2033, by Country

Table 23: East Asia Market Value (US$ Million) Analysis and Forecast 2012 to 2033, by Surgery Type

Table 24: East Asia Market Value (US$ Million) Analysis and Forecast 2012 to 2033, by End User

Table 25: Oceania Market Value (US$ Million) Analysis 2012-2022 and Forecast 2023 to 2033, by Country

Table 26: Oceania Market Volume (Units) Analysis and Forecast 2012 to 2033, by Country

Table 27: Oceania Market Value (US$ Million) Analysis and Forecast 2012 to 2033, by Surgery Type

Table 28: Oceania Market Value (US$ Million) Analysis and Forecast 2012 to 2033, by End User

Table 29: Middle East and Africa (MEA) Market Value (US$ Million) Analysis 2012-2022 and Forecast 2023 to 2033, by Country

Table 30: Middle East and Africa (MEA) Market Volume (Units) Analysis and Forecast 2012 to 2033, by Country

Table 31: Middle East and Africa (MEA) Market Value (US$ Million) Analysis and Forecast 2012 to 2033, by Surgery Type

Table 32: Middle East and Africa (MEA) Market Value (US$ Million) Analysis and Forecast 2012 to 2033, by End User

List of Charts

Figure 01: Global Market Volume (Units), 2012 to 2022

Figure 02: Global Market Volume (Units) & Y-o-Y Growth (%) Analysis, 2023 to 2033

Figure 03: Pricing Analysis per unit (US$), in 2022

Figure 04: Pricing Forecast per unit (US$), in 2033

Figure 05: Global Market Value (US$ Million) Analysis, 2012 to 2022

Figure 06: Global Market Forecast & Y-o-Y Growth, 2023 to 2033

Figure 07: Global Market Absolute $ Opportunity (US$ Million) Analysis, 2022 to 2033

Figure 08: Global Market Value Share (%) Analysis 2023 and 2033, by Surgery Type

Figure 09: Global Market Y-o-Y Growth (%) Analysis 2022 to 2033, by Surgery Type

Figure 10: Global Market Attractiveness Analysis 2023 to 2033, by Surgery Type

Figure 11: Global Market Value Share (%) Analysis 2023 and 2033, by End User

Figure 12: Global Market Y-o-Y Growth (%) Analysis 2022 to 2033, by End User

Figure 13: Global Market Attractiveness Analysis 2023 to 2033, by End User

Figure 14: Global Market Value Share (%) Analysis 2023 and 2033, by Region

Figure 15: Global Market Y-o-Y Growth (%) Analysis 2022 to 2033, by Region

Figure 16: Global Market Attractiveness Analysis 2023 to 2033, by Region

Figure 17: North America Market Value (US$ Million) Analysis, 2012 to 2022

Figure 18: North America Market Value (US$ Million) Forecast, 2023 to 2033

Figure 19: North America Market Value Share, by Surgery Type (2023 E)

Figure 20: North America Market Value Share, by End User (2023 E)

Figure 21: North America Market Value Share, by Country (2023 E)

Figure 22: North America Market Attractiveness Analysis by Surgery Type, 2023 to 2033

Figure 23: North America Market Attractiveness Analysis by End User, 2023 to 2033

Figure 24: North America Market Attractiveness Analysis by Country, 2023 to 2033

Figure 25: USA Market Value Proportion Analysis, 2022

Figure 26: Global Vs. USA Growth Comparison

Figure 27: USA Market Share Analysis (%) by Surgery Type, 2022 & 2033

Figure 28: USA Market Share Analysis (%) by End User, 2022 & 2033

Figure 29: Canada Market Value Proportion Analysis, 2022

Figure 30: Global Vs. Canada. Growth Comparison

Figure 31: Canada Market Share Analysis (%) by Surgery Type, 2022 & 2033

Figure 32: Canada Market Share Analysis (%) by End User, 2022 & 2033

Figure 33: Latin America Market Value (US$ Million) Analysis, 2012 to 2022

Figure 34: Latin America Market Value (US$ Million) Forecast, 2023 to 2033

Figure 35: Latin America Market Value Share, by Surgery Type (2023 E)

Figure 36: Latin America Market Value Share, by End User (2023 E)

Figure 37: Latin America Market Value Share, by Country (2023 E)

Figure 38: Latin America Market Attractiveness Analysis by Surgery Type, 2023 to 2033

Figure 39: Latin America Market Attractiveness Analysis by End User, 2023 to 2033

Figure 40: Latin America Market Attractiveness Analysis by Country, 2023 to 2033

Figure 41: Mexico Market Value Proportion Analysis, 2022

Figure 42: Global Vs Mexico Growth Comparison

Figure 43: Mexico Market Share Analysis (%) by Surgery Type, 2022 & 2033

Figure 44: Mexico Market Share Analysis (%) by End User, 2022 & 2033

Figure 45: Brazil Market Value Proportion Analysis, 2022

Figure 46: Global Vs. Brazil. Growth Comparison

Figure 47: Brazil Market Share Analysis (%) by Surgery Type, 2022 & 2033

Figure 48: Brazil Market Share Analysis (%) by End User, 2022 & 2033

Figure 49: Argentina Market Value Proportion Analysis, 2022

Figure 50: Global Vs Argentina Growth Comparison

Figure 51: Argentina Market Share Analysis (%) by Surgery Type, 2022 & 2033

Figure 52: Argentina Market Share Analysis (%) by End User, 2022 & 2033

Figure 53: Europe Market Value (US$ Million) Analysis, 2012 to 2022

Figure 54: Europe Market Value (US$ Million) Forecast, 2023 to 2033

Figure 55: Europe Market Value Share, by Surgery Type (2023 E)

Figure 56: Europe Market Value Share, by End User (2023 E)

Figure 57: Europe Market Value Share, by Country (2023 E)

Figure 58: Europe Market Attractiveness Analysis by Surgery Type, 2023 to 2033

Figure 59: Europe Market Attractiveness Analysis by End User, 2023 to 2033

Figure 60: Europe Market Attractiveness Analysis by Country, 2023 to 2033

Figure 61: UK Market Value Proportion Analysis, 2022

Figure 62: Global Vs. UK Growth Comparison

Figure 63: UK Market Share Analysis (%) by Surgery Type, 2022 & 2033

Figure 64: UK Market Share Analysis (%) by End User, 2022 & 2033

Figure 65: Germany Market Value Proportion Analysis, 2022

Figure 66: Global Vs. Germany Growth Comparison

Figure 67: Germany Market Share Analysis (%) by Surgery Type, 2022 & 2033

Figure 68: Germany Market Share Analysis (%) by End User, 2022 & 2033

Figure 69: Italy Market Value Proportion Analysis, 2022

Figure 70: Global Vs. Italy Growth Comparison

Figure 71: Italy Market Share Analysis (%) by Surgery Type, 2022 & 2033

Figure 72: Italy Market Share Analysis (%) by End User, 2022 & 2033

Figure 73: France Market Value Proportion Analysis, 2022

Figure 74: Global Vs France Growth Comparison

Figure 75: France Market Share Analysis (%) by Surgery Type, 2022 & 2033

Figure 76: France Market Share Analysis (%) by End User, 2022 & 2033

Figure 77: Spain Market Value Proportion Analysis, 2022

Figure 78: Global Vs Spain Growth Comparison

Figure 79: Spain Market Share Analysis (%) by Surgery Type, 2022 & 2033

Figure 80: Spain Market Share Analysis (%) by End User, 2022 & 2033

Figure 81: Russia Market Value Proportion Analysis, 2022

Figure 82: Global Vs Russia Growth Comparison

Figure 83: Russia Market Share Analysis (%) by Surgery Type, 2022 & 2033

Figure 84: Russia Market Share Analysis (%) by End User, 2022 & 2033

Figure 85: BENELUX Market Value Proportion Analysis, 2022

Figure 86: Global Vs BENELUX Growth Comparison

Figure 87: BENELUX Market Share Analysis (%) by Surgery Type, 2022 & 2033

Figure 88: BENELUX Market Share Analysis (%) by End User, 2022 & 2033

Figure 89: East Asia Market Value (US$ Million) Analysis, 2012 to 2022

Figure 90: East Asia Market Value (US$ Million) Forecast, 2023 to 2033

Figure 91: East Asia Market Value Share, by Surgery Type (2023 E)

Figure 92: East Asia Market Value Share, by End User (2023 E)

Figure 93: East Asia Market Value Share, by Country (2023 E)

Figure 94: East Asia Market Attractiveness Analysis by Surgery Type, 2023 to 2033

Figure 95: East Asia Market Attractiveness Analysis by End User, 2023 to 2033

Figure 96: East Asia Market Attractiveness Analysis by Country, 2023 to 2033

Figure 97: China Market Value Proportion Analysis, 2022

Figure 98: Global Vs. China Growth Comparison

Figure 99: China Market Share Analysis (%) by Surgery Type, 2022 & 2033

Figure 100: China Market Share Analysis (%) by End User, 2022 & 2033

Figure 101: Japan Market Value Proportion Analysis, 2022

Figure 102: Global Vs. Japan Growth Comparison

Figure 103: Japan Market Share Analysis (%) by Surgery Type, 2022 & 2033

Figure 104: Japan Market Share Analysis (%) by End User, 2022 & 2033

Figure 105: South Korea Market Value Proportion Analysis, 2022

Figure 106: Global Vs South Korea Growth Comparison

Figure 107: South Korea Market Share Analysis (%) by Surgery Type, 2022 & 2033

Figure 108: South Korea Market Share Analysis (%) by End User, 2022 & 2033

Figure 109: South Asia Market Value (US$ Million) Analysis, 2012 to 2022

Figure 110: South Asia Market Value (US$ Million) Forecast, 2023 to 2033

Figure 111: South Asia Market Value Share, by Surgery Type (2023 E)

Figure 112: South Asia Market Value Share, by End User (2023 E)

Figure 113: South Asia Market Value Share, by Country (2023 E)

Figure 114: South Asia Market Attractiveness Analysis by Surgery Type, 2023 to 2033

Figure 115: South Asia Market Attractiveness Analysis by End User, 2023 to 2033

Figure 116: South Asia Market Attractiveness Analysis by Country, 2023 to 2033

Figure 117: India Market Value Proportion Analysis, 2022

Figure 118: Global Vs. India Growth Comparison

Figure 119: India Market Share Analysis (%) by Surgery Type, 2022 & 2033

Figure 120: India Market Share Analysis (%) by End User, 2022 & 2033

Figure 121: Indonesia Market Value Proportion Analysis, 2022

Figure 122: Global Vs. Indonesia Growth Comparison

Figure 123: Indonesia Market Share Analysis (%) by Surgery Type, 2022 & 2033

Figure 124: Indonesia Market Share Analysis (%) by End User, 2022 & 2033

Figure 125: Malaysia Market Value Proportion Analysis, 2022

Figure 126: Global Vs. Malaysia Growth Comparison

Figure 127: Malaysia Market Share Analysis (%) by Surgery Type, 2022 & 2033

Figure 128: Malaysia Market Share Analysis (%) by End User, 2022 & 2033

Figure 129: Thailand Market Value Proportion Analysis, 2022

Figure 130: Global Vs. Thailand Growth Comparison

Figure 131: Thailand Market Share Analysis (%) by Surgery Type, 2022 & 2033

Figure 132: Thailand Market Share Analysis (%) by End User, 2022 & 2033

Figure 133: Oceania Market Value (US$ Million) Analysis, 2012 to 2022

Figure 134: Oceania Market Value (US$ Million) Forecast, 2023 to 2033

Figure 135: Oceania Market Value Share, by Surgery Type (2023 E)

Figure 136: Oceania Market Value Share, by End User (2023 E)

Figure 137: Oceania Market Value Share, by Country (2023 E)

Figure 138: Oceania Market Attractiveness Analysis by Surgery Type, 2023 to 2033

Figure 139: Oceania Market Attractiveness Analysis by End User, 2023 to 2033

Figure 140: Oceania Market Attractiveness Analysis by Country, 2023 to 2033

Figure 141: Australia Market Value Proportion Analysis, 2022

Figure 142: Global Vs. Australia Growth Comparison

Figure 143: Australia Market Share Analysis (%) by Surgery Type, 2022 & 2033

Figure 144: Australia Market Share Analysis (%) by End User, 2022 & 2033

Figure 145: New Zealand Market Value Proportion Analysis, 2022

Figure 146: Global Vs New Zealand Growth Comparison

Figure 147: New Zealand Market Share Analysis (%) by Surgery Type, 2022 & 2033

Figure 148: New Zealand Market Share Analysis (%) by End User, 2022 & 2033

Figure 149: Middle East & Africa Market Value (US$ Million) Analysis, 2012 to 2022

Figure 150: Middle East & Africa Market Value (US$ Million) Forecast, 2023 to 2033

Figure 151: Middle East & Africa Market Value Share, by Surgery Type (2023 E)

Figure 152: Middle East & Africa Market Value Share, by End User (2023 E)

Figure 153: Middle East & Africa Market Value Share, by Country (2023 E)

Figure 154: Middle East & Africa Market Attractiveness Analysis by Surgery Type, 2023 to 2033

Figure 155: Middle East & Africa Market Attractiveness Analysis by End User, 2023 to 2033

Figure 156: Middle East & Africa Market Attractiveness Analysis by Country, 2023 to 2033

Figure 157: GCC Countries Market Value Proportion Analysis, 2022

Figure 158: Global Vs GCC Countries Growth Comparison

Figure 159: GCC Countries Market Share Analysis (%) by Surgery Type, 2022 & 2033

Figure 160: GCC Countries Market Share Analysis (%) by End User, 2022 & 2033

Figure 161: Türkiye Market Value Proportion Analysis, 2022

Figure 162: Global Vs. Türkiye Growth Comparison

Figure 163: Türkiye Market Share Analysis (%) by Surgery Type, 2022 & 2033

Figure 164: Türkiye Market Share Analysis (%) by End User, 2022 & 2033

Figure 165: South Africa Market Value Proportion Analysis, 2022

Figure 166: Global Vs. South Africa Growth Comparison

Figure 167: South Africa Market Share Analysis (%) by Surgery Type, 2022 & 2033

Figure 168: South Africa Market Share Analysis (%) by End User, 2022 & 2033

Figure 169: Northern Africa Market Value Proportion Analysis, 2022

Figure 170: Global Vs Northern Africa Growth Comparison

Figure 171: Northern Africa Market Share Analysis (%) by Surgery Type, 2022 & 2033

Figure 172: Northern Africa Market Share Analysis (%) by End User, 2022 & 2033

Explore Healthcare Insights

View Reports

Robot Assisted Surgical Microscope Market