Reports

- Global Locations -

Headquarters

Future Market Insights, Inc.

Christiana Corporate, 200
Continental Drive, Suite 401,
Newark, Delaware - 19713,
United States

T: +1-845-579-5705

Americas

Future Market Insights, Inc.

616 Corporate Way, Suite 2-9018,
Valley Cottage, NY 10989, United States

T: +1-347-918-3531

MEA

Future Market Insights

1602-6 Jumeirah Bay X2 Tower, Plot No: JLT-PH2-X2A,
Jumeirah Lakes Towers, Dubai,
United Arab Emirates

Europe

Future Market Insights

3rd Floor, 207 Regent Street,
W1B 3HH London
United Kingdom

T: + 44 (0) 20 8123 9659
D: +44 (0) 20 3287 4268

Asia Pacific

Future Market Insights

IndiaLand Global Tech Park, Unit UG-1, Behind Grand HighStreet, Phase 1, Hinjawadi, MH, Pune – 411057, India

Robot Controller, Integrator, and Software Market Outlook for 2024 to 2034

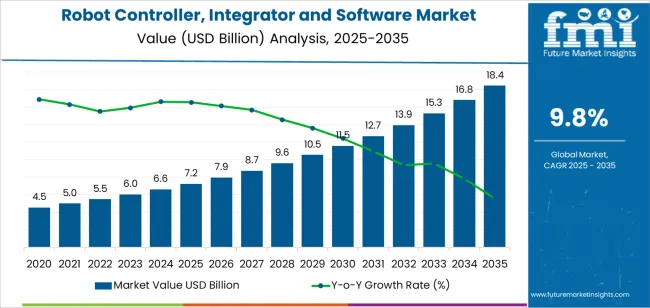
The robot controller, integrator, and software market value is estimated to be US$ 6.3 billion in 2024. With the onset of Industry 4.0, there has been a higher demand for capable robotic system software solutions to enable the smooth integration of robots into networked and intelligent production systems.

Because of this, the robot controller, integrator, and software industry size is predicted to surge at an impressive CAGR of 14.8% during the forecast period, reaching US$ 25 billion by 2034.

Report Attribute Details
Robot Controller, Integrator, and Software Market Size (2024) US$ 6.3 billion
Market Anticipated Forecast Value (2034) US$ 25 billion
Market Projected Growth Rate (2024 to 2034) 14.8% CAGR

Don't pay for what you don't need

Customize your report by selecting specific countries or regions and save 30%!

Robot Controller, Integrator, and Software Market Trends & Analysis

  • The need for precise motion control software for robots is growing to increase the efficiency, adaptability, and flexibility of robotic systems. Thus, robotic software providers are focusing more on robot motion control systems as automation grows across a variety of industries.
  • Robots can become more adaptable and efficient when artificial intelligence is integrated into their controls and software. Therefore, AI-based robot controls are expected to take over CNC machine controllers in the coming days. These controls allow robots to learn from and adjust to their changing surroundings.

Robot Controller, Integrator, and Software Market Historical Analysis Vs Forecast Outlook

The robot controller, integrator, and software market was valued at US$ 3 billion in 2019. The demand for robot controllers, integrators, and software increased at an astounding rate of 16.3% between 2019 and 2023. By the end of 2023, the overall market value was around US$ 5.5 billion.

Many industries shifted toward remotely operated manufacturing facilities during the pandemic period. This has resulted in higher adoption of industrial robot controllers and control systems. This fundamental change across most industrial economies is expected to strengthen the robot control technology and market outlook further during the forecast period.

Attributes Details
Robot Controller, Integrator, and Software Market Value (2019) US$ 3 billion
Market Revenue (2023) US$ 5.5 billion
Market Historical Growth Rate (CAGR 2019 to 2023) 16.3% CAGR
Nikhil Kaitwade
Nikhil Kaitwade

Principal Consultant

Talk to Analyst

Find your sweet spots for generating winning opportunities in this market.

Key Drivers Influencing the Robot Controller, Integrator, and Software Market Growth

Miniaturized robot control systems that process signals for small robots by utilizing microfluidic channels constitute an emerging technology in robot control. For instance, the exoskeleton from Ekso Bionics is gaining traction these days.

Artificial intelligence-driven controllers are anticipated to play a significant role in shaping the future of robot integration. These controllers improve robot autonomy by learning from experience and adapting to changing contexts.

For example, OpenAI's robotic hand, Dactyl, learns and trains itself to manipulate items like humans. The company employs the same reinforcement learning technology that powers OpenAI Five to train the neural networks solely through simulation.

Comparative View of Adjacent Robot Controller, Integrator, and Software Market

The section below sheds light on the general trends and opportunities in two other closely related markets. Despite having lower projected CAGRs compared to the robot controller, integrator, and software market, these two markets still witness substantial adoption, fostering healthy competition.

The industrial robot controller market analysis in the second table suggests the growing trend for industrial automation software. Concurrently, the expansion of the robot operating system market is likely to further strengthen the assimilation of intelligent robotic automation technologies.

Robot Controller, Integrator, and Software Market:

Attributes Robot Controller, Integrator, and Software Market
CAGR (2024 to 2034) 14.8%
Growth Factor Growing adoption of industrial robots and smart manufacturing processes across manufacturing, automotive, healthcare, and logistics sectors
Market Opportunities Open-source solutions are enabling developers to modify and improve robot control systems and automation software
Market Challenges The necessity to invest in many different sectors to establish a self-sufficient robotics industry compounds the expenses

Industrial Robot Controller Market:

Attributes Industrial Robot Controller Market
CAGR (2024 to 2034) 8.9%
Growth Factor The automotive and electronic manufacturing industries are adopting six and more axis industrial robots at an increasing rate
Market Opportunities The development of collaborative robotic technologies, or cobots, is expected to drive the adoption of industrial high-precision robotics
Market Challenges Occasional accidents are associated with robots controlled entirely by industrial automation systems

Robot Operating System Market:

Attributes Robot Operating System Market
CAGR (2024 to 2034) 5.7%
Growth Factor The growing adoption of robotics in crucial sectors like healthcare and defense demands the use of an operating system for better precision
Market Opportunities Development of a new robot operating system framework for SCARA and vision-guided robotics
Market Challenges Unavailability of sufficient infrastructure and skilled personnel to deploy and operate such advanced systems

Get the data you need at a Fraction of the cost

Personalize your report by choosing insights you need
and save 40%!

Country-wise Insights

The table below lists CAGRs for five leading countries that are expected to witness higher growth rates when it comes to the adoption of robot controllers, integrators, and software solutions.

Regional Market Comparison CAGR (2024 to 2034)
United States 14.9%
Japan 16%
United Kingdom 16.1%
South Korea 15.4%
China 15.2%

The United States Robot System Integrator Market is Advancing with Modern Technologies

The United States robot controller, integrator, and software market is forecasted to advance at a CAGR of 14.9% per year between 2024 and 2034. The market value in the United States is forecasted to reach US$ 4.5 billion by 2034.

  • The growth of open-source robotics software and robotic integrator solutions is a key trend fueling the United States market.
  • Artificial Intelligence (AI) advancements in the country have also bolstered robot control software development.

Players from the United Kingdom are Striving to become Global Robotic Companies

The regional market for robot controllers, integrators, and software in the United Kingdom is expected to rise at a 16.1% CAGR through 2034. The market value in this country is anticipated to reach the US$ 1 billion mark by 2034.

  • Industry 4.0 concepts are widely used in the country, creating greater demand for robotic integration software.
  • Many automation software market players based in the United Kingdom are now striving to expand their businesses beyond Europe and North America.

China’s Market is Developing Rapidly with Growing Demand for Robotic Systems in Asia

Robot controller, integrator, and software market players in China are likely to witness a remarkable growth rate of 15.2% from 2024 to 2034. The net worth of the market in China is projected to be US$ 3.9 billion by 2034.

  • There is increased adoption of automation technologies in both large and small-scale manufacturing enterprises.
  • There is also a growing export of industrial robot controllers to the adjacent industrializing countries in Asia.

Japan's Robotic Software Market is Successively Turning Sophisticated amid Technological Advancements

Robot controllers, integrators, and software development in Japan are expected to continue at a pace of 16% per year through the projected time period. By the end of this projected period, the total valuation of the market in Japan is likely to reach US$ 2.7 billion.

  • There is a growing demand for powerful industrial robotic programming software and controllers to facilitate smooth data exchange and communication with Industrial Internet of Things (IIoT) systems.
  • There is also a greater demand for creative robotic system integrator solutions to facilitate safe and effective human-robot collaboration in workplaces.

Market Players in South Korea are Focusing on Customization of Robotic Systems

The robot system controller, integrator, and software market in South Korea is expected to progress with a CAGR of 15.4% over the next ten years. All robotics industries in South Korea operating in these three sectors are expected to reach a combined valuation of US$ 1.3 billion by 2034.

  • Government initiatives aim to promote cooperation and creativity in the robotics community and propel technological progress.
  • There is also an increase in the demand for customized robot control platforms with the emergence of many specialized industries in the country.

Category-wise Insights

Robot Controllers Present Higher Scope of Growth for the Market Players

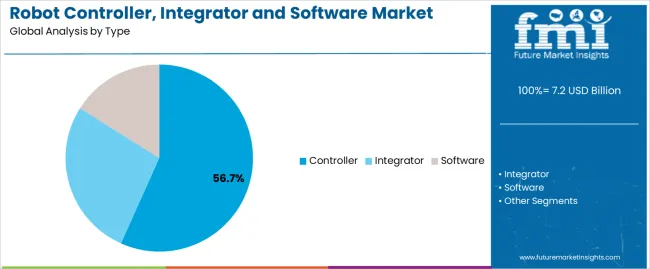
Based on type, the robot controller market trends seem promising for establishing it as the leading segment. The controller segment is expected to continue developing at a 14.7% CAGR throughout the forecasted period.

Attributes Details
Top Type Segment Controller
Market Segment Growth Rate from 2024 to 2034 14.7% CAGR
Market Segment Growth Rate from 2019 to 2023 16.2% CAGR
  • Developing robotics controller solutions based on cloud platforms has significantly increased the usage and market share of this segment.
  • A greater focus on the advancement of data analytics and real-time monitoring technologies is expected to further strengthen the automated robot controller segment.

Industrial Robotics and Automation Software Development to Get Lucrative

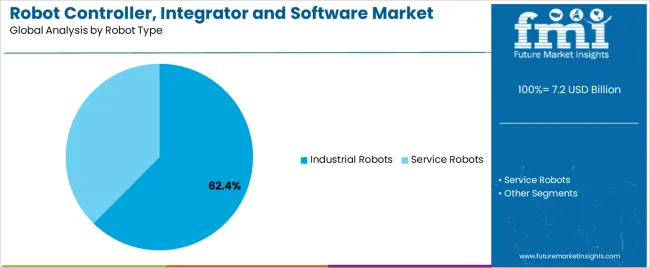
Based on robot type, the higher adoption of integration and control systems for industrial robots makes it the dominant segment. This segment is poised to expand further, with a CAGR of 14.5% over the next ten years.

Attributes Details
Top Robot Type or segment Industrial Robot
Market Segment Growth Rate from 2024 to 2034 14.5% CAGR
Market Segment Growth Rate from 2019 to 2023 16% CAGR
  • The advancement of robot control technology for upgrading human-machine interfaces (HMI) in all types of industries is evident.
  • The integration of IIoT systems with robots is an emerging trend that is likely to fuel the growth of the industrial robot segment in the coming days.

Competitive Landscape for Robot Controller, Integrator, and Software Market

A trend toward greater customization in the robot software market is fostering the emergence of regional robot integrators and software developers. Their share in the robot controller market and robot integrator market is also anticipated to rise rapidly through 2034. This is because they offer specialized solutions that address particular industrial demands.

Recent Developments in the Robot Controller, Integrator, and Software Market

In May 2023, Alphabet's Intrinsic released a new robotic app development platform called Flowstate. Since 2021, a team has been investigating ways to enable industrial robots to perceive, learn, and autonomously adapt while performing tasks, allowing them to operate in a greater variety of environments and applications.

They were also testing robot control software that makes use of automated perception, deep learning, reinforcement learning, motion planning, simulation, and force control. Intrinsic claims that Flowstate is intended to fulfill some of those promises, besides assisting non-roboticists in creating processes for various hardware devices.

In November 2023, Realtime Robotics, the industry leader in collision-free autonomous motion planning for industrial robots, unveiled a new Optimization-as-a-Service solution. This solution increases users' total efficiency by combining specialized robotics and application engineering knowledge with proprietary optimization tools.

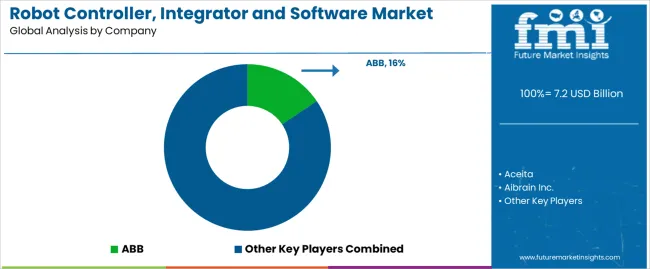
Key Players Profiled in the Robot Controller, Integrator, and Software Market Report

  • ABB Group
  • Aibrain Inc.
  • Amtec Solutions Group
  • Artiminds Robotics GmbH

Robot Controller, Integrator, and Software Market Report Scope

Attribute Details
Estimated Market Size (2024) US$ 6.3 billion
Projected Market Size (2034) US$ 25 billion
Anticipated Growth Rate (2024 to 2034) 14.8% CAGR
Forecast Period 2024 to 2034
Historical Data Available for 2019 to 2023
Market Analysis US$ million or billion for Value and Units for Volume
Key Regions Covered North America, Latin America, Europe, Middle East & Africa (MEA), East Asia, South Asia and Oceania
Key Countries Covered United States, Canada, Brazil, Mexico, Germany, Spain, Italy, France, United Kingdom, Russia, China, India, Australia & New Zealand, GCC Countries, and South Africa
Key Segments Covered By Type, By Robot Type, By Industry Vertical, and By Region
Key Companies Profiled
  • ABB Group
  • Aibrain Inc.
  • Amtec Solutions Group
  • Artiminds Robotics GmbH
Report Coverage Market Forecast, Company Share Analysis, Competition Intelligence, DROT Analysis, Market Dynamics and Challenges, and Strategic Growth Initiatives
Customization & Pricing Available upon Request

Key Segments Covered by Robot Controller, Integrator, and Software Industry Survey Report

By Type:

  • Controller
  • Integrator
  • Software

By Robot Type:

  • Industrial Robots
    • Collaborative
    • Articulated
    • Cartesian
    • SCARA
    • Other Industrial Robots
  • Service Robots
    • Autonomous Mobile Robots
    • Automated Guided Vehicles
    • Medical Robots
    • Other Service Robots

By Industry Verticle:

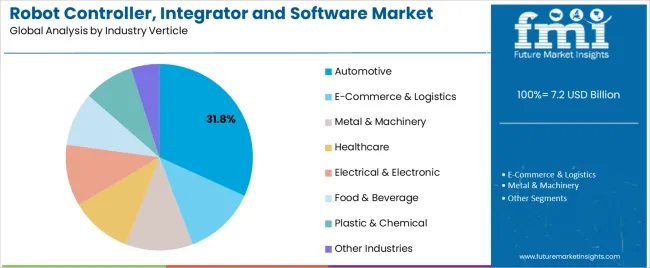
  • Automotive
  • E-commerce & Logistics
  • Metal & Machinery
  • Healthcare
  • Electrical & Electronic
  • Food & Beverage
  • Plastic & Chemical
  • Other Industries

By Region:

  • North America Market
  • Latin America Market
  • Europe Market
  • East Asia Market
  • South Asia and Pacific Market
  • Middle East and Africa (MEA) Market

Frequently Asked Questions

How Big is the Robot Controller, Integrator, and Software Market?

The market is set to be valued at US$ 6.3 billion in 2024.

What is the Growth Outlook of the Robot Controller, Integrator, and Software Market?

The market is to surge at a 14.8% CAGR through 2034.

What is the Projected Market Value of Robot Controller, Integrator, and Software by 2034?

The robot controller, integrator, and software market is likely to be valued at US$ 5.5 billion by 2034.

What was the Historical Size of the Robot Controller, Integrator and Software Market?

The market value was US$ 3 billion in 2019 and US$ 25 billion in 2023.

Which Country Dominates the Robot Controller, Integrator, and Software Market?

The United States dominates the market and is forecasted to maintain its dominance through 2034, registering a 14.9% CAGR.

Which Regional Robot Controller, Integrator, and Software Market has the Highest Growth Potential?

The United Kingdom is set to witness a 16.1% CAGR in adoption of robot controllers, integrators, and software through 2034.

Table of Content

1. Executive Summary

    1.1. Global Market Outlook

    1.2. Demand-side Trends

    1.3. Supply-side Trends

    1.4. Technology Roadmap Analysis

    1.5. Analysis and Recommendations

2. Market Overview

    2.1. Market Coverage / Taxonomy

    2.2. Market Definition / Scope / Limitations

3. Market Background

    3.1. Market Dynamics

        3.1.1. Drivers

        3.1.2. Restraints

        3.1.3. Opportunity

        3.1.4. Trends

    3.2. Scenario Forecast

        3.2.1. Demand in Optimistic Scenario

        3.2.2. Demand in Likely Scenario

        3.2.3. Demand in Conservative Scenario

    3.3. Opportunity Map Analysis

    3.4. Investment Feasibility Matrix

    3.5. PESTLE and Porter’s Analysis

    3.6. Regulatory Landscape

        3.6.1. By Key Regions

        3.6.2. By Key Countries

    3.7. Regional Parent Market Outlook

4. Global Market Analysis 2019 to 2023 and Forecast, 2024 to 2034

    4.1. Historical Market Size Value (US$ Million) Analysis, 2019 to 2023

    4.2. Current and Future Market Size Value (US$ Million) Projections, 2024 to 2034

        4.2.1. Y-o-Y Growth Trend Analysis

        4.2.2. Absolute $ Opportunity Analysis

5. Global Market Analysis 2019 to 2023 and Forecast 2024 to 2034, By Type

    5.1. Introduction / Key Findings

    5.2. Historical Market Size Value (US$ Million) Analysis By Type, 2019 to 2023

    5.3. Current and Future Market Size Value (US$ Million) Analysis and Forecast By Type, 2024 to 2034

        5.3.1. Controller

        5.3.2. Integrator

        5.3.3. Software

    5.4. Y-o-Y Growth Trend Analysis By Type, 2019 to 2023

    5.5. Absolute $ Opportunity Analysis By Type, 2024 to 2034

6. Global Market Analysis 2019 to 2023 and Forecast 2024 to 2034, By Robots

    6.1. Introduction / Key Findings

    6.2. Historical Market Size Value (US$ Million) Analysis By Robots, 2019 to 2023

    6.3. Current and Future Market Size Value (US$ Million) Analysis and Forecast By Robots, 2024 to 2034

        6.3.1. Industrial Robots

        6.3.2. Collaborative

        6.3.3. Articulated

        6.3.4. Cartesian

        6.3.5. SCARA

        6.3.6. Others

    6.4. Y-o-Y Growth Trend Analysis By Robots, 2019 to 2023

    6.5. Absolute $ Opportunity Analysis By Robots, 2024 to 2034

7. Global Market Analysis 2019 to 2023 and Forecast 2024 to 2034, By Industry

    7.1. Introduction / Key Findings

    7.2. Historical Market Size Value (US$ Million) Analysis By Industry, 2019 to 2023

    7.3. Current and Future Market Size Value (US$ Million) Analysis and Forecast By Industry, 2024 to 2034

        7.3.1. Automotive

        7.3.2. E-commerce & Logistics

        7.3.3. Metal & Machinery

        7.3.4. Healthcare

        7.3.5. Electrical & Electronic

        7.3.6. Food & Beverage

        7.3.7. Plastic & Chemical

        7.3.8. Others

    7.4. Y-o-Y Growth Trend Analysis By Industry, 2019 to 2023

    7.5. Absolute $ Opportunity Analysis By Industry, 2024 to 2034

8. Global Market Analysis 2019 to 2023 and Forecast 2024 to 2034, By Region

    8.1. Introduction

    8.2. Historical Market Size Value (US$ Million) Analysis By Region, 2019 to 2023

    8.3. Current Market Size Value (US$ Million) Analysis and Forecast By Region, 2024 to 2034

        8.3.1. North America

        8.3.2. Latin America

        8.3.3. Western Europe

        8.3.4. Eastern Europe

        8.3.5. South Asia and Pacific

        8.3.6. East Asia

        8.3.7. Middle East and Africa

    8.4. Market Attractiveness Analysis By Region

9. North America Market Analysis 2019 to 2023 and Forecast 2024 to 2034, By Country

    9.1. Historical Market Size Value (US$ Million) Trend Analysis By Market Taxonomy, 2019 to 2023

    9.2. Market Size Value (US$ Million) Forecast By Market Taxonomy, 2024 to 2034

        9.2.1. By Country

            9.2.1.1. USA

            9.2.1.2. Canada

        9.2.2. By Type

        9.2.3. By Robots

        9.2.4. By Industry

    9.3. Market Attractiveness Analysis

        9.3.1. By Country

        9.3.2. By Type

        9.3.3. By Robots

        9.3.4. By Industry

    9.4. Key Takeaways

10. Latin America Market Analysis 2019 to 2023 and Forecast 2024 to 2034, By Country

    10.1. Historical Market Size Value (US$ Million) Trend Analysis By Market Taxonomy, 2019 to 2023

    10.2. Market Size Value (US$ Million) Forecast By Market Taxonomy, 2024 to 2034

        10.2.1. By Country

            10.2.1.1. Brazil

            10.2.1.2. Mexico

            10.2.1.3. Rest of Latin America

        10.2.2. By Type

        10.2.3. By Robots

        10.2.4. By Industry

    10.3. Market Attractiveness Analysis

        10.3.1. By Country

        10.3.2. By Type

        10.3.3. By Robots

        10.3.4. By Industry

    10.4. Key Takeaways

11. Western Europe Market Analysis 2019 to 2023 and Forecast 2024 to 2034, By Country

    11.1. Historical Market Size Value (US$ Million) Trend Analysis By Market Taxonomy, 2019 to 2023

    11.2. Market Size Value (US$ Million) Forecast By Market Taxonomy, 2024 to 2034

        11.2.1. By Country

            11.2.1.1. Germany

            11.2.1.2. UK

            11.2.1.3. France

            11.2.1.4. Spain

            11.2.1.5. Italy

            11.2.1.6. Rest of Western Europe

        11.2.2. By Type

        11.2.3. By Robots

        11.2.4. By Industry

    11.3. Market Attractiveness Analysis

        11.3.1. By Country

        11.3.2. By Type

        11.3.3. By Robots

        11.3.4. By Industry

    11.4. Key Takeaways

12. Eastern Europe Market Analysis 2019 to 2023 and Forecast 2024 to 2034, By Country

    12.1. Historical Market Size Value (US$ Million) Trend Analysis By Market Taxonomy, 2019 to 2023

    12.2. Market Size Value (US$ Million) Forecast By Market Taxonomy, 2024 to 2034

        12.2.1. By Country

            12.2.1.1. Poland

            12.2.1.2. Russia

            12.2.1.3. Czech Republic

            12.2.1.4. Romania

            12.2.1.5. Rest of Eastern Europe

        12.2.2. By Type

        12.2.3. By Robots

        12.2.4. By Industry

    12.3. Market Attractiveness Analysis

        12.3.1. By Country

        12.3.2. By Type

        12.3.3. By Robots

        12.3.4. By Industry

    12.4. Key Takeaways

13. South Asia and Pacific Market Analysis 2019 to 2023 and Forecast 2024 to 2034, By Country

    13.1. Historical Market Size Value (US$ Million) Trend Analysis By Market Taxonomy, 2019 to 2023

    13.2. Market Size Value (US$ Million) Forecast By Market Taxonomy, 2024 to 2034

        13.2.1. By Country

            13.2.1.1. India

            13.2.1.2. Bangladesh

            13.2.1.3. Australia

            13.2.1.4. New Zealand

            13.2.1.5. Rest of South Asia and Pacific

        13.2.2. By Type

        13.2.3. By Robots

        13.2.4. By Industry

    13.3. Market Attractiveness Analysis

        13.3.1. By Country

        13.3.2. By Type

        13.3.3. By Robots

        13.3.4. By Industry

    13.4. Key Takeaways

14. East Asia Market Analysis 2019 to 2023 and Forecast 2024 to 2034, By Country

    14.1. Historical Market Size Value (US$ Million) Trend Analysis By Market Taxonomy, 2019 to 2023

    14.2. Market Size Value (US$ Million) Forecast By Market Taxonomy, 2024 to 2034

        14.2.1. By Country

            14.2.1.1. China

            14.2.1.2. Japan

            14.2.1.3. South Korea

        14.2.2. By Type

        14.2.3. By Robots

        14.2.4. By Industry

    14.3. Market Attractiveness Analysis

        14.3.1. By Country

        14.3.2. By Type

        14.3.3. By Robots

        14.3.4. By Industry

    14.4. Key Takeaways

15. Middle East and Africa Market Analysis 2019 to 2023 and Forecast 2024 to 2034, By Country

    15.1. Historical Market Size Value (US$ Million) Trend Analysis By Market Taxonomy, 2019 to 2023

    15.2. Market Size Value (US$ Million) Forecast By Market Taxonomy, 2024 to 2034

        15.2.1. By Country

            15.2.1.1. GCC Countries

            15.2.1.2. South Africa

            15.2.1.3. Israel

            15.2.1.4. Rest of MEA

        15.2.2. By Type

        15.2.3. By Robots

        15.2.4. By Industry

    15.3. Market Attractiveness Analysis

        15.3.1. By Country

        15.3.2. By Type

        15.3.3. By Robots

        15.3.4. By Industry

    15.4. Key Takeaways

16. Key Countries Market Analysis

    16.1. USA

        16.1.1. Pricing Analysis

        16.1.2. Market Share Analysis, 2023

            16.1.2.1. By Type

            16.1.2.2. By Robots

            16.1.2.3. By Industry

    16.2. Canada

        16.2.1. Pricing Analysis

        16.2.2. Market Share Analysis, 2023

            16.2.2.1. By Type

            16.2.2.2. By Robots

            16.2.2.3. By Industry

    16.3. Brazil

        16.3.1. Pricing Analysis

        16.3.2. Market Share Analysis, 2023

            16.3.2.1. By Type

            16.3.2.2. By Robots

            16.3.2.3. By Industry

    16.4. Mexico

        16.4.1. Pricing Analysis

        16.4.2. Market Share Analysis, 2023

            16.4.2.1. By Type

            16.4.2.2. By Robots

            16.4.2.3. By Industry

    16.5. Germany

        16.5.1. Pricing Analysis

        16.5.2. Market Share Analysis, 2023

            16.5.2.1. By Type

            16.5.2.2. By Robots

            16.5.2.3. By Industry

    16.6. UK

        16.6.1. Pricing Analysis

        16.6.2. Market Share Analysis, 2023

            16.6.2.1. By Type

            16.6.2.2. By Robots

            16.6.2.3. By Industry

    16.7. France

        16.7.1. Pricing Analysis

        16.7.2. Market Share Analysis, 2023

            16.7.2.1. By Type

            16.7.2.2. By Robots

            16.7.2.3. By Industry

    16.8. Spain

        16.8.1. Pricing Analysis

        16.8.2. Market Share Analysis, 2023

            16.8.2.1. By Type

            16.8.2.2. By Robots

            16.8.2.3. By Industry

    16.9. Italy

        16.9.1. Pricing Analysis

        16.9.2. Market Share Analysis, 2023

            16.9.2.1. By Type

            16.9.2.2. By Robots

            16.9.2.3. By Industry

    16.10. Poland

        16.10.1. Pricing Analysis

        16.10.2. Market Share Analysis, 2023

            16.10.2.1. By Type

            16.10.2.2. By Robots

            16.10.2.3. By Industry

    16.11. Russia

        16.11.1. Pricing Analysis

        16.11.2. Market Share Analysis, 2023

            16.11.2.1. By Type

            16.11.2.2. By Robots

            16.11.2.3. By Industry

    16.12. Czech Republic

        16.12.1. Pricing Analysis

        16.12.2. Market Share Analysis, 2023

            16.12.2.1. By Type

            16.12.2.2. By Robots

            16.12.2.3. By Industry

    16.13. Romania

        16.13.1. Pricing Analysis

        16.13.2. Market Share Analysis, 2023

            16.13.2.1. By Type

            16.13.2.2. By Robots

            16.13.2.3. By Industry

    16.14. India

        16.14.1. Pricing Analysis

        16.14.2. Market Share Analysis, 2023

            16.14.2.1. By Type

            16.14.2.2. By Robots

            16.14.2.3. By Industry

    16.15. Bangladesh

        16.15.1. Pricing Analysis

        16.15.2. Market Share Analysis, 2023

            16.15.2.1. By Type

            16.15.2.2. By Robots

            16.15.2.3. By Industry

    16.16. Australia

        16.16.1. Pricing Analysis

        16.16.2. Market Share Analysis, 2023

            16.16.2.1. By Type

            16.16.2.2. By Robots

            16.16.2.3. By Industry

    16.17. New Zealand

        16.17.1. Pricing Analysis

        16.17.2. Market Share Analysis, 2023

            16.17.2.1. By Type

            16.17.2.2. By Robots

            16.17.2.3. By Industry

    16.18. China

        16.18.1. Pricing Analysis

        16.18.2. Market Share Analysis, 2023

            16.18.2.1. By Type

            16.18.2.2. By Robots

            16.18.2.3. By Industry

    16.19. Japan

        16.19.1. Pricing Analysis

        16.19.2. Market Share Analysis, 2023

            16.19.2.1. By Type

            16.19.2.2. By Robots

            16.19.2.3. By Industry

    16.20. South Korea

        16.20.1. Pricing Analysis

        16.20.2. Market Share Analysis, 2023

            16.20.2.1. By Type

            16.20.2.2. By Robots

            16.20.2.3. By Industry

    16.21. GCC Countries

        16.21.1. Pricing Analysis

        16.21.2. Market Share Analysis, 2023

            16.21.2.1. By Type

            16.21.2.2. By Robots

            16.21.2.3. By Industry

    16.22. South Africa

        16.22.1. Pricing Analysis

        16.22.2. Market Share Analysis, 2023

            16.22.2.1. By Type

            16.22.2.2. By Robots

            16.22.2.3. By Industry

    16.23. Israel

        16.23.1. Pricing Analysis

        16.23.2. Market Share Analysis, 2023

            16.23.2.1. By Type

            16.23.2.2. By Robots

            16.23.2.3. By Industry

17. Market Structure Analysis

    17.1. Competition Dashboard

    17.2. Competition Benchmarking

    17.3. Market Share Analysis of Top Players

        17.3.1. By Regional

        17.3.2. By Type

        17.3.3. By Robots

        17.3.4. By Industry

18. Competition Analysis

    18.1. Competition Deep Dive

        18.1.1. ABB

            18.1.1.1. Overview

            18.1.1.2. Product Portfolio

            18.1.1.3. Profitability by Market Segments

            18.1.1.4. Sales Footprint

            18.1.1.5. Strategy Overview

                18.1.1.5.1. Marketing Strategy

        18.1.2. Aceita

            18.1.2.1. Overview

            18.1.2.2. Product Portfolio

            18.1.2.3. Profitability by Market Segments

            18.1.2.4. Sales Footprint

            18.1.2.5. Strategy Overview

                18.1.2.5.1. Marketing Strategy

        18.1.3. Aibrain Inc.

            18.1.3.1. Overview

            18.1.3.2. Product Portfolio

            18.1.3.3. Profitability by Market Segments

            18.1.3.4. Sales Footprint

            18.1.3.5. Strategy Overview

                18.1.3.5.1. Marketing Strategy

        18.1.4. Amtec Solutions Group

            18.1.4.1. Overview

            18.1.4.2. Product Portfolio

            18.1.4.3. Profitability by Market Segments

            18.1.4.4. Sales Footprint

            18.1.4.5. Strategy Overview

                18.1.4.5.1. Marketing Strategy

        18.1.5. Artiminds Robotics GmbH

            18.1.5.1. Overview

            18.1.5.2. Product Portfolio

            18.1.5.3. Profitability by Market Segments

            18.1.5.4. Sales Footprint

            18.1.5.5. Strategy Overview

                18.1.5.5.1. Marketing Strategy

        18.1.6. Bastian Solutions, LLC

            18.1.6.1. Overview

            18.1.6.2. Product Portfolio

            18.1.6.3. Profitability by Market Segments

            18.1.6.4. Sales Footprint

            18.1.6.5. Strategy Overview

                18.1.6.5.1. Marketing Strategy

        18.1.7. BHS Robotics

            18.1.7.1. Overview

            18.1.7.2. Product Portfolio

            18.1.7.3. Profitability by Market Segments

            18.1.7.4. Sales Footprint

            18.1.7.5. Strategy Overview

                18.1.7.5.1. Marketing Strategy

        18.1.8. Brain Corporation

            18.1.8.1. Overview

            18.1.8.2. Product Portfolio

            18.1.8.3. Profitability by Market Segments

            18.1.8.4. Sales Footprint

            18.1.8.5. Strategy Overview

                18.1.8.5.1. Marketing Strategy

        18.1.9. Cloudminds

            18.1.9.1. Overview

            18.1.9.2. Product Portfolio

            18.1.9.3. Profitability by Market Segments

            18.1.9.4. Sales Footprint

            18.1.9.5. Strategy Overview

                18.1.9.5.1. Marketing Strategy

        18.1.10. Comau

            18.1.10.1. Overview

            18.1.10.2. Product Portfolio

            18.1.10.3. Profitability by Market Segments

            18.1.10.4. Sales Footprint

            18.1.10.5. Strategy Overview

                18.1.10.5.1. Marketing Strategy

        18.1.11. Denso Corporation

            18.1.11.1. Overview

            18.1.11.2. Product Portfolio

            18.1.11.3. Profitability by Market Segments

            18.1.11.4. Sales Footprint

            18.1.11.5. Strategy Overview

                18.1.11.5.1. Marketing Strategy

        18.1.12. Dynamic Automation

            18.1.12.1. Overview

            18.1.12.2. Product Portfolio

            18.1.12.3. Profitability by Market Segments

            18.1.12.4. Sales Footprint

            18.1.12.5. Strategy Overview

                18.1.12.5.1. Marketing Strategy

        18.1.13. Dynamic Robotics

            18.1.13.1. Overview

            18.1.13.2. Product Portfolio

            18.1.13.3. Profitability by Market Segments

            18.1.13.4. Sales Footprint

            18.1.13.5. Strategy Overview

                18.1.13.5.1. Marketing Strategy

        18.1.14. Epson America, Inc.

            18.1.14.1. Overview

            18.1.14.2. Product Portfolio

            18.1.14.3. Profitability by Market Segments

            18.1.14.4. Sales Footprint

            18.1.14.5. Strategy Overview

                18.1.14.5.1. Marketing Strategy

        18.1.15. Fanuc Corporation

            18.1.15.1. Overview

            18.1.15.2. Product Portfolio

            18.1.15.3. Profitability by Market Segments

            18.1.15.4. Sales Footprint

            18.1.15.5. Strategy Overview

                18.1.15.5.1. Marketing Strategy

19. Assumptions & Acronyms Used

20. Research Methodology

List of Tables

Table 1: Global Market Value (US$ Million) Forecast by Region, 2019 to 2034

Table 2: Global Market Value (US$ Million) Forecast by Type, 2019 to 2034

Table 3: Global Market Value (US$ Million) Forecast by Robots, 2019 to 2034

Table 4: Global Market Value (US$ Million) Forecast by Industry, 2019 to 2034

Table 5: North America Market Value (US$ Million) Forecast by Country, 2019 to 2034

Table 6: North America Market Value (US$ Million) Forecast by Type, 2019 to 2034

Table 7: North America Market Value (US$ Million) Forecast by Robots, 2019 to 2034

Table 8: North America Market Value (US$ Million) Forecast by Industry, 2019 to 2034

Table 9: Latin America Market Value (US$ Million) Forecast by Country, 2019 to 2034

Table 10: Latin America Market Value (US$ Million) Forecast by Type, 2019 to 2034

Table 11: Latin America Market Value (US$ Million) Forecast by Robots, 2019 to 2034

Table 12: Latin America Market Value (US$ Million) Forecast by Industry, 2019 to 2034

Table 13: Western Europe Market Value (US$ Million) Forecast by Country, 2019 to 2034

Table 14: Western Europe Market Value (US$ Million) Forecast by Type, 2019 to 2034

Table 15: Western Europe Market Value (US$ Million) Forecast by Robots, 2019 to 2034

Table 16: Western Europe Market Value (US$ Million) Forecast by Industry, 2019 to 2034

Table 17: Eastern Europe Market Value (US$ Million) Forecast by Country, 2019 to 2034

Table 18: Eastern Europe Market Value (US$ Million) Forecast by Type, 2019 to 2034

Table 19: Eastern Europe Market Value (US$ Million) Forecast by Robots, 2019 to 2034

Table 20: Eastern Europe Market Value (US$ Million) Forecast by Industry, 2019 to 2034

Table 21: South Asia and Pacific Market Value (US$ Million) Forecast by Country, 2019 to 2034

Table 22: South Asia and Pacific Market Value (US$ Million) Forecast by Type, 2019 to 2034

Table 23: South Asia and Pacific Market Value (US$ Million) Forecast by Robots, 2019 to 2034

Table 24: South Asia and Pacific Market Value (US$ Million) Forecast by Industry, 2019 to 2034

Table 25: East Asia Market Value (US$ Million) Forecast by Country, 2019 to 2034

Table 26: East Asia Market Value (US$ Million) Forecast by Type, 2019 to 2034

Table 27: East Asia Market Value (US$ Million) Forecast by Robots, 2019 to 2034

Table 28: East Asia Market Value (US$ Million) Forecast by Industry, 2019 to 2034

Table 29: Middle East and Africa Market Value (US$ Million) Forecast by Country, 2019 to 2034

Table 30: Middle East and Africa Market Value (US$ Million) Forecast by Type, 2019 to 2034

Table 31: Middle East and Africa Market Value (US$ Million) Forecast by Robots, 2019 to 2034

Table 32: Middle East and Africa Market Value (US$ Million) Forecast by Industry, 2019 to 2034

List of Charts

Figure 1: Global Market Value (US$ Million) by Type, 2024 to 2034

Figure 2: Global Market Value (US$ Million) by Robots, 2024 to 2034

Figure 3: Global Market Value (US$ Million) by Industry, 2024 to 2034

Figure 4: Global Market Value (US$ Million) by Region, 2024 to 2034

Figure 5: Global Market Value (US$ Million) Analysis by Region, 2019 to 2034

Figure 6: Global Market Value Share (%) and BPS Analysis by Region, 2024 to 2034

Figure 7: Global Market Y-o-Y Growth (%) Projections by Region, 2024 to 2034

Figure 8: Global Market Value (US$ Million) Analysis by Type, 2019 to 2034

Figure 9: Global Market Value Share (%) and BPS Analysis by Type, 2024 to 2034

Figure 10: Global Market Y-o-Y Growth (%) Projections by Type, 2024 to 2034

Figure 11: Global Market Value (US$ Million) Analysis by Robots, 2019 to 2034

Figure 12: Global Market Value Share (%) and BPS Analysis by Robots, 2024 to 2034

Figure 13: Global Market Y-o-Y Growth (%) Projections by Robots, 2024 to 2034

Figure 14: Global Market Value (US$ Million) Analysis by Industry, 2019 to 2034

Figure 15: Global Market Value Share (%) and BPS Analysis by Industry, 2024 to 2034

Figure 16: Global Market Y-o-Y Growth (%) Projections by Industry, 2024 to 2034

Figure 17: Global Market Attractiveness by Type, 2024 to 2034

Figure 18: Global Market Attractiveness by Robots, 2024 to 2034

Figure 19: Global Market Attractiveness by Industry, 2024 to 2034

Figure 20: Global Market Attractiveness by Region, 2024 to 2034

Figure 21: North America Market Value (US$ Million) by Type, 2024 to 2034

Figure 22: North America Market Value (US$ Million) by Robots, 2024 to 2034

Figure 23: North America Market Value (US$ Million) by Industry, 2024 to 2034

Figure 24: North America Market Value (US$ Million) by Country, 2024 to 2034

Figure 25: North America Market Value (US$ Million) Analysis by Country, 2019 to 2034

Figure 26: North America Market Value Share (%) and BPS Analysis by Country, 2024 to 2034

Figure 27: North America Market Y-o-Y Growth (%) Projections by Country, 2024 to 2034

Figure 28: North America Market Value (US$ Million) Analysis by Type, 2019 to 2034

Figure 29: North America Market Value Share (%) and BPS Analysis by Type, 2024 to 2034

Figure 30: North America Market Y-o-Y Growth (%) Projections by Type, 2024 to 2034

Figure 31: North America Market Value (US$ Million) Analysis by Robots, 2019 to 2034

Figure 32: North America Market Value Share (%) and BPS Analysis by Robots, 2024 to 2034

Figure 33: North America Market Y-o-Y Growth (%) Projections by Robots, 2024 to 2034

Figure 34: North America Market Value (US$ Million) Analysis by Industry, 2019 to 2034

Figure 35: North America Market Value Share (%) and BPS Analysis by Industry, 2024 to 2034

Figure 36: North America Market Y-o-Y Growth (%) Projections by Industry, 2024 to 2034

Figure 37: North America Market Attractiveness by Type, 2024 to 2034

Figure 38: North America Market Attractiveness by Robots, 2024 to 2034

Figure 39: North America Market Attractiveness by Industry, 2024 to 2034

Figure 40: North America Market Attractiveness by Country, 2024 to 2034

Figure 41: Latin America Market Value (US$ Million) by Type, 2024 to 2034

Figure 42: Latin America Market Value (US$ Million) by Robots, 2024 to 2034

Figure 43: Latin America Market Value (US$ Million) by Industry, 2024 to 2034

Figure 44: Latin America Market Value (US$ Million) by Country, 2024 to 2034

Figure 45: Latin America Market Value (US$ Million) Analysis by Country, 2019 to 2034

Figure 46: Latin America Market Value Share (%) and BPS Analysis by Country, 2024 to 2034

Figure 47: Latin America Market Y-o-Y Growth (%) Projections by Country, 2024 to 2034

Figure 48: Latin America Market Value (US$ Million) Analysis by Type, 2019 to 2034

Figure 49: Latin America Market Value Share (%) and BPS Analysis by Type, 2024 to 2034

Figure 50: Latin America Market Y-o-Y Growth (%) Projections by Type, 2024 to 2034

Figure 51: Latin America Market Value (US$ Million) Analysis by Robots, 2019 to 2034

Figure 52: Latin America Market Value Share (%) and BPS Analysis by Robots, 2024 to 2034

Figure 53: Latin America Market Y-o-Y Growth (%) Projections by Robots, 2024 to 2034

Figure 54: Latin America Market Value (US$ Million) Analysis by Industry, 2019 to 2034

Figure 55: Latin America Market Value Share (%) and BPS Analysis by Industry, 2024 to 2034

Figure 56: Latin America Market Y-o-Y Growth (%) Projections by Industry, 2024 to 2034

Figure 57: Latin America Market Attractiveness by Type, 2024 to 2034

Figure 58: Latin America Market Attractiveness by Robots, 2024 to 2034

Figure 59: Latin America Market Attractiveness by Industry, 2024 to 2034

Figure 60: Latin America Market Attractiveness by Country, 2024 to 2034

Figure 61: Western Europe Market Value (US$ Million) by Type, 2024 to 2034

Figure 62: Western Europe Market Value (US$ Million) by Robots, 2024 to 2034

Figure 63: Western Europe Market Value (US$ Million) by Industry, 2024 to 2034

Figure 64: Western Europe Market Value (US$ Million) by Country, 2024 to 2034

Figure 65: Western Europe Market Value (US$ Million) Analysis by Country, 2019 to 2034

Figure 66: Western Europe Market Value Share (%) and BPS Analysis by Country, 2024 to 2034

Figure 67: Western Europe Market Y-o-Y Growth (%) Projections by Country, 2024 to 2034

Figure 68: Western Europe Market Value (US$ Million) Analysis by Type, 2019 to 2034

Figure 69: Western Europe Market Value Share (%) and BPS Analysis by Type, 2024 to 2034

Figure 70: Western Europe Market Y-o-Y Growth (%) Projections by Type, 2024 to 2034

Figure 71: Western Europe Market Value (US$ Million) Analysis by Robots, 2019 to 2034

Figure 72: Western Europe Market Value Share (%) and BPS Analysis by Robots, 2024 to 2034

Figure 73: Western Europe Market Y-o-Y Growth (%) Projections by Robots, 2024 to 2034

Figure 74: Western Europe Market Value (US$ Million) Analysis by Industry, 2019 to 2034

Figure 75: Western Europe Market Value Share (%) and BPS Analysis by Industry, 2024 to 2034

Figure 76: Western Europe Market Y-o-Y Growth (%) Projections by Industry, 2024 to 2034

Figure 77: Western Europe Market Attractiveness by Type, 2024 to 2034

Figure 78: Western Europe Market Attractiveness by Robots, 2024 to 2034

Figure 79: Western Europe Market Attractiveness by Industry, 2024 to 2034

Figure 80: Western Europe Market Attractiveness by Country, 2024 to 2034

Figure 81: Eastern Europe Market Value (US$ Million) by Type, 2024 to 2034

Figure 82: Eastern Europe Market Value (US$ Million) by Robots, 2024 to 2034

Figure 83: Eastern Europe Market Value (US$ Million) by Industry, 2024 to 2034

Figure 84: Eastern Europe Market Value (US$ Million) by Country, 2024 to 2034

Figure 85: Eastern Europe Market Value (US$ Million) Analysis by Country, 2019 to 2034

Figure 86: Eastern Europe Market Value Share (%) and BPS Analysis by Country, 2024 to 2034

Figure 87: Eastern Europe Market Y-o-Y Growth (%) Projections by Country, 2024 to 2034

Figure 88: Eastern Europe Market Value (US$ Million) Analysis by Type, 2019 to 2034

Figure 89: Eastern Europe Market Value Share (%) and BPS Analysis by Type, 2024 to 2034

Figure 90: Eastern Europe Market Y-o-Y Growth (%) Projections by Type, 2024 to 2034

Figure 91: Eastern Europe Market Value (US$ Million) Analysis by Robots, 2019 to 2034

Figure 92: Eastern Europe Market Value Share (%) and BPS Analysis by Robots, 2024 to 2034

Figure 93: Eastern Europe Market Y-o-Y Growth (%) Projections by Robots, 2024 to 2034

Figure 94: Eastern Europe Market Value (US$ Million) Analysis by Industry, 2019 to 2034

Figure 95: Eastern Europe Market Value Share (%) and BPS Analysis by Industry, 2024 to 2034

Figure 96: Eastern Europe Market Y-o-Y Growth (%) Projections by Industry, 2024 to 2034

Figure 97: Eastern Europe Market Attractiveness by Type, 2024 to 2034

Figure 98: Eastern Europe Market Attractiveness by Robots, 2024 to 2034

Figure 99: Eastern Europe Market Attractiveness by Industry, 2024 to 2034

Figure 100: Eastern Europe Market Attractiveness by Country, 2024 to 2034

Figure 101: South Asia and Pacific Market Value (US$ Million) by Type, 2024 to 2034

Figure 102: South Asia and Pacific Market Value (US$ Million) by Robots, 2024 to 2034

Figure 103: South Asia and Pacific Market Value (US$ Million) by Industry, 2024 to 2034

Figure 104: South Asia and Pacific Market Value (US$ Million) by Country, 2024 to 2034

Figure 105: South Asia and Pacific Market Value (US$ Million) Analysis by Country, 2019 to 2034

Figure 106: South Asia and Pacific Market Value Share (%) and BPS Analysis by Country, 2024 to 2034

Figure 107: South Asia and Pacific Market Y-o-Y Growth (%) Projections by Country, 2024 to 2034

Figure 108: South Asia and Pacific Market Value (US$ Million) Analysis by Type, 2019 to 2034

Figure 109: South Asia and Pacific Market Value Share (%) and BPS Analysis by Type, 2024 to 2034

Figure 110: South Asia and Pacific Market Y-o-Y Growth (%) Projections by Type, 2024 to 2034

Figure 111: South Asia and Pacific Market Value (US$ Million) Analysis by Robots, 2019 to 2034

Figure 112: South Asia and Pacific Market Value Share (%) and BPS Analysis by Robots, 2024 to 2034

Figure 113: South Asia and Pacific Market Y-o-Y Growth (%) Projections by Robots, 2024 to 2034

Figure 114: South Asia and Pacific Market Value (US$ Million) Analysis by Industry, 2019 to 2034

Figure 115: South Asia and Pacific Market Value Share (%) and BPS Analysis by Industry, 2024 to 2034

Figure 116: South Asia and Pacific Market Y-o-Y Growth (%) Projections by Industry, 2024 to 2034

Figure 117: South Asia and Pacific Market Attractiveness by Type, 2024 to 2034

Figure 118: South Asia and Pacific Market Attractiveness by Robots, 2024 to 2034

Figure 119: South Asia and Pacific Market Attractiveness by Industry, 2024 to 2034

Figure 120: South Asia and Pacific Market Attractiveness by Country, 2024 to 2034

Figure 121: East Asia Market Value (US$ Million) by Type, 2024 to 2034

Figure 122: East Asia Market Value (US$ Million) by Robots, 2024 to 2034

Figure 123: East Asia Market Value (US$ Million) by Industry, 2024 to 2034

Figure 124: East Asia Market Value (US$ Million) by Country, 2024 to 2034

Figure 125: East Asia Market Value (US$ Million) Analysis by Country, 2019 to 2034

Figure 126: East Asia Market Value Share (%) and BPS Analysis by Country, 2024 to 2034

Figure 127: East Asia Market Y-o-Y Growth (%) Projections by Country, 2024 to 2034

Figure 128: East Asia Market Value (US$ Million) Analysis by Type, 2019 to 2034

Figure 129: East Asia Market Value Share (%) and BPS Analysis by Type, 2024 to 2034

Figure 130: East Asia Market Y-o-Y Growth (%) Projections by Type, 2024 to 2034

Figure 131: East Asia Market Value (US$ Million) Analysis by Robots, 2019 to 2034

Figure 132: East Asia Market Value Share (%) and BPS Analysis by Robots, 2024 to 2034

Figure 133: East Asia Market Y-o-Y Growth (%) Projections by Robots, 2024 to 2034

Figure 134: East Asia Market Value (US$ Million) Analysis by Industry, 2019 to 2034

Figure 135: East Asia Market Value Share (%) and BPS Analysis by Industry, 2024 to 2034

Figure 136: East Asia Market Y-o-Y Growth (%) Projections by Industry, 2024 to 2034

Figure 137: East Asia Market Attractiveness by Type, 2024 to 2034

Figure 138: East Asia Market Attractiveness by Robots, 2024 to 2034

Figure 139: East Asia Market Attractiveness by Industry, 2024 to 2034

Figure 140: East Asia Market Attractiveness by Country, 2024 to 2034

Figure 141: Middle East and Africa Market Value (US$ Million) by Type, 2024 to 2034

Figure 142: Middle East and Africa Market Value (US$ Million) by Robots, 2024 to 2034

Figure 143: Middle East and Africa Market Value (US$ Million) by Industry, 2024 to 2034

Figure 144: Middle East and Africa Market Value (US$ Million) by Country, 2024 to 2034

Figure 145: Middle East and Africa Market Value (US$ Million) Analysis by Country, 2019 to 2034

Figure 146: Middle East and Africa Market Value Share (%) and BPS Analysis by Country, 2024 to 2034

Figure 147: Middle East and Africa Market Y-o-Y Growth (%) Projections by Country, 2024 to 2034

Figure 148: Middle East and Africa Market Value (US$ Million) Analysis by Type, 2019 to 2034

Figure 149: Middle East and Africa Market Value Share (%) and BPS Analysis by Type, 2024 to 2034

Figure 150: Middle East and Africa Market Y-o-Y Growth (%) Projections by Type, 2024 to 2034

Figure 151: Middle East and Africa Market Value (US$ Million) Analysis by Robots, 2019 to 2034

Figure 152: Middle East and Africa Market Value Share (%) and BPS Analysis by Robots, 2024 to 2034

Figure 153: Middle East and Africa Market Y-o-Y Growth (%) Projections by Robots, 2024 to 2034

Figure 154: Middle East and Africa Market Value (US$ Million) Analysis by Industry, 2019 to 2034

Figure 155: Middle East and Africa Market Value Share (%) and BPS Analysis by Industry, 2024 to 2034

Figure 156: Middle East and Africa Market Y-o-Y Growth (%) Projections by Industry, 2024 to 2034

Figure 157: Middle East and Africa Market Attractiveness by Type, 2024 to 2034

Figure 158: Middle East and Africa Market Attractiveness by Robots, 2024 to 2034

Figure 159: Middle East and Africa Market Attractiveness by Industry, 2024 to 2034

Figure 160: Middle East and Africa Market Attractiveness by Country, 2024 to 2034

Recommendations

Technology

Robot Operating System Market

Published : July 2023

Industrial Automation

Industrial Robot Controllers Market

Published : July 2022

Technology

Motion Control Software in Robotics Market

Published : July 2022

Explore Industrial Automation Insights

View Reports

Robot Controller, Integrator and Software Market