The global pallet box market is valued at USD 8.9 billion in 2025 and is set to reach USD 19.4 billion by 2035, recording an absolute increase of USD 10.5 billion over the forecast period. This translates into a total growth of 118.0%, with the market forecast to expand at a CAGR of 8.1% between 2025 and 2035. According to FMI’s report series on packaging circularity and compliance under EU and US regulatory frameworks, the overall market size is expected to grow by approximately 2.2X during the same period, supported by increasing demand for efficient bulk handling solutions, growing adoption of reusable packaging systems, and rising requirements for cost-effective storage across automotive, pharmaceutical, chemical, and agricultural sectors.
Between 2025 and 2030, the pallet box market is projected to expand from USD 8.9 billion to USD 13.1 billion, resulting in a value increase of USD 4.2 billion, which represents 40.0% of the total forecast growth for the decade. This phase of development will be shaped by increasing demand for standardized logistics solutions, rising industrial production patterns enabling automated handling formats, and growing availability of advanced manufacturing technologies across distribution centers and warehouse facilities.
Between 2030 and 2035, the market is forecast to grow from USD 13.1 billion to USD 19.4 billion, adding another USD 6.3 billion, which constitutes 60.0% of the overall ten-year expansion. This period is expected to be characterized by the advancement of smart tracking integration, the adoption of modular design systems for space optimization, and the development of enhanced structural reinforcement across diverse industrial categories. The growing emphasis on supply chain efficiency and returnable packaging infrastructure will drive demand for advanced pallet box varieties with superior load-bearing properties, improved stackability features, and extended lifecycle characteristics.
Industrial manufacturing is another influential segment. Automotive, metal, chemical, and electronics manufacturers use pallet boxes for handling components, semi-finished goods, and bulk materials. Their ability to withstand heavy loads, resist impact, and endure harsh environments supports continuous operations in factories and industrial plants. As production volumes increase and lean manufacturing practices become more widespread, demand for standardized and reusable pallet boxes that support organized and efficient workflows continues to rise.
Technological innovations are enhancing product performance and adoption. Manufacturers are developing collapsible and lightweight designs that reduce return logistics costs, improve handling, and lower storage requirements. RFID tags, QR codes, and smart tracking features are being integrated to support real-time visibility across supply chains. These enhancements make pallet boxes more valuable for industries prioritizing traceability and inventory accuracy.
Growing international trade is also reinforcing demand. Exporters rely on pallet boxes for bulk shipment of goods that require strong, stable, and stackable packaging capable of withstanding long-distance transit. As cross-border logistics expand, businesses seek packaging solutions that minimize damage, maximize container space, and comply with global transport requirements.
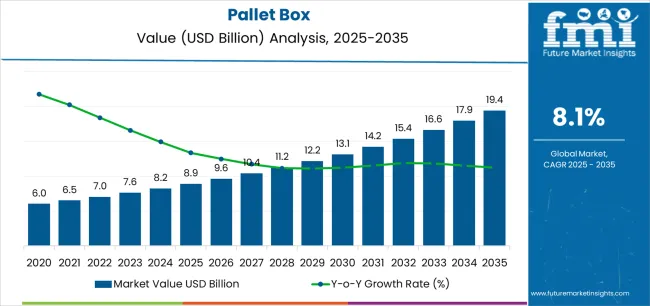
| Metric | Value |
|---|---|
| Estimated Value in (2025E) | USD 8.9 billion |
| Forecast Value in (2035F) | USD 19.4 billion |
| Forecast CAGR (2025 to 2035) | 8.10% |
The pallet box market is primarily driven by the industrial packaging market, contributing around 35-40%. Pallet boxes are essential for the transportation and storage of bulk goods in industries like automotive, chemicals, and manufacturing. These boxes provide structural integrity, enabling efficient stacking and protection of products during transit. Their heavy-duty design makes them suitable for handling large quantities of materials, whether for export or within warehouses. The logistics and supply chain market contributes about 25-30%, where pallet boxes are crucial in enhancing the efficiency of warehouse storage and distribution.
The boxes’ ability to be stacked, accessed easily, and securely transported ensures they are a mainstay in logistics. In the e-commerce packaging market, approximately 15-20% of demand stems from the need for durable, secure packaging solutions for bulk shipments, especially as online retail continues to grow, particularly for larger products. The food and beverage packaging market represents about 10-12%, as pallet boxes are commonly used in the bulk storage and transportation of packaged food products, helping maintain product integrity during distribution. The pharmaceutical packaging market also plays a role, contributing 8-10% of demand, with pallet boxes used to handle bulk pharmaceutical supplies, ensuring safety, traceability, and ease of movement in warehouses and shipping.
Market expansion is being supported by the increasing global demand for efficient bulk handling solutions and the corresponding shift toward reusable containers that can provide superior operational characteristics while meeting user requirements for product protection and space-efficient storage processes. Modern businesses are increasingly focused on incorporating packaging formats that can enhance warehouse productivity while satisfying demands for consistent, reliably performing containers and optimized material flow practices. Pallet boxes' proven ability to deliver structural strength, versatility, and diverse application possibilities makes them essential packaging for logistics operators and efficiency-conscious industrial users.
The growing emphasis on supply chain optimization and returnable packaging economics is driving demand for high-performance pallet box systems that can support distinctive operational positioning and comprehensive logistics integration across automotive parts, pharmaceutical products, and agricultural produce categories. User preference for containers that combine functional excellence with handling flexibility is creating opportunities for innovative implementations in both traditional and emerging industrial applications. The rising influence of e-commerce fulfillment centers and modern distribution infrastructure is also contributing to increased adoption of pallet boxes that can provide authentic performance benefits and reliable operational characteristics.
The market is segmented by material type, design type, load capacity, end-use industry, and region. By material type, the market is divided into plastic pallet boxes, metal pallet boxes, corrugated pallet boxes, and wood composite pallet boxes. Based on design type, the market is categorized into rigid pallet boxes, foldable pallet boxes, and collapsible sleeve pallet boxes. By load capacity, the market includes below 500 kg, 500-1000 kg, 1000-1500 kg, and above 1500 kg. By end-use industry, the market encompasses food & agriculture, automotive, pharmaceuticals & healthcare, chemicals & hazardous materials, and other industries. Regionally, the market is divided into North America, Europe, Asia Pacific, Latin America, Middle East & Africa, and other regions.
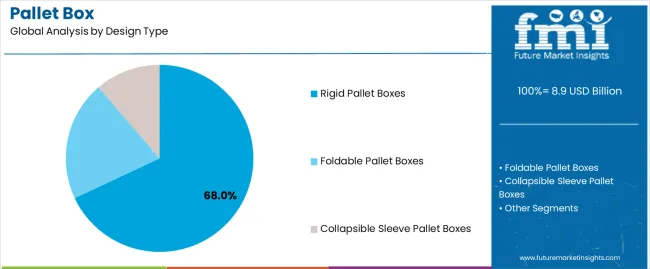
The rigid pallet boxes segment is projected to account for 68% of the pallet box market in 2025, reaffirming its position as the leading design category. Businesses and logistics facilities increasingly utilize rigid pallet boxes for their superior structural integrity characteristics, established handling efficiency, and essential functionality in diverse storage applications across multiple industrial categories. Rigid pallet boxes' standardized operational characteristics and proven load-bearing effectiveness directly address user requirements for reliable container performance and optimal storage value in commercial applications.
This design segment forms the foundation of modern pallet box utilization patterns, as it represents the format with the greatest operational reliability potential and established compatibility across multiple handling systems. Business investments in warehouse automation and logistics standardization continue to strengthen adoption among efficiency-conscious operators. With users prioritizing handling safety and space optimization, rigid pallet boxes align with both operational objectives and performance requirements, making them the central component of comprehensive logistics strategies.
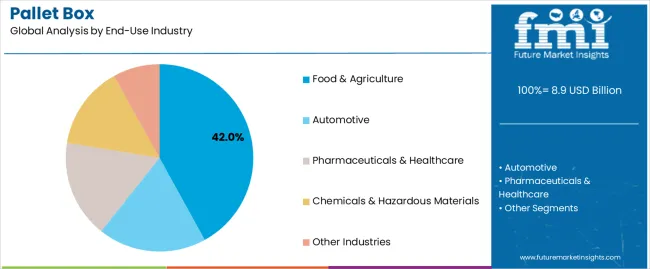
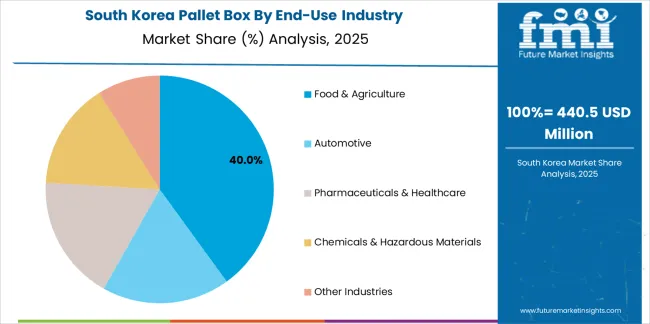
Food & agriculture is projected to represent 42% of the pallet box market in 2025, underscoring its critical role as the primary application for quality-focused businesses seeking superior product protection benefits and enhanced handling efficiency credentials. Commercial users and agricultural operations prefer food & agriculture applications for their established handling patterns, proven operational acceptance, and ability to maintain exceptional hygiene profiles while supporting versatile product offerings during diverse distribution experiences. Positioned as essential applications for discerning operators, food & agriculture offerings provide both operational penetration excellence and logistics positioning advantages.
The segment is supported by continuous improvement in ventilation design technology and the widespread availability of established food safety frameworks that enable compliance and premium positioning at the operational level. Additionally, logistics companies are optimizing container designs to support product differentiation and accessible handling strategies. As material handling technology continues to advance and operators seek efficient storage formats, food & agriculture applications will continue to drive market growth while supporting operational recognition and efficiency optimization strategies.
The pallet box market is advancing rapidly due to increasing logistics efficiency consciousness and growing need for returnable container choices that emphasize superior operational performance outcomes across industrial segments and distribution applications. However, the market faces challenges, including initial investment requirements, cleaning and maintenance needs, and return logistics complexity affecting operational economics. Innovation in modular design systems and smart tracking integration continues to influence market development and expansion patterns.
The growing adoption of pallet boxes in automated storage and retrieval systems is enabling businesses to develop operational patterns that provide distinctive efficiency benefits while commanding productivity positioning and enhanced throughput characteristics. Automated applications provide superior handling precision while allowing more sophisticated inventory management features across various industrial categories. Users are increasingly recognizing the functional advantages of pallet box positioning for premium operational protection and efficiency-conscious logistics integration.
Modern pallet box manufacturers are incorporating advanced tracking technologies, IoT sensors, and real-time monitoring systems to enhance visibility credentials, improve asset management outcomes, and meet commercial demands for intelligent logistics solutions. These systems improve operational effectiveness while enabling new applications, including temperature monitoring and location tracking programs. Advanced technology integration also allows manufacturers to support operational leadership positioning and efficiency optimization beyond traditional packaging operations.
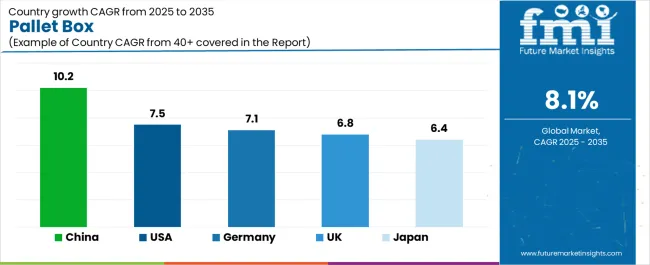
| Country | CAGR (2025-2035) |
|---|---|
| USA | 7.5% |
| Germany | 7.1% |
| UK | 6.8% |
| China | 10.2% |
| Japan | 6.4% |
The pallet box market is experiencing robust growth globally, with China leading at a 10.2% CAGR through 2035, driven by the expanding manufacturing sector, growing logistics infrastructure, and increasing adoption of standardized material handling systems. The USA follows at 7.5%, supported by rising warehouse automation trends, expanding e-commerce operations, and growing acceptance of returnable packaging solutions. Germany shows growth at 7.1%, emphasizing established industrial capabilities and comprehensive logistics development. The UK records 6.8%, focusing on efficient distribution systems and operational expansion. Japan demonstrates 6.4% growth, prioritizing quality handling solutions and technological advancement.
The report covers an in-depth analysis of 40+ countries; five top-performing countries are highlighted below.
Revenue from pallet box consumption and sales in the USA is projected to exhibit exceptional growth with a CAGR of 7.5% through 2035, driven by the country's rapidly expanding e-commerce fulfillment sector, favorable industrial attitudes toward automated handling, and initiatives promoting efficiency optimization across major distribution regions. The USA's position as a leading logistics market and increasing focus on returnable packaging development are creating substantial demand for high-quality pallet boxes in both commercial and specialty markets. Major distribution centers and industrial operators are establishing comprehensive handling capabilities to serve growing demand and emerging market opportunities.
Revenue from pallet box products in Germany is expanding at a CAGR of 7.1%, supported by rising logistics sophistication, growing automotive industry requirements, and expanding warehouse infrastructure. The country's developing automation capabilities and increasing commercial investment in advanced material handling are driving demand for pallet boxes across both imported and domestically produced applications. International logistics companies and domestic operators are establishing comprehensive operational networks to address growing market demand for quality pallet boxes and efficient storage solutions.
Revenue from pallet box products in the UK is projected to grow at a CAGR of 6.8% through 2035, supported by the country's mature distribution market, established logistics culture, and leadership in handling standards. Britain's sophisticated supply chain infrastructure and strong support for operational efficiency are creating steady demand for both traditional and innovative pallet box varieties. Leading logistics providers and specialty operators are establishing comprehensive operational strategies to serve both domestic markets and growing international opportunities.
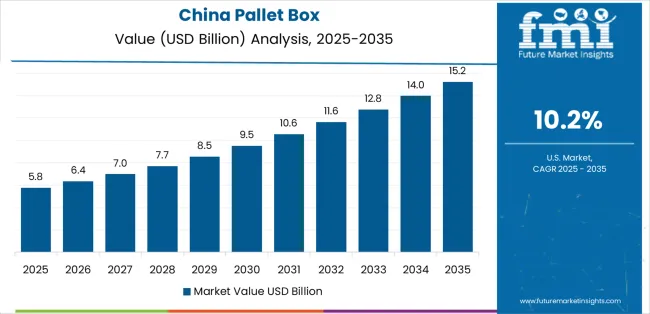
Revenue from pallet box products in China is projected to grow at a CAGR of 10.2% through 2035, driven by the country's emphasis on logistics expansion, manufacturing leadership, and sophisticated production capabilities for containers requiring specialized structural varieties. Chinese manufacturers and distributors consistently seek commercial-grade packaging that enhances operational differentiation and supports warehouse operations for both traditional and innovative industrial applications. The country's position as an Asian manufacturing leader continues to drive innovation in specialty pallet box applications and commercial production standards.
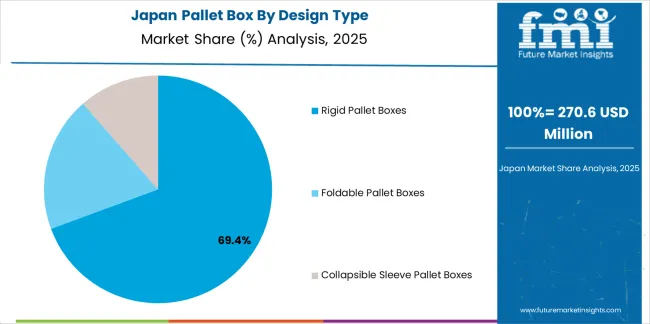
Revenue from pallet box products in Japan is projected to grow at a CAGR of 6.4% through 2035, supported by the country's emphasis on quality manufacturing, handling standards, and advanced technology integration requiring efficient storage solutions. Japanese businesses and industrial operators prioritize operational performance and handling precision, making pallet boxes essential packaging for both traditional and modern logistics applications. The country's comprehensive quality excellence and advancing automation patterns support continued market expansion.
The Europe pallet box market is projected to grow from USD 3.1 billion in 2025 to USD 6.5 billion by 2035, recording a CAGR of 7.7% over the forecast period. Germany leads the region with a 38.0% share in 2025, moderating slightly to 37.5% by 2035, supported by its strong industrial base and demand for premium, technically advanced material handling products. The United Kingdom follows with 20.0% in 2025, easing to 19.5% by 2035, driven by a sophisticated logistics market and emphasis on operational efficiency standards. France accounts for 17.0% in 2025, rising to 17.5% by 2035, reflecting steady adoption of automated handling solutions and distribution optimization. Italy holds 12.0% in 2025, expanding to 12.5% by 2035 as manufacturing innovation and specialty logistics applications grow. Spain contributes 8.0% in 2025, growing to 8.5% by 2035, supported by expanding agricultural sector and industrial goods handling. The Nordic countries rise from 3.5% in 2025 to 3.8% by 2035 on the back of strong efficiency adoption and advanced automation technologies. BENELUX decreases from 1.5% in 2025 to 0.7% share by 2035, reflecting market consolidation in mature, efficiency-focused markets.
The pallet box market is characterized by competition among established material handling manufacturers, specialized container producers, and integrated logistics solution companies. Companies are investing in injection molding technologies, advanced structural design systems, product innovation capabilities, and comprehensive distribution networks to deliver consistent, high-quality, and reliable pallet box systems. Innovation in modular enhancement, tracking technology methods, and application-specific product development is central to strengthening market position and customer satisfaction.
Schoeller Allibert leads the market with a strong focus on logistics innovation and comprehensive pallet box solutions, offering commercial container systems with emphasis on manufacturing excellence and technological heritage. ORBIS Corporation provides specialized material handling capabilities with a focus on global market applications and operational engineering networks. Craemer Group delivers integrated bulk packaging solutions with a focus on industrial positioning and operational efficiency. DS Smith specializes in comprehensive corrugated solutions with an emphasis on commercial applications. Rehrig Pacific Company focuses on comprehensive reusable packaging containers with advanced design and premium positioning capabilities.
The success of pallet boxes in meeting commercial logistics demands, operator-driven efficiency requirements, and performance integration will not only enhance operational protection outcomes but also strengthen global material handling capabilities. It will consolidate emerging regions' positions as hubs for efficient container production and align advanced economies with commercial logistics systems. This calls for a concerted effort by all stakeholders -- governments, industry bodies, manufacturers, distributors, and investors. Each can be a crucial enabler in preparing the market for its next phase of growth.
How Governments Could Spur Local Production and Adoption?
How Industry Bodies Could Support Market Development?
How Distributors and Industrial Players Could Strengthen the Ecosystem?
How Manufacturers Could Navigate the Shift?
| Items | Values |
|---|---|
| Quantitative Units (2025) | USD 8.9 billion |
| Material Type | Plastic Pallet Boxes, Metal Pallet Boxes, Corrugated Pallet Boxes, Wood Composite Pallet Boxes |
| Design Type | Rigid Pallet Boxes, Foldable Pallet Boxes, Collapsible Sleeve Pallet Boxes |
| Load Capacity | Below 500 kg, 500-1000 kg, 1000-1500 kg, Above 1500 kg |
| End-Use Industry | Food & Agriculture, Automotive, Pharmaceuticals & Healthcare, Chemicals & Hazardous Materials, Other Industries |
| Regions Covered | North America, Europe, Asia Pacific, Latin America, Middle East & Africa, Other Regions |
| Countries Covered | United States, Germany, United Kingdom, China, Japan, and 40+ countries |
| Key Companies Profiled | Schoeller Allibert, ORBIS Corporation, Craemer Group, DS Smith, Rehrig Pacific Company, and other leading pallet box companies |
| Additional Attributes | Dollar sales by material type, design type, load capacity, end-use industry, and region; regional demand trends, competitive landscape, technological advancements in structural engineering, modular design integration initiatives, tracking technology programs, and premium product development strategies |
The global pallet box is estimated to be valued at USD 8.9 billion in 2025.
The market size for the pallet box is projected to reach USD 19.4 billion by 2035.
The pallet box is expected to grow at a 8.1% CAGR between 2025 and 2035.
The key product types in pallet box are rigid pallet boxes , foldable pallet boxes and collapsible sleeve pallet boxes.
In terms of end-use industry, food & agriculture segment to command 42.0% share in the pallet box in 2025.


Our Research Products

The "Full Research Suite" delivers actionable market intel, deep dives on markets or technologies, so clients act faster, cut risk, and unlock growth.

The Leaderboard benchmarks and ranks top vendors, classifying them as Established Leaders, Leading Challengers, or Disruptors & Challengers.

Locates where complements amplify value and substitutes erode it, forecasting net impact by horizon

We deliver granular, decision-grade intel: market sizing, 5-year forecasts, pricing, adoption, usage, revenue, and operational KPIs—plus competitor tracking, regulation, and value chains—across 60 countries broadly.

Spot the shifts before they hit your P&L. We track inflection points, adoption curves, pricing moves, and ecosystem plays to show where demand is heading, why it is changing, and what to do next across high-growth markets and disruptive tech

Real-time reads of user behavior. We track shifting priorities, perceptions of today’s and next-gen services, and provider experience, then pace how fast tech moves from trial to adoption, blending buyer, consumer, and channel inputs with social signals (#WhySwitch, #UX).

Partner with our analyst team to build a custom report designed around your business priorities. From analysing market trends to assessing competitors or crafting bespoke datasets, we tailor insights to your needs.
Supplier Intelligence
Discovery & Profiling
Capacity & Footprint
Performance & Risk
Compliance & Governance
Commercial Readiness
Who Supplies Whom
Scorecards & Shortlists
Playbooks & Docs
Category Intelligence
Definition & Scope
Demand & Use Cases
Cost Drivers
Market Structure
Supply Chain Map
Trade & Policy
Operating Norms
Deliverables
Buyer Intelligence
Account Basics
Spend & Scope
Procurement Model
Vendor Requirements
Terms & Policies
Entry Strategy
Pain Points & Triggers
Outputs
Pricing Analysis
Benchmarks
Trends
Should-Cost
Indexation
Landed Cost
Commercial Terms
Deliverables
Brand Analysis
Positioning & Value Prop
Share & Presence
Customer Evidence
Go-to-Market
Digital & Reputation
Compliance & Trust
KPIs & Gaps
Outputs
Full Research Suite comprises of:
Market outlook & trends analysis
Interviews & case studies
Strategic recommendations
Vendor profiles & capabilities analysis
5-year forecasts
8 regions and 60+ country-level data splits
Market segment data splits
12 months of continuous data updates
DELIVERED AS:
PDF EXCEL ONLINE
Market Share Distribution Among Pallet Box Providers
Examining Market Share Trends in Foldable Plastic Pallet Boxes
Foldable Plastic Pallet Boxes Market Trends & Forecast through 2035
Demand for Foldable Plastic Pallet Boxes in USA Size and Share Forecast Outlook 2025 to 2035
Demand for Foldable Plastic Pallet Boxes in Japan Size and Share Forecast Outlook 2025 to 2035
Pallet Displays Market Size and Share Forecast Outlook 2025 to 2035
Palletizer Market Size and Share Forecast Outlook 2025 to 2035
Box Liners Market Size and Share Forecast Outlook 2025 to 2035
Pallet Wraps Market Size and Share Forecast Outlook 2025 to 2035
Pallet Pooling Market Forecast and Outlook 2025 to 2035
Palletizing Robot Industry Analysis in North America Size and Share Forecast Outlook 2025 to 2035
Palletizing Robots Market Size and Share Forecast Outlook 2025 to 2035
Pallet Stretch Wrapping Machine Market Size and Share Forecast Outlook 2025 to 2035
Pallet Labelling System Market Size and Share Forecast Outlook 2025 to 2035
Boxboard Packaging Market Analysis - Size, Share, and Forecast Outlook 2025 to 2035
Pallet Labeler Market Size and Share Forecast Outlook 2025 to 2035
Box Compression Tester Market Size and Share Forecast Outlook 2025 to 2035
Pallet Wrap Industry Analysis in Western Europe Size and Share Forecast Outlook 2025 to 2035
Pallet Jacks Market Size and Share Forecast Outlook 2025 to 2035
Pallet Drum Filler Capper Market Size and Share Forecast Outlook 2025 to 2035

Thank you!
You will receive an email from our Business Development Manager. Please be sure to check your SPAM/JUNK folder too.
Chat With
MaRIA