Reports

- Global Locations -

Headquarters

Future Market Insights, Inc.

Christiana Corporate, 200
Continental Drive, Suite 401,
Newark, Delaware - 19713,
United States

T: +1-845-579-5705

Americas

Future Market Insights, Inc.

616 Corporate Way, Suite 2-9018,
Valley Cottage, NY 10989, United States

T: +1-347-918-3531

MEA

Future Market Insights

1602-6 Jumeirah Bay X2 Tower, Plot No: JLT-PH2-X2A,
Jumeirah Lakes Towers, Dubai,
United Arab Emirates

Europe

Future Market Insights

3rd Floor, 207 Regent Street,
W1B 3HH London
United Kingdom

T: + 44 (0) 20 8123 9659
D: +44 (0) 20 3287 4268

Asia Pacific

Future Market Insights

IndiaLand Global Tech Park, Unit UG-1, Behind Grand HighStreet, Phase 1, Hinjawadi, MH, Pune – 411057, India

Calendered Polyvinyl Chloride Flexible Films Market Outlook (2023 to 2033)

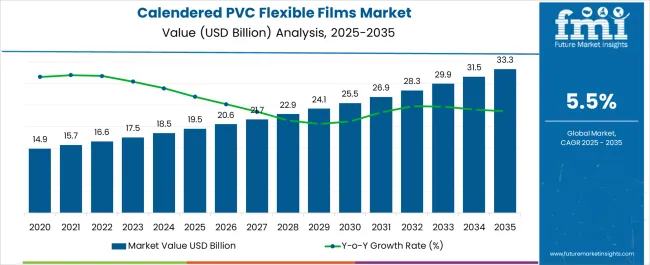
The calendered polyvinyl chloride flexible films market looks all set to hit a valuation of US$ 29,998.5 million in 2033. The market is expected to grow at a fair CAGR of 5.5% during the forecast period and is estimated at US$ 17,507.2 million as of 2023.

A rapid surge in the infrastructural activities worldwide coupled with immense increase in the growth of food packaging industry and many other factors are expected to drive the market of calendered polyvinyl chloride flexible films.

Attributes Value
Calendered Polyvinyl Chloride Flexible Films Market Size in 2023 US$ 17,507.2 million
Calendered Polyvinyl Chloride Flexible Films Projected Market Size (2033) US$ 29,998.5 million
Calendered Polyvinyl Chloride Flexible Films Market Anticipated CAGR (2023 to 2033) 5.5%

Polyvinyl is believed to be the third most widely produced synthetic plastic. These are known to possess excellent dimensional stability, which makes them versatile and cost-efficient. These are printable as well, which gives manufacturers the leeway to market the product at their convenience.

The calendered polyvinyl chloride flexible films are meant especially for their sturdiness and light weight. These are flexible as well. This might very well increase the demand for calendered polyvinyl chloride flexible films.

Owing to the packaging process, the calendered polyvinyl chloride flexible films exhibit a reasonable barrier towards oil and grease. These are puncture resistant. These films are resistant to all inorganic chemicals and can withstand extreme climatic conditions as well.

Don't pay for what you don't need

Customize your report by selecting specific countries or regions and save 30%!

Drivers for the Calendered Polyvinyl Chloride Flexible Films Market

Increased usage in construction activities

The calendered polyvinyl chloride flexible films are one of the most widely used products for building and construction. Owing to their quality and safety, the sales of calendered polyvinyl chloride flexible films are expected to surge during the forecast period.

Fire resistant

Safety becomes a very important parameter when dealing with products in large numbers. The calendered polyvinyl chloride flexible films offer high safety. The presence of chlorine ensures that the product does not ignite easily.

Cost-effective

Apart from the number of advantages offered by calendered polyvinyl chloride flexible films, these are cost-effective as well. The ability to be manipulated into desired shape and size is expected to increase the demand for calendered polyvinyl chloride flexible films.

Current resistant

One of the most important benefits of calendered polyvinyl chloride flexible films is that these do not conduct electricity. This allows manufacturers to provide a packing that is both fire and current-resistant

Tamper-resistant seals

The calendered polyvinyl chloride flexible films are used in large numbers for the manufacture of tamper-resistant seals. The usage of these seals displays the genuity of the product.

Eco friendly

The application of calendered polyvinyl chloride flexible films ensures that the product has no side effects on the environment, as tested by FDA, CPSC, and ISS. These factors might surge the sales of calendered polyvinyl chloride flexible films in the forecast period.

Rising demand in food packaging

These films are majorly used for packaging meat and many other kinds of fresh perishable food items.

Restraints Faced by the Calendered Polyvinyl Chloride Flexible Films Market Players

One of the major restraints of making use of calendered polyvinyl chloride flexible films is that if by any chance the packaging catches fire, it would emit gases that are harmful to our respiratory system. So, the demand for calendered polyvinyl chloride flexible films could be potentially impacted.

Sudip Saha
Sudip Saha

Principal Consultant

Talk to Analyst

Find your sweet spots for generating winning opportunities in this market.

Opportunities for Calendered Polyvinyl Chloride Flexible Films Market

Ban on plastic packaging

There are many countries that have banned the usage of plastics. This presents a sea of opportunity for these films, as these are potentially used as an alternative to plastics.

Importance being realized in healthcare sector

The healthcare sector is advancing at a massive rate worldwide. The importance of employing the calendered polyvinyl chloride flexible films is being gradually realized, as it represents a cost-effective way of maintenance.

All these are expected to surge the sales of calendered polyvinyl chloride flexible films.

Threats for Calendered Polyvinyl Chloride Flexible Films Market

Acceptance of Polystyrene as an alternative to plastic bags

Plastic bags are gradually being replaced with other suitable packaging types in many parts of the world. One of the products which is quite often used is polystyrene. This is a potential threat to the calendered polyvinyl chloride flexible films market.

Get the data you need at a Fraction of the cost

Personalize your report by choosing insights you need
and save 40%!

Demand Restraints Opportunities Threats (DROT) in a Nut Shell

Attributes Details
Demand
  • Increased usage in the construction activities
  • Fire resistant
  • Cost Effective
  • Current Resistant
  • Tamper resistant seals
  • Eco friendly
  • Rising demand in food packaging
Restraints
  • Emission of harmful gases while burning
Opportunities
  • Ban of plastic packaging
  • Importance being realized in healthcare sector
Threats
  • Acceptance of polystyrene as an alternative for plastic bags

To make things simpler, the Calendered Polyvinyl Chloride Flexible Films Market is a perfect combination of 4 P’s:

  • Product: Owing to the multiple benefits it offers
  • Price: Being cost efficient
  • Place: Importance being realized across sectors
  • Promotion: Stakeholders in the business of conveying the importance of using the product.

Looking at the prospects of adopting the Calendered Polyvinyl Chloride Flexible Films, the promoters are taking all efforts from their side to increase the sales of such packaging. The promotion activity is carried out mainly via offline mode through collaborations, trade shows, etc. This is well expected to increase the demand for calendered polyvinyl chloride flexible films.

Existing Trends in the Calendered Polyvinyl Chloride Flexible Films Market

Currently, there is a rising influx of rural populations to urban areas. These are the people, who in the initial days have to face a shortage of food because of the lack of resources. To save money, they consume street food or readily available food. The calendered polyvinyl chloride flexible films are used for packaging such food items as it increases the shelf life of the food and covers the odor of the packed food. The above reason is valid for those people as well who are leading a hectic lifestyle, because of lack of time to prepare food on their own.

Segment Wise Outlook

Which End-User category has the Highest Market Share in the Calendered Polyvinyl Chloride Flexible Films Market?

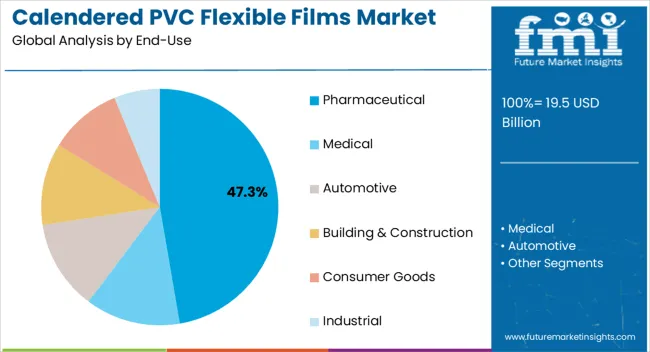
The consumer goods segment currently has the highest market share in the calendered polyvinyl chloride flexible films market. As of 2022, the market share of the consumer segments is slightly greater than 25%, and during the forecast period, the demand for calendered polyvinyl chloride flexible films is expected to surge.

There is rising usage of these films in the pharmaceutical sector for packing various kinds of medical equipment. The calendered polyvinyl chloride flexible films have high relevance in the automotive sector as well. These are used on the body of the car to avoid wear and tear. This is done to further see that the painting is not damaged in any way. If we talk about one segment in which its usage is exponentially increasing, it is the building and construction segment for the purpose of wallcovering, flooring, etc.

Any product that is used in industries should be durable, operationally and environmentally safe, cost-effective, multi-purposeful, etc. All these qualities are possessed by the calendered polyvinyl chloride flexible films. This is further expected to increase the sales of calendered polyvinyl chloride flexible films. The calendered polyvinyl chloride flexible films are used in a number of other applications like waterproof enclosures, windows, and siding, furniture and supply covers, wire harnesses, etc.

Region-wise Outlook

What is the Outlook of the Asia-Pacific Calendered Polyvinyl Chloride Flexible Films Market?

Asia Pacific is currently the largest market for calendered polyvinyl chloride flexible films, having a share of nearly 28%. Rapid development, coupled with increasing urbanization, and more and more people leading a hectic lifestyle are some of the reasons why the market is currently dominating and is expected to grow during the forecast period as well. The product being cost-effective will most likely drive the sales of calendered polyvinyl chloride flexible films during the forecast period.

What is the Outlook of the North American Calendered Polyvinyl Chloride Flexible Films Market?

The calendered polyvinyl chloride flexible films market is expected to expand in North America during the forecast period. The reason is the increased usage of these films in the medical and healthcare sector. These are used for packaging certain healthcare equipment. These films are used in the pharmaceutical sector as well for blister packaging.

There are a number of industries that operate in this region. Owing to plenty of benefits offered by these films, these are being adopted in industries as well. All these are expected to increase the calendered polyvinyl chloride flexible films market share in North America. North America held a market share of 30.4% in 2022.

What is the Outlook of the European Calendered Polyvinyl Chloride Flexible Films Market?

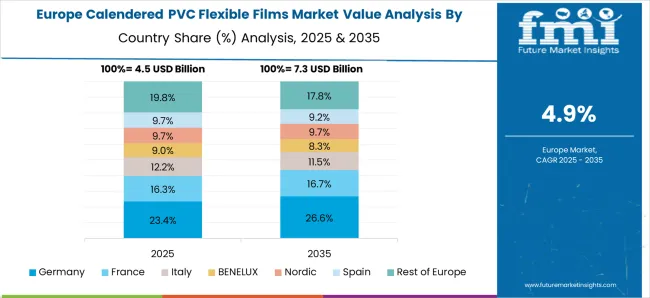
The calendered polyvinyl chloride flexible films market is anticipated to surge in Europe during the forecast period. Apart from the rising usage in all the sectors, there are plenty of funds available with the manufacturers in this region, because of which they can afford to promote the product.

The eco-friendly aspect of these films coupled with the capability to be fire resistant is expected to drive the demand for calendered polyvinyl chloride flexible films in Europe. Europe held a market share of 24.4% in 2022.

China is the Next Big Calendered Polyvinyl Chloride Flexible Films Market

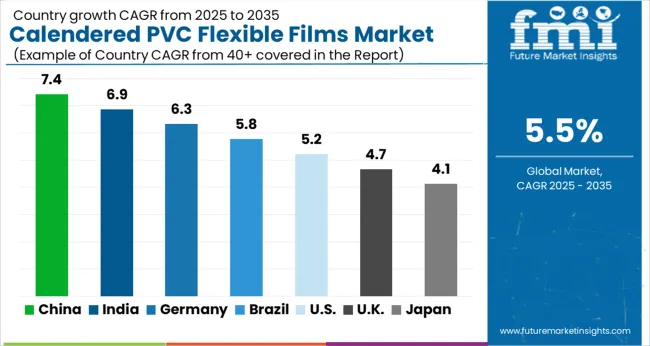
Based on the analysis conducted by Future Market Insights, it was found that as per the analysis done on countries, China is the biggest market for calendered polyvinyl chloride flexible films. The reasons are listed below:

  • Demand for tons of frozen food.
  • With the outbound increase in construction activities, especially in Eastern China.
  • The presence of large local manufacturers in the region ensures that demand remains proportionate to supply.
  • Rapidly increasing usage of these films in the medical industry, for the storage of IV fluids, and blood products.
  • Active participation by the ruling authority to promote the growth of local healthcare services is also expected to drive the market of calendered polyvinyl chloride flexible films. All these are expected to increase the sales of calendered polyvinyl chloride flexible films.
  • The China market is anticipated to grow at a CAGR of 4.4%.

Comparative Analysis of the Adjacent Markets

Calendered Polyvinyl Chloride Flexible Films Market:

Differentiating Aspects Calendered Polyvinyl Chloride Flexible Films Market
CAGR (2023 to 2033) 5.5%
Market Valuation in 2023 US$ 17,507.2 million
Projected Market Value in 2033 US$ 29,998.5 million
Growth Factors A rapid surge in the infrastructural activities worldwide coupled with immense increase in the growth of food packaging industry and many other factors are expected to drive the market of calendered polyvinyl chloride flexible films.
Opportunities Ban of plastic packaging and Importance being realized in healthcare sector.
Key Trends The calendered polyvinyl chloride flexible films are used for packaging such food items.

Polyvinylidene Fluoride (PVDF) Market:

Differentiating Aspects Polyvinylidene Fluoride (PVDF) Market
CAGR (2023 to 2033) 9.5%
Market Valuation in 2023 US$ 1,120 million
Projected Market Value in 2033 US$ 2,775.6 million
Growth Factors Polyvinylidene fluoride's expanding uses are expected to enhance its demand across a variety of industries, as well as increase the worldwide PVDF market's revenues.
Opportunities The PVDF sector in Western Europe is also likely to increase significantly, with certain PVDF growth initiatives expected to bring up new market prospects for the region's entire industry.
Key Trends Consumption is high from a variety of end-user sectors, including coatings, photovoltaic films, oil and gas, and electrical.

Polyvinyl Chloride Market:

Differentiating Aspects Polyvinyl Chloride Market
CAGR (2023 to 2033) 4.5%
Market Valuation in 2023 US$ 66 billion
Projected Market Value in 2033 US$ 102.5 billion
Growth Factors The global polyvinyl chloride (PVC) market is expanding owing to increased demand in the packaging, automobiles and construction sectors.
Opportunities Streamlining infrastructure initiatives in nations that are developing are expanding the demand for polyvinyl chloride (PVC).
Key Trends PVC pipes will maintain their dominance in industrial plumbing systems until 2033.

Calendered Polyvinyl Chloride Flexible Films Market Start-Up Ecosystem

The start-up space of calendered polyvinyl chloride flexible films market is on a rollout for providing high-efficiency and low-cost packaging. Some of the startups are: vertrauen chemie solutions, Indevco Plastics, and Bizongo.

Start-up name Vertrauen Chemie Solutions
Start-up year 2016
Description Develops packaging for liquids which are difficult to handle. Offers solutions to aerospace, automotive, construction, marine, and oil and gas.
Start-up name Indevco Plastics
Start-up year 2015
Description Uses post-consumer, post-industrial, and virgin resins for polyethylene centerfold sheeting.
Start-up name Bizongo
Start-up year 2015
Description Develops packaging for food and beverage businesses, which protects products across life cycle.

Some of the other start-ups are Plexform and Interface polymers, and these primarily deal with industrial bulk packaging and packaging based on polyolefin.
Competitive Landscape in the Calendered Polyvinyl Chloride Flexible Films Market

With a view to expand footprints, and to serve many other sectors, the key players are currently involved in mergers and acquisitions. The expansion of portfolio would ensure that the specialty compounds are included as well, apart from the existing PVC materials.

Company Teknor Apex
Month and Year June 2022
News Teknor Apex announced NEW Sarlink R2 3180 B TPV with 25% recycled content. This multipurpose TPV contains high quality Post-Industrial Recycled content processes.
Company Hexis SAS
Month and Year June 2022
News Hexis visted La Fabrique in Paris, which is a French school for decoration and fashion industry. The students created a window display with Hexis products, in line with the 2022 decoration trend
Company Renolit SE
Month and Year May 2022
News Renolit SE and Sobernheimer Rohstoff Kontor Gmbh have founded a joint venture, KAS Kunststoff Aufbereitung Bad Sobernheim GmbH to jointly distribute PVC recyclates derived from production residues.
Company Lawson Screen and Digital Products
Month and Year September 2022
News FDC series 4200 Intermediate Ultra High Gloss Vinyl Film, introduced by Lawson Screen and Digital Products, is an ultra high gloss calendered vinyl film. This item is ideal for exterior and interior uses that require a high grade markings film for adaptability, resilience, and sunlight protection.
Company Ronal DGA
Month and Year August 2022
News Gloss Calendered Vinyl PRO (ESM-GCPRO), introduced by Ronal DGA, is the most recent innovation to their calendered vinyl portfolio. This high-end item is a glossy 3 mm calendered vinyl with grey detachable adhesive and an air-release lining.

Scope of Report

Report Attribute Details
Growth Rate CAGR of 5.5% from 2023 to 2033
Base Year for Estimation 2022
Historical Data 2018 to 2022
Forecast Period 2023 to 2033
Quantitative Units Revenue in US$ million and CAGR from 2023 to 2033
Report Coverage Revenue Forecast, Volume Forecast, Company Ranking, Competitive Landscape, Growth Factors, Trends, and Pricing Analysis
Segments Covered
  • End Use
  • Region
Regions Covered
  • North America
  • Latin America
  • Europe
  • Asia Pacific
  • Middle East & Africa
Key Countries Profiled
  • United States
  • Canada
  • Brazil
  • Mexico
  • Germany
  • United Kingdom
  • France
  • Spain
  • Italy
  • Russia
  • India
  • Australia
  • China
  • Japan
  • South Korea
  • Saudi Arabia
  • UAE
  • South Africa
  • Israel
Key Companies Profiled
  • Mississippi Polymers, Inc.
  • Teknor Apex Company, Inc.
  • Canadian Speciality Vinyls
  • South Asia Plastics Group
  • ACG
  • Caprihans India Limited
  • Mondorevive S.p.a.
  • ALFATHERM SpA
  • HEXIS S.A.S.
  • ZHONGSHAN LIN-YANG PLASTIC CO.LTD.
  • Merck KGaA
Customization & Pricing Available Upon Request

Market Segmentation

By End-Use:

  • Pharmaceutical
  • Medical
  • Automotive
  • Building & Construction
  • Consumer Goods
  • Industrial

By Region:

  • North America
  • Latin America
  • Europe
  • Asia Pacific
  • Middle East & Africa

Frequently Asked Questions

What is the Calendered Polyvinyl Chloride Flexible Films Market CAGR for 2033?

The calendered polyvinyl chloride flexible films market CAGR for 2033 is 5.5%.

How Big Will the Calendered Polyvinyl Chloride Flexible Films Market by 2033?

The market is estimated to reach US$ 29,998.5 million by 2033.

How Key Players are Developing the Calendered Polyvinyl Chloride Flexible Films Market?

Key calendered polyvinyl chloride flexible films market players are increasing their production capacities.

What is the Current Calendered Polyvinyl Chloride Flexible Films Market Valuation?

The market is estimated to secure a valuation of US$ 17,507.2 million in 2023.

Who are the Three Key Players in the Calendered Polyvinyl Chloride Flexible Films Market?

The key market players are Mississippi Polymers, Teknor Apex Company, and Canadian Speciality Vinyls.

Table of Content

1. Executive Summary

    1.1. Global Market Outlook

    1.2. Demand-side Trends

    1.3. Supply-side Trends

    1.4. Technology Roadmap Analysis

    1.5. Analysis and Recommendations

2. Market Overview

    2.1. Market Coverage / Taxonomy

    2.2. Market Definition / Scope / Limitations

3. Market Background

    3.1. Market Dynamics

        3.1.1. Drivers

        3.1.2. Restraints

        3.1.3. Opportunity

        3.1.4. Trends

    3.2. Scenario Forecast

        3.2.1. Demand in Optimistic Scenario

        3.2.2. Demand in Likely Scenario

        3.2.3. Demand in Conservative Scenario

    3.3. Opportunity Map Analysis

    3.4. Product Life Cycle Analysis

    3.5. Supply Chain Analysis

        3.5.1. Supply Side Participants and their Roles

            3.5.1.1. Producers

            3.5.1.2. Mid-Level Participants (Traders/ Agents/ Brokers)

            3.5.1.3. Wholesalers and Distributors

        3.5.2. Value Added and Value Created at Node in the Supply Chain

        3.5.3. List of Raw Material Suppliers

        3.5.4. List of Existing and Potential Buyers

    3.6. Investment Feasibility Matrix

    3.7. Value Chain Analysis

        3.7.1. Profit Margin Analysis

        3.7.2. Wholesalers and Distributors

        3.7.3. Retailers

    3.8. PESTLE and Porter’s Analysis

    3.9. Regulatory Landscape

        3.9.1. By Key Regions

        3.9.2. By Key Countries

    3.10. Regional Parent Market Outlook

    3.11. Production and Consumption Statistics

    3.12. Import and Export Statistics

4. Global Market Analysis 2018 to 2022 and Forecast, 2023 to 2033

    4.1. Historical Market Size Value (US$ Billion) & Volume (Tons) Analysis, 2018 to 2022

    4.2. Current and Future Market Size Value (US$ Billion) & Volume (Tons) Projections, 2023 to 2033

        4.2.1. Y-o-Y Growth Trend Analysis

        4.2.2. Absolute $ Opportunity Analysis

5. Global Market Analysis 2018 to 2022 and Forecast 2023 to 2033, By End-Use

    5.1. Introduction / Key Findings

    5.2. Historical Market Size Value (US$ Billion) & Volume (Tons) Analysis By End-Use, 2018 to 2022

    5.3. Current and Future Market Size Value (US$ Billion) & Volume (Tons) Analysis and Forecast By End-Use, 2023 to 2033

        5.3.1. Pharmaceutical

        5.3.2. Medical

        5.3.3. Automotive

        5.3.4. Building & Construction

        5.3.5. Consumer Goods

        5.3.6. Industrial

    5.4. Y-o-Y Growth Trend Analysis By End-Use, 2018 to 2022

    5.5. Absolute $ Opportunity Analysis By End-Use, 2023 to 2033

6. Global Market Analysis 2018 to 2022 and Forecast 2023 to 2033, By Region

    6.1. Introduction

    6.2. Historical Market Size Value (US$ Billion) & Volume (Tons) Analysis By Region, 2018 to 2022

    6.3. Current Market Size Value (US$ Billion) & Volume (Tons) Analysis and Forecast By Region, 2023 to 2033

        6.3.1. North America

        6.3.2. Latin America

        6.3.3. Europe

        6.3.4. Asia Pacific

        6.3.5. MEA

    6.4. Market Attractiveness Analysis By Region

7. North America Market Analysis 2018 to 2022 and Forecast 2023 to 2033, By Country

    7.1. Historical Market Size Value (US$ Billion) & Volume (Tons) Trend Analysis By Market Taxonomy, 2018 to 2022

    7.2. Market Size Value (US$ Billion) & Volume (Tons) Forecast By Market Taxonomy, 2023 to 2033

        7.2.1. By Country

            7.2.1.1. USA

            7.2.1.2. Canada

        7.2.2. By End-Use

    7.3. Market Attractiveness Analysis

        7.3.1. By Country

        7.3.2. By End-Use

    7.4. Key Takeaways

8. Latin America Market Analysis 2018 to 2022 and Forecast 2023 to 2033, By Country

    8.1. Historical Market Size Value (US$ Billion) & Volume (Tons) Trend Analysis By Market Taxonomy, 2018 to 2022

    8.2. Market Size Value (US$ Billion) & Volume (Tons) Forecast By Market Taxonomy, 2023 to 2033

        8.2.1. By Country

            8.2.1.1. Brazil

            8.2.1.2. Mexico

            8.2.1.3. Rest of Latin America

        8.2.2. By End-Use

    8.3. Market Attractiveness Analysis

        8.3.1. By Country

        8.3.2. By End-Use

    8.4. Key Takeaways

9. Europe Market Analysis 2018 to 2022 and Forecast 2023 to 2033, By Country

    9.1. Historical Market Size Value (US$ Billion) & Volume (Tons) Trend Analysis By Market Taxonomy, 2018 to 2022

    9.2. Market Size Value (US$ Billion) & Volume (Tons) Forecast By Market Taxonomy, 2023 to 2033

        9.2.1. By Country

            9.2.1.1. Germany

            9.2.1.2. UK

            9.2.1.3. France

            9.2.1.4. Spain

            9.2.1.5. Italy

            9.2.1.6. Russia

            9.2.1.7. Rest of Europe

        9.2.2. By End-Use

    9.3. Market Attractiveness Analysis

        9.3.1. By Country

        9.3.2. By End-Use

    9.4. Key Takeaways

10. Asia Pacific Market Analysis 2018 to 2022 and Forecast 2023 to 2033, By Country

    10.1. Historical Market Size Value (US$ Billion) & Volume (Tons) Trend Analysis By Market Taxonomy, 2018 to 2022

    10.2. Market Size Value (US$ Billion) & Volume (Tons) Forecast By Market Taxonomy, 2023 to 2033

        10.2.1. By Country

            10.2.1.1. China

            10.2.1.2. Japan

            10.2.1.3. India

            10.2.1.4. South Korea

            10.2.1.5. Australia

            10.2.1.6. Rest of APAC

        10.2.2. By End-Use

    10.3. Market Attractiveness Analysis

        10.3.1. By Country

        10.3.2. By End-Use

    10.4. Key Takeaways

11. MEA Market Analysis 2018 to 2022 and Forecast 2023 to 2033, By Country

    11.1. Historical Market Size Value (US$ Billion) & Volume (Tons) Trend Analysis By Market Taxonomy, 2018 to 2022

    11.2. Market Size Value (US$ Billion) & Volume (Tons) Forecast By Market Taxonomy, 2023 to 2033

        11.2.1. By Country

            11.2.1.1. South Africa

            11.2.1.2. Saudi Arabia

            11.2.1.3. UAE

            11.2.1.4. Israel

            11.2.1.5. Rest of MEA

        11.2.2. By End-Use

    11.3. Market Attractiveness Analysis

        11.3.1. By Country

        11.3.2. By End-Use

    11.4. Key Takeaways

12. Key Countries Market Analysis

    12.1. Value (US$ Billion) & Volume (Tons)ed States

        12.1.1. Pricing Analysis

        12.1.2. Market Share Analysis, 2022

            12.1.2.1. By End-Use

    12.2. Canada

        12.2.1. Pricing Analysis

        12.2.2. Market Share Analysis, 2022

            12.2.2.1. By End-Use

    12.3. Brazil

        12.3.1. Pricing Analysis

        12.3.2. Market Share Analysis, 2022

            12.3.2.1. By End-Use

    12.4. Mexico

        12.4.1. Pricing Analysis

        12.4.2. Market Share Analysis, 2022

            12.4.2.1. By End-Use

    12.5. Germany

        12.5.1. Pricing Analysis

        12.5.2. Market Share Analysis, 2022

            12.5.2.1. By End-Use

    12.6. UK

        12.6.1. Pricing Analysis

        12.6.2. Market Share Analysis, 2022

            12.6.2.1. By End-Use

    12.7. France

        12.7.1. Pricing Analysis

        12.7.2. Market Share Analysis, 2022

            12.7.2.1. By End-Use

    12.8. Spain

        12.8.1. Pricing Analysis

        12.8.2. Market Share Analysis, 2022

            12.8.2.1. By End-Use

    12.9. Italy

        12.9.1. Pricing Analysis

        12.9.2. Market Share Analysis, 2022

            12.9.2.1. By End-Use

    12.10. Russia

        12.10.1. Pricing Analysis

        12.10.2. Market Share Analysis, 2022

            12.10.2.1. By End-Use

    12.11. China

        12.11.1. Pricing Analysis

        12.11.2. Market Share Analysis, 2022

            12.11.2.1. By End-Use

    12.12. Japan

        12.12.1. Pricing Analysis

        12.12.2. Market Share Analysis, 2022

            12.12.2.1. By End-Use

    12.13. India

        12.13.1. Pricing Analysis

        12.13.2. Market Share Analysis, 2022

            12.13.2.1. By End-Use

    12.14. South Korea

        12.14.1. Pricing Analysis

        12.14.2. Market Share Analysis, 2022

            12.14.2.1. By End-Use

    12.15. Australia

        12.15.1. Pricing Analysis

        12.15.2. Market Share Analysis, 2022

            12.15.2.1. By End-Use

    12.16. South Africa

        12.16.1. Pricing Analysis

        12.16.2. Market Share Analysis, 2022

            12.16.2.1. By End-Use

    12.17. Saudi Arabia

        12.17.1. Pricing Analysis

        12.17.2. Market Share Analysis, 2022

            12.17.2.1. By End-Use

    12.18. UAE

        12.18.1. Pricing Analysis

        12.18.2. Market Share Analysis, 2022

            12.18.2.1. By End-Use

    12.19. Israel

        12.19.1. Pricing Analysis

        12.19.2. Market Share Analysis, 2022

            12.19.2.1. By End-Use

13. Market Structure Analysis

    13.1. Competition Dashboard

    13.2. Competition Benchmarking

    13.3. Market Share Analysis of Top Players

        13.3.1. By Regional

        13.3.2. By End-Use

14. Competition Analysis

    14.1. Mississippi Polymers, Inc.

        14.1.1. Merck KGaA

            14.1.1.1. Overview

            14.1.1.2. Product Portfolio

            14.1.1.3. Profitability by Market Segments

            14.1.1.4. Sales Footprint

            14.1.1.5. Strategy Overview

                14.1.1.5.1. Marketing Strategy

                14.1.1.5.2. Product Strategy

                14.1.1.5.3. Channel Strategy

        14.1.2. Teknor Apex Company, Inc.

            14.1.2.1. Overview

            14.1.2.2. Product Portfolio

            14.1.2.3. Profitability by Market Segments

            14.1.2.4. Sales Footprint

            14.1.2.5. Strategy Overview

                14.1.2.5.1. Marketing Strategy

                14.1.2.5.2. Product Strategy

                14.1.2.5.3. Channel Strategy

        14.1.3. Canadian Speciality Vinyls

            14.1.3.1. Overview

            14.1.3.2. Product Portfolio

            14.1.3.3. Profitability by Market Segments

            14.1.3.4. Sales Footprint

            14.1.3.5. Strategy Overview

                14.1.3.5.1. Marketing Strategy

                14.1.3.5.2. Product Strategy

                14.1.3.5.3. Channel Strategy

        14.1.4. South Asia Plastics Group

            14.1.4.1. Overview

            14.1.4.2. Product Portfolio

            14.1.4.3. Profitability by Market Segments

            14.1.4.4. Sales Footprint

            14.1.4.5. Strategy Overview

                14.1.4.5.1. Marketing Strategy

                14.1.4.5.2. Product Strategy

                14.1.4.5.3. Channel Strategy

        14.1.5. ACG

            14.1.5.1. Overview

            14.1.5.2. Product Portfolio

            14.1.5.3. Profitability by Market Segments

            14.1.5.4. Sales Footprint

            14.1.5.5. Strategy Overview

                14.1.5.5.1. Marketing Strategy

                14.1.5.5.2. Product Strategy

                14.1.5.5.3. Channel Strategy

        14.1.6. Caprihans India Limited

            14.1.6.1. Overview

            14.1.6.2. Product Portfolio

            14.1.6.3. Profitability by Market Segments

            14.1.6.4. Sales Footprint

            14.1.6.5. Strategy Overview

                14.1.6.5.1. Marketing Strategy

                14.1.6.5.2. Product Strategy

                14.1.6.5.3. Channel Strategy

        14.1.7. Mondorevive S.p.a.

            14.1.7.1. Overview

            14.1.7.2. Product Portfolio

            14.1.7.3. Profitability by Market Segments

            14.1.7.4. Sales Footprint

            14.1.7.5. Strategy Overview

                14.1.7.5.1. Marketing Strategy

                14.1.7.5.2. Product Strategy

                14.1.7.5.3. Channel Strategy

        14.1.8. ALFATHERM SpA

            14.1.8.1. Overview

            14.1.8.2. Product Portfolio

            14.1.8.3. Profitability by Market Segments

            14.1.8.4. Sales Footprint

            14.1.8.5. Strategy Overview

                14.1.8.5.1. Marketing Strategy

                14.1.8.5.2. Product Strategy

                14.1.8.5.3. Channel Strategy

        14.1.9. HEXIS S.A.S.

            14.1.9.1. Overview

            14.1.9.2. Product Portfolio

            14.1.9.3. Profitability by Market Segments

            14.1.9.4. Sales Footprint

            14.1.9.5. Strategy Overview

                14.1.9.5.1. Marketing Strategy

                14.1.9.5.2. Product Strategy

                14.1.9.5.3. Channel Strategy

        14.1.10. ZHONGSHAN LIN-YANG PLASTIC CO.LTD.

            14.1.10.1. Overview

            14.1.10.2. Product Portfolio

            14.1.10.3. Profitability by Market Segments

            14.1.10.4. Sales Footprint

            14.1.10.5. Strategy Overview

                14.1.10.5.1. Marketing Strategy

                14.1.10.5.2. Product Strategy

                14.1.10.5.3. Channel Strategy

15. Assumptions & Acronyms Used

16. Research Methodology

List of Tables

Table 1: Global Market Value (US$ Billion) Forecast by Region, 2018 to 2033

Table 2: Global Market Volume (Tons) Forecast by Region, 2018 to 2033

Table 3: Global Market Value (US$ Billion) Forecast by End-Use, 2018 to 2033

Table 4: Global Market Volume (Tons) Forecast by End-Use, 2018 to 2033

Table 5: North America Market Value (US$ Billion) Forecast by Country, 2018 to 2033

Table 6: North America Market Volume (Tons) Forecast by Country, 2018 to 2033

Table 7: North America Market Value (US$ Billion) Forecast by End-Use, 2018 to 2033

Table 8: North America Market Volume (Tons) Forecast by End-Use, 2018 to 2033

Table 9: Latin America Market Value (US$ Billion) Forecast by Country, 2018 to 2033

Table 10: Latin America Market Volume (Tons) Forecast by Country, 2018 to 2033

Table 11: Latin America Market Value (US$ Billion) Forecast by End-Use, 2018 to 2033

Table 12: Latin America Market Volume (Tons) Forecast by End-Use, 2018 to 2033

Table 13: Europe Market Value (US$ Billion) Forecast by Country, 2018 to 2033

Table 14: Europe Market Volume (Tons) Forecast by Country, 2018 to 2033

Table 15: Europe Market Value (US$ Billion) Forecast by End-Use, 2018 to 2033

Table 16: Europe Market Volume (Tons) Forecast by End-Use, 2018 to 2033

Table 17: Asia Pacific Market Value (US$ Billion) Forecast by Country, 2018 to 2033

Table 18: Asia Pacific Market Volume (Tons) Forecast by Country, 2018 to 2033

Table 19: Asia Pacific Market Value (US$ Billion) Forecast by End-Use, 2018 to 2033

Table 20: Asia Pacific Market Volume (Tons) Forecast by End-Use, 2018 to 2033

Table 21: MEA Market Value (US$ Billion) Forecast by Country, 2018 to 2033

Table 22: MEA Market Volume (Tons) Forecast by Country, 2018 to 2033

Table 23: MEA Market Value (US$ Billion) Forecast by End-Use, 2018 to 2033

Table 24: MEA Market Volume (Tons) Forecast by End-Use, 2018 to 2033

List of Charts

Figure 1: Global Market Value (US$ Billion) by End-Use, 2023 to 2033

Figure 2: Global Market Value (US$ Billion) by Region, 2023 to 2033

Figure 3: Global Market Value (US$ Billion) Analysis by Region, 2018 to 2033

Figure 4: Global Market Volume (Tons) Analysis by Region, 2018 to 2033

Figure 5: Global Market Value Share (%) and BPS Analysis by Region, 2023 to 2033

Figure 6: Global Market Y-o-Y Growth (%) Projections by Region, 2023 to 2033

Figure 7: Global Market Value (US$ Billion) Analysis by End-Use, 2018 to 2033

Figure 8: Global Market Volume (Tons) Analysis by End-Use, 2018 to 2033

Figure 9: Global Market Value Share (%) and BPS Analysis by End-Use, 2023 to 2033

Figure 10: Global Market Y-o-Y Growth (%) Projections by End-Use, 2023 to 2033

Figure 11: Global Market Attractiveness by End-Use, 2023 to 2033

Figure 12: Global Market Attractiveness by Region, 2023 to 2033

Figure 13: North America Market Value (US$ Billion) by End-Use, 2023 to 2033

Figure 14: North America Market Value (US$ Billion) by Country, 2023 to 2033

Figure 15: North America Market Value (US$ Billion) Analysis by Country, 2018 to 2033

Figure 16: North America Market Volume (Tons) Analysis by Country, 2018 to 2033

Figure 17: North America Market Value Share (%) and BPS Analysis by Country, 2023 to 2033

Figure 18: North America Market Y-o-Y Growth (%) Projections by Country, 2023 to 2033

Figure 19: North America Market Value (US$ Billion) Analysis by End-Use, 2018 to 2033

Figure 20: North America Market Volume (Tons) Analysis by End-Use, 2018 to 2033

Figure 21: North America Market Value Share (%) and BPS Analysis by End-Use, 2023 to 2033

Figure 22: North America Market Y-o-Y Growth (%) Projections by End-Use, 2023 to 2033

Figure 23: North America Market Attractiveness by End-Use, 2023 to 2033

Figure 24: North America Market Attractiveness by Country, 2023 to 2033

Figure 25: Latin America Market Value (US$ Billion) by End-Use, 2023 to 2033

Figure 26: Latin America Market Value (US$ Billion) by Country, 2023 to 2033

Figure 27: Latin America Market Value (US$ Billion) Analysis by Country, 2018 to 2033

Figure 28: Latin America Market Volume (Tons) Analysis by Country, 2018 to 2033

Figure 29: Latin America Market Value Share (%) and BPS Analysis by Country, 2023 to 2033

Figure 30: Latin America Market Y-o-Y Growth (%) Projections by Country, 2023 to 2033

Figure 31: Latin America Market Value (US$ Billion) Analysis by End-Use, 2018 to 2033

Figure 32: Latin America Market Volume (Tons) Analysis by End-Use, 2018 to 2033

Figure 33: Latin America Market Value Share (%) and BPS Analysis by End-Use, 2023 to 2033

Figure 34: Latin America Market Y-o-Y Growth (%) Projections by End-Use, 2023 to 2033

Figure 35: Latin America Market Attractiveness by End-Use, 2023 to 2033

Figure 36: Latin America Market Attractiveness by Country, 2023 to 2033

Figure 37: Europe Market Value (US$ Billion) by End-Use, 2023 to 2033

Figure 38: Europe Market Value (US$ Billion) by Country, 2023 to 2033

Figure 39: Europe Market Value (US$ Billion) Analysis by Country, 2018 to 2033

Figure 40: Europe Market Volume (Tons) Analysis by Country, 2018 to 2033

Figure 41: Europe Market Value Share (%) and BPS Analysis by Country, 2023 to 2033

Figure 42: Europe Market Y-o-Y Growth (%) Projections by Country, 2023 to 2033

Figure 43: Europe Market Value (US$ Billion) Analysis by End-Use, 2018 to 2033

Figure 44: Europe Market Volume (Tons) Analysis by End-Use, 2018 to 2033

Figure 45: Europe Market Value Share (%) and BPS Analysis by End-Use, 2023 to 2033

Figure 46: Europe Market Y-o-Y Growth (%) Projections by End-Use, 2023 to 2033

Figure 47: Europe Market Attractiveness by End-Use, 2023 to 2033

Figure 48: Europe Market Attractiveness by Country, 2023 to 2033

Figure 49: Asia Pacific Market Value (US$ Billion) by End-Use, 2023 to 2033

Figure 50: Asia Pacific Market Value (US$ Billion) by Country, 2023 to 2033

Figure 51: Asia Pacific Market Value (US$ Billion) Analysis by Country, 2018 to 2033

Figure 52: Asia Pacific Market Volume (Tons) Analysis by Country, 2018 to 2033

Figure 53: Asia Pacific Market Value Share (%) and BPS Analysis by Country, 2023 to 2033

Figure 54: Asia Pacific Market Y-o-Y Growth (%) Projections by Country, 2023 to 2033

Figure 55: Asia Pacific Market Value (US$ Billion) Analysis by End-Use, 2018 to 2033

Figure 56: Asia Pacific Market Volume (Tons) Analysis by End-Use, 2018 to 2033

Figure 57: Asia Pacific Market Value Share (%) and BPS Analysis by End-Use, 2023 to 2033

Figure 58: Asia Pacific Market Y-o-Y Growth (%) Projections by End-Use, 2023 to 2033

Figure 59: Asia Pacific Market Attractiveness by End-Use, 2023 to 2033

Figure 60: Asia Pacific Market Attractiveness by Country, 2023 to 2033

Figure 61: MEA Market Value (US$ Billion) by End-Use, 2023 to 2033

Figure 62: MEA Market Value (US$ Billion) by Country, 2023 to 2033

Figure 63: MEA Market Value (US$ Billion) Analysis by Country, 2018 to 2033

Figure 64: MEA Market Volume (Tons) Analysis by Country, 2018 to 2033

Figure 65: MEA Market Value Share (%) and BPS Analysis by Country, 2023 to 2033

Figure 66: MEA Market Y-o-Y Growth (%) Projections by Country, 2023 to 2033

Figure 67: MEA Market Value (US$ Billion) Analysis by End-Use, 2018 to 2033

Figure 68: MEA Market Volume (Tons) Analysis by End-Use, 2018 to 2033

Figure 69: MEA Market Value Share (%) and BPS Analysis by End-Use, 2023 to 2033

Figure 70: MEA Market Y-o-Y Growth (%) Projections by End-Use, 2023 to 2033

Figure 71: MEA Market Attractiveness by End-Use, 2023 to 2033

Figure 72: MEA Market Attractiveness by Country, 2023 to 2033

Recommendations

Packaging

MDO-PE Film Market

Published : February 2024

Technology

Calendered Polyvinyl Chloride Flexible Films Market

Published : June 2023

Chemicals & Materials

Functional Films Market

Published : March 2023

Technology

Flexible Barrier Films for Electronics Market

Published : November 2022

Explore Technology Insights

View Reports

Calendered Polyvinyl Chloride Flexible Films Market