Thermocol Box Market Size, Share, and Forecast Outlook 2025 to 2035

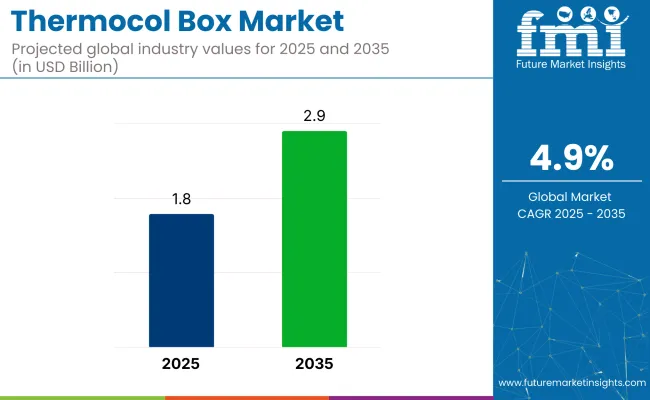
The thermocol box market is expected to expand from USD 1.8 billion in 2025 to USD 2.9 billion by 2035, registering a 4.9% CAGR. Thermocol packaging boxes market account for approximately 25-30% of the Thermocol (EPS) packaging market, due to their widespread use in insulating and protecting temperature-sensitive goods.
Quick Stats of Thermocol Box Market

  • Market Value (2025): USD 1.8 billion
  • Forecast Value (2035): USD 2.9 billion
  • Forecast CAGR: 4.9%
  • Material Leader in 2025: Expanded Polystyrene (EPS) (62% industry share)
  • Top End-Use Industry: Food & Beverages (40% industry share)
  • Key Growth Region: India (4.7% CAGR)
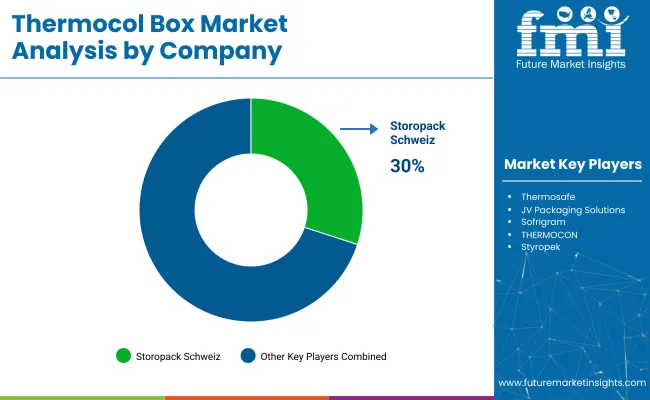
  • Leading player: StoropackSchweiz (27-30% industry share)

Thermocol Box Market

Key Industry Attributes

Attribute Detail
Industry Size (2025) USD 1.8 billion
Industry Size (2035) USD 2.9 billion
CAGR (2025 to 2035) 4.9%

Within the broader protective and insulative packaging sector, they contribute roughly 8-10%, driven by applications in cold chain logistics, electronics, and vaccines. In the e-commerce packaging segment, their share stands at 5-7%, supported by increasing frozen food and medicine deliveries.

Across industrial packaging and logistics, thermocol boxes hold 6-9%, particularly in seafood exports and pharmaceutical transport. In Asia-Pacific’s packaging segment, especially in India and China, their contribution exceeds 30%, due to cost advantages and thermal performance. Their consistent demand across perishables and medical goods secures a stable position in multiple upstream packaging categories.

Growth is driven by rising demand for affordable, protective packaging in food delivery, pharmaceuticals, and electronics. These boxes provide insulation and shock resistance, making them suitable for temperature-sensitive and fragile goods.

E-commerce expansion and increased home delivery have pushed demand, especially for frozen foods and medical items. In emerging regions, logistics infrastructure improvements are boosting usage. Their role in ensuring safe transit continues to widen across industries seeking dependable, lightweight packaging options for sensitive product handling.

In a 2024 interview with Packaging South Asia, ArpitDhupar, CEO of Dharaksha, shared, “We had achieved what we desired. Our production does not leave any scope of wastage and if any product looks not up to the mark, we can easily reuse that as raw materials.

Our idea was simply to collect all the stubble. The response it gained was immense.” His remarks underscore a shift in packaging innovation-moving from traditional thermocol to bio-fabricated materials derived from stubble and mycelium. As industries seek alternatives that lower pollution, such approaches are gaining ground within cold chain and protective packaging segments.

Analyzing Thermocol Box Market by Top Investment Segments

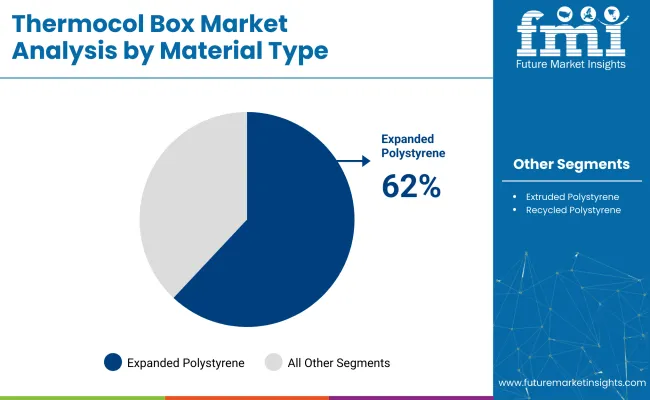
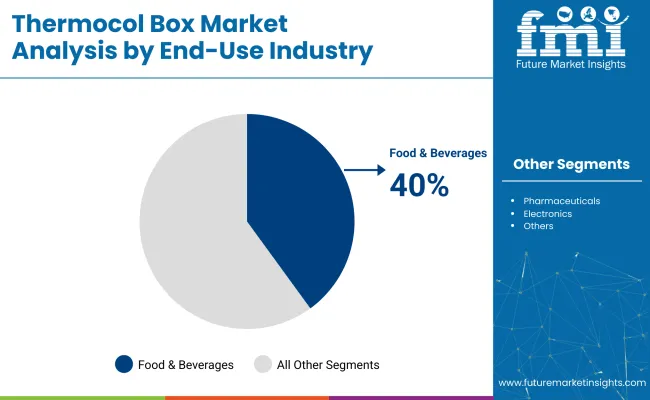
In 2025, expanded polystyrene is set to lead the thermocol box industry with a 62% share, driven by its insulation, affordability, and use in cold chain logistics. Rectangular boxes (58%) dominate due to efficient stacking. Food and beverage (40%) and direct/e-commerce channels (70%) remain top end-use and distribution segments.

Expanded Polystyrene Dominates Material Type with Significant Market Share

Expanded Polystyrene (EPS) is anticipated to command 62% of the thermocol box industry in 2025.This material's dominance is attributed to its excellent insulating properties, lightweight structure, and cost-effectiveness, which make it ideal for temperature-sensitive goods.
  • EPS packaging has been preferred for frozen foods, meats, vegetables, and pharmaceuticals that require consistent temperature maintenance during transport.
  • Impact resistance and internal thermal stability have enabled EPS to support high-risk shipments across foodservice and healthcare distribution.
  • Cold chain logistics operators and temperature-controlled storage providers have increasingly adopted EPS solutions for their affordability and dependability in transit.

Thermocol Box Market Analysis By Material Type

Rectangular Thermocol Boxes: The Most Popular Shape for Packaging

Rectangular thermocol boxes are expected to capture 58% of the industry share in 2025. The rectangular shape is widely preferred due to its practical design, which ensures easy stacking, transportation, and storage.

  • Rectangular formats have been adopted across food logistics for meats, fruits, vegetables, and bakery shipments due to their consistent sizing and stacking convenience.
  • Standardized dimensions have helped reduce shipping expenses while optimizing storage across warehousing and distribution.
  • Broader application in pharmaceutical and electronic segments has supported ongoing demand for rectangular EPS packaging in temperature-controlled transport.

Cold Chain Logistics Drives Thermocol Box Demand in Various Industries

Cold chain logistics is projected to account for 36% of the industry share in 2025. As the demand for temperature-sensitive goods grows, especially in the food, pharmaceutical, and electronics sectors, the need for reliable packaging solutions increases.

  • EPS-based containers have been used for transporting vaccines, fresh produce, and electronics due to their insulation and temperature-control capabilities.
  • Food safety protocols and pharmaceutical handling requirements have pushed packaging systems to adopt EPS solutions for cold chain reliability.
  • Increased dependency on temperature-sensitive logistics has strengthened demand for thermocol boxes in regulated supply chains.

Food and Beverages Lead the End-Use Market with Strong Demand

The food and beverages industry is expected to hold 40% of the thermocol box industry share in 2025.Thermocol boxes are essential in maintaining the freshness and integrity of perishable food products during transport, ensuring that items like meats, dairy, and frozen foods stay at optimal temperatures.
  • Insulation capabilities have enabled EPS packaging to maintain stable conditions during frozen and fresh food shipments.
  • Expansion of e-commerce grocery platforms and meal delivery services has raised the need for affordable thermal packaging.
  • Consumer preferences for convenience and food safety have kept food and beverage logistics among the leading users of EPS boxes.

Thermocol Box Market Analysis By End Use Industry

Direct Sales and E-commerce Channels Dominate Distribution

Direct sales and e-commerce distribution channels are expected to capture a combined market share of 70% by 2025. The direct sales model facilitates long-term partnerships with manufacturers, wholesalers, and businesses requiring large quantities of thermocol boxes, especially for the food and pharmaceutical sectors.
  • Rising demand for convenience and pricing flexibility has supported the expansion of thermocol packaging sales through online retail platforms.
  • E-commerce suppliers have streamlined access to various EPS box configurations, catering to diverse operational requirements.
  • Broader consumer shift toward digital purchasing channels has contributed to the wider distribution and reach of thermocol-based packaging.

Top Countries Manufacturing, Synthesizing, Distributing, and Generating Demand for Thermocol Boxes

Thermocol Box Market Country Wise Analysis

Country CAGR (2025 to 2035)
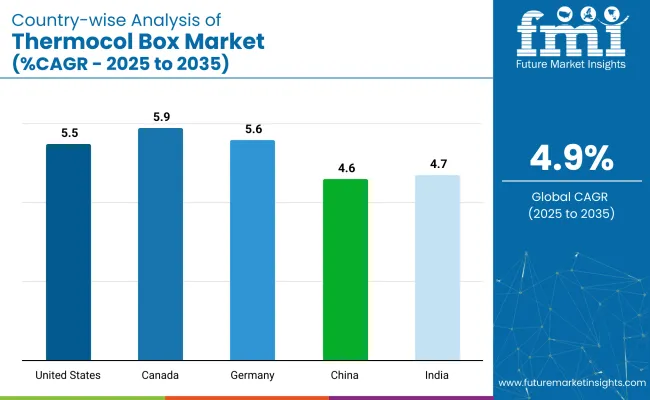
United States 5.5%
Canada 5.9%
Germany 5.6%
China 4.6%
India 4.7%

India’s growth is driven by increasing demand for cost-effective packaging solutions in the growing e-commerce and food delivery sectors. China follows closely, with a projected 4.6% CAGR, supported by its strong manufacturing base and expanding logistics sector. In contrast, developed economies such as Germany (5.6%), Canada (5.9%), and the United States (5.5%) are expanding at a steady 0.95-1.03x rate.

The United States leads the demand for thermocol boxes, driven by its strong logistics and food delivery industries. Canada follows closely with steady growth, supported by its growing demand for cost-effective packaging solutions. Germany benefits from innovations in green packaging, with increasing demand for thermocol products. As the market adds over USD 1 billion by 2035, both high-growth regions like India and China, and steady demand from OECD countries will shape its trajectory.

The report covers detailed analysis of 40+ countries, with the top five countries shared as a reference.

An Overview of United StatesThermocol Box Market Growth

The industry in the United States is expected to grow at a CAGR of 5.5% from 2025 to 2035. The industry is being driven by the exponential growth of e-commerce and the increasing demand for food delivery services, especially in urban areas. USA businesses are adopting thermocol boxes for their superior insulation properties, which help maintain product integrity during shipping. Innovations in thermocol packaging materials, including eco-friendlier options, are contributing to industry growth while meeting regulatory requirements for safe and eco-conscious packaging.

  • Stringent government regulations on food and pharmaceutical packaging ensure the use of high-quality thermocol.
  • USA companies are investing in innovations, such as recyclable thermocol and energy-efficient production processes.
  • The growth of the online food delivery industry is fueling demand for temperature-sensitive packaging.

Canada Thermocol Box Industry Analysis and Growth

The industry in Canada is projected to grow at a CAGR of 5.9% from 2025 to 2035. A significant driver of this growth is the continued rise of online grocery shopping and food delivery. As Canada has strict regulations regarding the safety and quality of packaging materials used for food and pharmaceutical products, the adoption of thermocol boxes remains critical.

  • Strong regulatory framework drives adoption of high-quality, compliant packaging solutions.
  • E-commerce and online grocery services significantly increase demand for reliable insulation packaging.
  • Canada is focusing on developing biodegradable thermocol boxes in response to packaging reduction goals.

In-Depth Analysis of Germany Thermocol Box Market

Germany’s EPS packaging box industry is expected to grow at a CAGR of 5.6% from 2025 to 2035. The country is a leader in cold chain logistics, and with its robust regulatory framework, it ensures that packaging solutions meet high safety standards.

Germany’s commitment to reducing environmental impact through strict packaging laws is encouraging innovation in thermocol box design, focusing on recyclability and efficiency. These regulations, coupled with technological advancements in packaging materials, continue to drive the adoption of thermocol boxes, especially in the food and pharmaceutical sectors.

  • Strict environmental regulations and packaging laws encourage adoption of recyclable thermocol solutions.
  • The demand for cold chain packaging in pharmaceuticals and food safety boosts industry growth.
  • Germany's advanced logistics infrastructure supports the efficient distribution of temperature-sensitive goods.

An Overview of China Thermocol Box Industry Growth

The EPS packaging box industry in China is projected to grow at a CAGR of 4.6% from 2025 to 2035. As China continues to experience rapid urbanization and the expansion of e-commerce, there is an increasing need for cost-effective packaging solutions.

The Chinese government has made significant investments in cold chain logistics infrastructure, which is directly contributing to the adoption of thermocol boxes. Additionally, China is seeing increased innovation in thermocol box production, focusing on lowering manufacturing costs while improving insulation efficiency, making it more suitable for large-scale distribution.

  • Government investments in cold chain logistics infrastructure significantly drive industry adoption.
  • Innovations in thermocol box production aim to reduce manufacturing costs and improve insulation efficiency.
  • The growth of urban areas and e-commerce leads to a higher demand for temperature-controlled packaging.

India Thermocol Box Industry Analysis and Growth

India’s EPS packaging box market is set to grow at a CAGR of 4.7% from 2025 to 2035. India’s e-commerce sector, especially in the food delivery and pharmaceutical industries, is expanding rapidly, which is creating increased demand for reliable and cost-effective packaging.

The Indian government’s focus on improving cold chain logistics and reducing packaging waste is also pushing the industry toward more efficient thermocol solutions. The widespread use of EPS packaging boxes for transporting perishable goods, especially in rural and semi-urban areas, plays a crucial role in the market’s growth.
  • Government initiatives aimed at improving cold chain logistics and supply chain efficiency are fostering market adoption.
  • Increasing focus on cost-effective and reliable packaging solutions for e-commerce and food delivery.
  • Rising innovation in EPS packaging box design and local manufacturing capabilities cater to the growing demand in rural and semi-urban areas.

Leading Thermocol Box SuppliersMarket Leader :StoropackSchweiz 27-30%

Thermocol Box Market Analysis By Company

The thermocol box industry reflects a mix of established players and regional challengers. StoropackSchweiz and Thermosafe have focused on R&D-driven insulation solutions for pharma cold chains, with the former expanding its phase-change material lineup in 2024.

Sofrigram launched a modular EPS system in Q1 2025, aimed at European frozen food retailers. JV Packaging Solutions and THERMOCON continue to offer customized packaging options, while Styropek has pushed forward in Latin America through capacity enhancement. Universal Foam Products and Styrotech, Inc. remain prominent in the USA, catering to perishables and e-commerce packaging.

Entry into the industry is restricted by tooling costs, fire resistance compliance, and cold chain distribution tie-ups. The supply landscape is fragmented, with regional consolidation visible across Germany, India, and the USA, especially through backward integration and distributor acquisition by mid-sized players like Poly Molding LLC and Harbor Foam.

Recent Thermocol Box Industry News

  • On April 30, 2024, Storopack acquired a minority stake in Ameson New Material Technology to boost regional innovation and accelerate the rollout of rEPS packaging made entirely from recycled material.
  • On April 3, 2025, ThermoSafe introduced its ChillTherm Bio pallet shipper at LogiPharma Lyon, delivering 120-hour temperature control with 90% biodegradability, marking a shift toward high-performance bio-EPS cold chain solutions.

Leading Players

  • StoropackSchweiz
  • Thermosafe
  • JV Packaging Solutions
  • Sofrigram
  • THERMOCON
  • Styropek
  • Universal Foam Products
  • Styrotech, Inc.
  • Poly Molding LLC
  • Harbor Foam

Thermocol Box Market-Report Scope

Report Attributes Details
Market Size (2025) USD 1.8 billion
Projected Market Size (2035) USD 2.9 billion
CAGR (2025 to 2035) 4.9%
Base Year for Estimation 2024
Historical Period 2020 to 2024
Projections Period 2025 to 2035
Quantitative Units USD billion for value
Material Types Analyzed Expanded Polystyrene (EPS), Extruded Polystyrene (XPS), Recycled Polystyrene
Shape or Form Types Analyzed Rectangular, Cylindrical, Customized Shapes
Applications Analyzed Packaging, Cold Chain Logistics, Insulation, Storage
End-Use Industries Analyzed Food & Beverages (Fruits & Vegetables, Dairy, Processed Foods, Confectionery, Meat & Poultry), Pharmaceuticals (Vaccines, Biologics, Diagnostic Kits, Cold Chain Drugs), Electronics (Semiconductors, Sensitive Equipment, Electronic Appliances), Seafood (Fresh Fish, Frozen Shrimp, Shellfish Export), Industrial Packaging (Chemicals, Specialty Materials, Components Shipping)
Distribution Channels Analyzed Direct Sales, Distributors/Dealers, E-commerce Platforms
Regions Covered North America, Latin America, Western Europe, Eastern Europe, East Asia, South Asia & Pacific, Middle East & Africa
Countries Covered United States, Canada, Brazil, Mexico, Germany, France, United Kingdom, Italy, Spain, China, Japan, South Korea, India, Australia, UAE, South Africa
Key Players Storopack Schweiz , Thermosafe , JV Packaging Solutions, Sofrigram , THERMOCON, Styropek , Universal Foam Products, Styrotech , Inc., Poly Molding LLC, Harbor Foam
Additional Attributes Dollar sales growth by application (food, pharma, electronics), regional demand trends, competitive landscape, pricing strategies, distribution channel insights, material innovations, growth drivers in cold chain logistics.

Thermocol Box Market Analyzed by Key Investment Segments 

By Material Type:

Expanded Polystyrene (EPS), Extruded Polystyrene (XPS), and Recycled Polystyrene.

By Shape /Form:

Rectangular, Cylindrical, and Customized Shapes

By Application:

Packaging, Cold Chain Logistics, Insulation, and Storage

By End-Use Industry:

  • Food & Beverages: Fruits & Vegetables, Dairy, Processed Foods, Confectionery, Meat & Poultry
  • Pharmaceuticals: Vaccines, Biologics, Diagnostic Kits, Cold Chain Drugs
  • Electronics: Semiconductors, Sensitive Equipment, Electronic Appliances
  • Seafood: Fresh Fish, Frozen Shrimp, Shellfish Export
  • Industrial Packaging: Chemicals, Specialty Materials, Components Shipping

By Distribution Channel:

Direct Sales, Distributors/Dealers, and E-commerce platforms.

Table of Content

  1. Executive Summary
    • Global Market Outlook
    • Demand-side Trends
    • Supply-side Trends
    • Technology Roadmap Analysis
    • Analysis and Recommendations
  2. Market Overview
    • Market Coverage / Taxonomy
    • Market Definition / Scope / Limitations
  3. Market Background
    • Market Dynamics
      • Drivers
      • Restraints
      • Opportunity
      • Trends
    • Scenario Forecast
      • Demand in Optimistic Scenario
      • Demand in Likely Scenario
      • Demand in Conservative Scenario
    • Opportunity Map Analysis
    • Product Life Cycle Analysis
    • Supply Chain Analysis
      • Supply Side Participants and their Roles
        • Producers
        • Mid-Level Participants (Traders/ Agents/ Brokers)
        • Wholesalers and Distributors
      • Value Added and Value Created at Node in the Supply Chain
      • List of Raw Material Suppliers
      • List of Existing and Potential Buyer’s
    • Investment Feasibility Matrix
    • Value Chain Analysis
      • Profit Margin Analysis
      • Wholesalers and Distributors
      • Retailers
    • PESTLE and Porter’s Analysis
    • Regulatory Landscape
      • By Key Regions
      • By Key Countries
    • Regional Parent Market Outlook
    • Production and Consumption Statistics
    • Import and Export Statistics
  4. Global Market Analysis 2020 to 2024 and Forecast, 2025 to 2035
    • Historical Market Size Value (USD Billion) & Metric Ton (MT) Analysis, 2020 to 2024
    • Current and Future Market Size Value (USD Billion) & Metric Ton (MT) Projections, 2025 to 2035
      • Y-o-Y Growth Trend Analysis
      • Absolute $ Opportunity Analysis
  5. Global Market Pricing Analysis 2020 to 2024 and Forecast 2025 to 2035
  6. Global Market Analysis 2020 to 2024 and Forecast 2025 to 2035, By Material Type
    • Introduction / Key Findings
    • Historical Market Size Value (USD Billion) & Metric Ton (MT) Analysis By Material Type , 2020 to 2024
    • Current and Future Market Size Value (USD Billion) & Metric Ton (MT) Analysis and Forecast By Material Type , 2025 to 2035
      • Expanded Polystyrene (EPS)
      • Extruded Polystyrene (XPS)
      • Recycled Polystyrene
    • Y-o-Y Growth Trend Analysis By Material Type , 2020 to 2024
    • Absolute $ Opportunity Analysis By Material Type , 2025 to 2035
  7. Global Market Analysis 2020 to 2024 and Forecast 2025 to 2035, By Shape /Form
    • Introduction / Key Findings
    • Historical Market Size Value (USD Billion) & Metric Ton (MT) Analysis By Shape /Form, 2020 to 2024
    • Current and Future Market Size Value (USD Billion) & Metric Ton (MT) Analysis and Forecast By Shape /Form, 2025 to 2035
      • Rectangular
      • Cylindrical
      • Customized Shapes
    • Y-o-Y Growth Trend Analysis By Shape /Form, 2020 to 2024
    • Absolute $ Opportunity Analysis By Shape /Form, 2025 to 2035
  8. Global Market Analysis 2020 to 2024 and Forecast 2025 to 2035, By Application
    • Introduction / Key Findings
    • Historical Market Size Value (USD Billion) & Metric Ton (MT) Analysis By Application , 2020 to 2024
    • Current and Future Market Size Value (USD Billion) & Metric Ton (MT) Analysis and Forecast By Application , 2025 to 2035
      • Packaging
      • Cold Chain Logistics
      • Insulation
      • Storage
    • Y-o-Y Growth Trend Analysis By Application , 2020 to 2024
    • Absolute $ Opportunity Analysis By Application , 2025 to 2035
  9. Global Market Analysis 2020 to 2024 and Forecast 2025 to 2035, By End-Use Industry
    • Introduction / Key Findings
    • Historical Market Size Value (USD Billion) & Metric Ton (MT) Analysis By End-Use Industry, 2020 to 2024
    • Current and Future Market Size Value (USD Billion) & Metric Ton (MT) Analysis and Forecast By End-Use Industry, 2025 to 2035
      • Food & Beverages
        • Fruits & Vegetables
        • Dairy
        • Processed Foods
        • Confectionery
        • Meat & Poultry
      • Pharmaceuticals
        • Vaccines
        • Biologics
        • Diagnostic Kits
        • Cold Chain Drugs
      • Electronics
        • Semiconductors
        • Sensitive Equipment,
        • Electronic Appliances
      • Seafood
        • Fresh Fish
        • Frozen Shrimp
        • Shellfish Export
      • Industrial Packaging
        • Chemicals
        • Specialty Materials
        • Components Shipping
    • Y-o-Y Growth Trend Analysis By End-Use Industry, 2020 to 2024
    • Absolute $ Opportunity Analysis By End-Use Industry, 2025 to 2035
  10. Global Market Analysis 2020 to 2024 and Forecast 2025 to 2035, By Distribution Channel
    • Introduction / Key Findings
    • Historical Market Size Value (USD Billion) & Metric Ton (MT) Analysis By Distribution Channel , 2020 to 2024
    • Current and Future Market Size Value (USD Billion) & Metric Ton (MT) Analysis and Forecast By Distribution Channel , 2025 to 2035
      • Direct Sales
      • Distributors/Dealers
      • E-commerce platforms
    • Y-o-Y Growth Trend Analysis By Distribution Channel , 2020 to 2024
    • Absolute $ Opportunity Analysis By Distribution Channel , 2025 to 2035
  11. Global Market Analysis 2020 to 2024 and Forecast 2025 to 2035, By Region
    • Introduction
    • Historical Market Size Value (USD Billion) & Metric Ton (MT) Analysis By Region, 2020 to 2024
    • Current Market Size Value (USD Billion) & Metric Ton (MT) Analysis and Forecast By Region, 2025 to 2035
      • North America
      • Latin America
      • Western Europe
      • Eastern Europe
      • East Asia
      • South Asia & Pacific
      • Middle East and Africa
    • Market Attractiveness Analysis By Region
  12. North America Market Analysis 2020 to 2024 and Forecast 2025 to 2035, By Country
    • Historical Market Size Value (USD Billion) & Metric Ton (MT) Trend Analysis By Market Taxonomy, 2020 to 2024
    • Market Size Value (USD Billion) & Metric Ton (MT) Forecast By Market Taxonomy, 2025 to 2035
      • By Country
        • USA
        • Canada
        • Mexico
      • By Material Type
      • By Shape /Form
      • By Application
      • By End-Use Industry
      • By Distribution Channel
    • Market Attractiveness Analysis
      • By Country
      • By Material Type
      • By Shape /Form
      • By Application
      • By End-Use Industry
      • By Distribution Channel
    • Key Takeaways
  13. Latin America Market Analysis 2020 to 2024 and Forecast 2025 to 2035, By Country
    • Historical Market Size Value (USD Billion) & Metric Ton (MT) Trend Analysis By Market Taxonomy, 2020 to 2024
    • Market Size Value (USD Billion) & Metric Ton (MT) Forecast By Market Taxonomy, 2025 to 2035
      • By Country
        • Brazil
        • Argentina
        • Rest of LATAM
      • By Material Type
      • By Shape /Form
      • By Application
      • By End-Use Industry
      • By Distribution Channel
    • Market Attractiveness Analysis
      • By Country
      • By Material Type
      • By Shape /Form
      • By Application
      • By End-Use Industry
      • By Distribution Channel
    • Key Takeaways
  14. Western Europe Market Analysis 2020 to 2024 and Forecast 2025 to 2035, By Country
    • Historical Market Size Value (USD Billion) & Metric Ton (MT) Trend Analysis By Market Taxonomy, 2020 to 2024
    • Market Size Value (USD Billion) & Metric Ton (MT) Forecast By Market Taxonomy, 2025 to 2035
      • By Country
        • Germany
        • Italy
        • France
        • UK
        • Spain
        • BENELUX
        • Nordic
        • Rest of W.Europe
      • By Material Type
      • By Shape /Form
      • By Application
      • By End-Use Industry
      • By Distribution Channel
    • Market Attractiveness Analysis
      • By Country
      • By Material Type
      • By Shape /Form
      • By Application
      • By End-Use Industry
      • By Distribution Channel
    • Key Takeaways
  15. Eastern Europe Market Analysis 2020 to 2024 and Forecast 2025 to 2035, By Country
    • Historical Market Size Value (USD Billion) & Metric Ton (MT) Trend Analysis By Market Taxonomy, 2020 to 2024
    • Market Size Value (USD Billion) & Metric Ton (MT) Forecast By Market Taxonomy, 2025 to 2035
      • By Country
        • Russia
        • Hungary
        • Poland
        • Balkan & Baltics
        • Rest of E. Europe
      • By Material Type
      • By Shape /Form
      • By Application
      • By End-Use Industry
      • By Distribution Channel
    • Market Attractiveness Analysis
      • By Country
      • By Material Type
      • By Shape /Form
      • By Application
      • By End-Use Industry
      • By Distribution Channel
    • Key Takeaways
  16. East Asia Market Analysis 2020 to 2024 and Forecast 2025 to 2035, By Country
    • Historical Market Size Value (USD Billion) & Metric Ton (MT) Trend Analysis By Market Taxonomy, 2020 to 2024
    • Market Size Value (USD Billion) & Metric Ton (MT) Forecast By Market Taxonomy, 2025 to 2035
      • By Country
        • China
        • Japan
        • South Korea
      • By Material Type
      • By Shape /Form
      • By Application
      • By End-Use Industry
      • By Distribution Channel
    • Market Attractiveness Analysis
      • By Country
      • By Material Type
      • By Shape /Form
      • By Application
      • By End-Use Industry
      • By Distribution Channel
    • Key Takeaways
  17. South Asia & Pacific Market Analysis 2020 to 2024 and Forecast 2025 to 2035, By Country
    • Historical Market Size Value (USD Billion) & Metric Ton (MT) Trend Analysis By Market Taxonomy, 2020 to 2024
    • Market Size Value (USD Billion) & Metric Ton (MT) Forecast By Market Taxonomy, 2025 to 2035
      • By Country
        • India
        • Australia & New Zealand
        • ASEAN
        • Rest of SAP
      • By Material Type
      • By Shape /Form
      • By Application
      • By End-Use Industry
      • By Distribution Channel
    • Market Attractiveness Analysis
      • By Country
      • By Material Type
      • By Shape /Form
      • By Application
      • By End-Use Industry
      • By Distribution Channel
    • Key Takeaways
  18. Middle East and Africa Market Analysis 2020 to 2024 and Forecast 2025 to 2035, By Country
    • Historical Market Size Value (USD Billion) & Metric Ton (MT) Trend Analysis By Market Taxonomy, 2020 to 2024
    • Market Size Value (USD Billion) & Metric Ton (MT) Forecast By Market Taxonomy, 2025 to 2035
      • By Country
        • GCC Countries
        • Northern Africa
        • South Africa
        • Turkiye
        • Rest of MEA
      • By Material Type
      • By Shape /Form
      • By Application
      • By End-Use Industry
      • By Distribution Channel
    • Market Attractiveness Analysis
      • By Country
      • By Material Type
      • By Shape /Form
      • By Application
      • By End-Use Industry
      • By Distribution Channel
    • Key Takeaways
  19. Key Countries Market Analysis
    • USA
      • Pricing Analysis
      • Market Share Analysis, 2024
        • By Material Type
        • By Shape /Form
        • By Application
        • By End-Use Industry
        • By Distribution Channel
    • Canada
      • Pricing Analysis
      • Market Share Analysis, 2024
        • By Material Type
        • By Shape /Form
        • By Application
        • By End-Use Industry
        • By Distribution Channel
    • Brazil
      • Pricing Analysis
      • Market Share Analysis, 2024
        • By Material Type
        • By Shape /Form
        • By Application
        • By End-Use Industry
        • By Distribution Channel
    • Mexico
      • Pricing Analysis
      • Market Share Analysis, 2024
        • By Material Type
        • By Shape /Form
        • By Application
        • By End-Use Industry
        • By Distribution Channel
    • Argentina
      • Pricing Analysis
      • Market Share Analysis, 2024
        • By Material Type
        • By Shape /Form
        • By Application
        • By End-Use Industry
        • By Distribution Channel
  20. Market Structure Analysis
    • Competition Dashboard
    • Competition Benchmarking
    • Market Share Analysis of Top Players
      • By Regional
      • By Material Type
      • By Shape /Form
      • By Application
      • By End-Use Industry
      • By Distribution Channel
  21. Competition Analysis
    • Competition Deep Dive
      • Storopack Schweiz
        • Overview
        • Product Portfolio
        • Profitability by Market Segments (Product/Age /Sales Channel/Region)
        • Sales Footprint
        • Strategy Overview
          • Marketing Strategy
          • Product Strategy
          • Channel Strategy
      • Thermosafe
        • Overview
        • Product Portfolio
        • Profitability by Market Segments (Product/Age /Sales Channel/Region)
        • Sales Footprint
        • Strategy Overview
          • Marketing Strategy
          • Product Strategy
          • Channel Strategy
      • JV Packaging Solutions
        • Overview
        • Product Portfolio
        • Profitability by Market Segments (Product/Age /Sales Channel/Region)
        • Sales Footprint
        • Strategy Overview
          • Marketing Strategy
          • Product Strategy
          • Channel Strategy
      • Sofrigram
        • Overview
        • Product Portfolio
        • Profitability by Market Segments (Product/Age /Sales Channel/Region)
        • Sales Footprint
        • Strategy Overview
          • Marketing Strategy
          • Product Strategy
          • Channel Strategy
      • THERMOCON
        • Overview
        • Product Portfolio
        • Profitability by Market Segments (Product/Age /Sales Channel/Region)
        • Sales Footprint
        • Strategy Overview
          • Marketing Strategy
          • Product Strategy
          • Channel Strategy
      • Styropek
        • Overview
        • Product Portfolio
        • Profitability by Market Segments (Product/Age /Sales Channel/Region)
        • Sales Footprint
        • Strategy Overview
          • Marketing Strategy
          • Product Strategy
          • Channel Strategy
      • Universal Foam Products
        • Overview
        • Product Portfolio
        • Profitability by Market Segments (Product/Age /Sales Channel/Region)
        • Sales Footprint
        • Strategy Overview
          • Marketing Strategy
          • Product Strategy
          • Channel Strategy
      • Styrotech, Inc.
        • Overview
        • Product Portfolio
        • Profitability by Market Segments (Product/Age /Sales Channel/Region)
        • Sales Footprint
        • Strategy Overview
          • Marketing Strategy
          • Product Strategy
          • Channel Strategy
      • Poly Molding LLC
        • Overview
        • Product Portfolio
        • Profitability by Market Segments (Product/Age /Sales Channel/Region)
        • Sales Footprint
        • Strategy Overview
          • Marketing Strategy
          • Product Strategy
          • Channel Strategy
      • Harbor Foam
        • Overview
        • Product Portfolio
        • Profitability by Market Segments (Product/Age /Sales Channel/Region)
        • Sales Footprint
        • Strategy Overview
          • Marketing Strategy
          • Product Strategy
          • Channel Strategy
  22. Assumptions & Acronyms Used
  23. Research Methodology

List of Tables

  • Table 1: Global Market Value (USD Billion) Forecast by Region, 2020-2035
  • Table 2: Global Market Metric Ton (MT) Forecast by Region, 2020-2035
  • Table 3: Global Market Value (USD Billion) Forecast by Material Type , 2020-2035
  • Table 4: Global Market Metric Ton (MT) Forecast by Material Type , 2020-2035
  • Table 5: Global Market Value (USD Billion) Forecast by Shape /Form, 2020-2035
  • Table 6: Global Market Metric Ton (MT) Forecast by Shape /Form, 2020-2035
  • Table 7: Global Market Value (USD Billion) Forecast by Application , 2020-2035
  • Table 8: Global Market Metric Ton (MT) Forecast by Application , 2020-2035
  • Table 9: Global Market Value (USD Billion) Forecast by End-Use Industry, 2020-2035
  • Table 10: Global Market Metric Ton (MT) Forecast by End-Use Industry, 2020-2035
  • Table 11: Global Market Value (USD Billion) Forecast by Distribution Channel , 2020-2035
  • Table 12: Global Market Metric Ton (MT) Forecast by Distribution Channel , 2020-2035
  • Table 13: North America Market Value (USD Billion) Forecast by Country, 2020-2035
  • Table 14: North America Market Metric Ton (MT) Forecast by Country, 2020-2035
  • Table 15: North America Market Value (USD Billion) Forecast by Material Type , 2020-2035
  • Table 16: North America Market Metric Ton (MT) Forecast by Material Type , 2020-2035
  • Table 17: North America Market Value (USD Billion) Forecast by Shape /Form, 2020-2035
  • Table 18: North America Market Metric Ton (MT) Forecast by Shape /Form, 2020-2035
  • Table 19: North America Market Value (USD Billion) Forecast by Application , 2020-2035
  • Table 20: North America Market Metric Ton (MT) Forecast by Application , 2020-2035
  • Table 21: North America Market Value (USD Billion) Forecast by End-Use Industry, 2020-2035
  • Table 22: North America Market Metric Ton (MT) Forecast by End-Use Industry, 2020-2035
  • Table 23: North America Market Value (USD Billion) Forecast by Distribution Channel , 2020-2035
  • Table 24: North America Market Metric Ton (MT) Forecast by Distribution Channel , 2020-2035
  • Table 25: Latin America Market Value (USD Billion) Forecast by Country, 2020-2035
  • Table 26: Latin America Market Metric Ton (MT) Forecast by Country, 2020-2035
  • Table 27: Latin America Market Value (USD Billion) Forecast by Material Type , 2020-2035
  • Table 28: Latin America Market Metric Ton (MT) Forecast by Material Type , 2020-2035
  • Table 29: Latin America Market Value (USD Billion) Forecast by Shape /Form, 2020-2035
  • Table 30: Latin America Market Metric Ton (MT) Forecast by Shape /Form, 2020-2035
  • Table 31: Latin America Market Value (USD Billion) Forecast by Application , 2020-2035
  • Table 32: Latin America Market Metric Ton (MT) Forecast by Application , 2020-2035
  • Table 33: Latin America Market Value (USD Billion) Forecast by End-Use Industry, 2020-2035
  • Table 34: Latin America Market Metric Ton (MT) Forecast by End-Use Industry, 2020-2035
  • Table 35: Latin America Market Value (USD Billion) Forecast by Distribution Channel , 2020-2035
  • Table 36: Latin America Market Metric Ton (MT) Forecast by Distribution Channel , 2020-2035
  • Table 37: Western Europe Market Value (USD Billion) Forecast by Country, 2020-2035
  • Table 38: Western Europe Market Metric Ton (MT) Forecast by Country, 2020-2035
  • Table 39: Western Europe Market Value (USD Billion) Forecast by Material Type , 2020-2035
  • Table 40: Western Europe Market Metric Ton (MT) Forecast by Material Type , 2020-2035
  • Table 41: Western Europe Market Value (USD Billion) Forecast by Shape /Form, 2020-2035
  • Table 42: Western Europe Market Metric Ton (MT) Forecast by Shape /Form, 2020-2035
  • Table 43: Western Europe Market Value (USD Billion) Forecast by Application , 2020-2035
  • Table 44: Western Europe Market Metric Ton (MT) Forecast by Application , 2020-2035
  • Table 45: Western Europe Market Value (USD Billion) Forecast by End-Use Industry, 2020-2035
  • Table 46: Western Europe Market Metric Ton (MT) Forecast by End-Use Industry, 2020-2035
  • Table 47: Western Europe Market Value (USD Billion) Forecast by Distribution Channel , 2020-2035
  • Table 48: Western Europe Market Metric Ton (MT) Forecast by Distribution Channel , 2020-2035
  • Table 49: Eastern Europe Market Value (USD Billion) Forecast by Country, 2020-2035
  • Table 50: Eastern Europe Market Metric Ton (MT) Forecast by Country, 2020-2035
  • Table 51: Eastern Europe Market Value (USD Billion) Forecast by Material Type , 2020-2035
  • Table 52: Eastern Europe Market Metric Ton (MT) Forecast by Material Type , 2020-2035
  • Table 53: Eastern Europe Market Value (USD Billion) Forecast by Shape /Form, 2020-2035
  • Table 54: Eastern Europe Market Metric Ton (MT) Forecast by Shape /Form, 2020-2035
  • Table 55: Eastern Europe Market Value (USD Billion) Forecast by Application , 2020-2035
  • Table 56: Eastern Europe Market Metric Ton (MT) Forecast by Application , 2020-2035
  • Table 57: Eastern Europe Market Value (USD Billion) Forecast by End-Use Industry, 2020-2035
  • Table 58: Eastern Europe Market Metric Ton (MT) Forecast by End-Use Industry, 2020-2035
  • Table 59: Eastern Europe Market Value (USD Billion) Forecast by Distribution Channel , 2020-2035
  • Table 60: Eastern Europe Market Metric Ton (MT) Forecast by Distribution Channel , 2020-2035
  • Table 61: East Asia Market Value (USD Billion) Forecast by Country, 2020-2035
  • Table 62: East Asia Market Metric Ton (MT) Forecast by Country, 2020-2035
  • Table 63: East Asia Market Value (USD Billion) Forecast by Material Type , 2020-2035
  • Table 64: East Asia Market Metric Ton (MT) Forecast by Material Type , 2020-2035
  • Table 65: East Asia Market Value (USD Billion) Forecast by Shape /Form, 2020-2035
  • Table 66: East Asia Market Metric Ton (MT) Forecast by Shape /Form, 2020-2035
  • Table 67: East Asia Market Value (USD Billion) Forecast by Application , 2020-2035
  • Table 68: East Asia Market Metric Ton (MT) Forecast by Application , 2020-2035
  • Table 69: East Asia Market Value (USD Billion) Forecast by End-Use Industry, 2020-2035
  • Table 70: East Asia Market Metric Ton (MT) Forecast by End-Use Industry, 2020-2035
  • Table 71: East Asia Market Value (USD Billion) Forecast by Distribution Channel , 2020-2035
  • Table 72: East Asia Market Metric Ton (MT) Forecast by Distribution Channel , 2020-2035
  • Table 73: South Asia & Pacific Market Value (USD Billion) Forecast by Country, 2020-2035
  • Table 74: South Asia & Pacific Market Metric Ton (MT) Forecast by Country, 2020-2035
  • Table 75: South Asia & Pacific Market Value (USD Billion) Forecast by Material Type , 2020-2035
  • Table 76: South Asia & Pacific Market Metric Ton (MT) Forecast by Material Type , 2020-2035
  • Table 77: South Asia & Pacific Market Value (USD Billion) Forecast by Shape /Form, 2020-2035
  • Table 78: South Asia & Pacific Market Metric Ton (MT) Forecast by Shape /Form, 2020-2035
  • Table 79: South Asia & Pacific Market Value (USD Billion) Forecast by Application , 2020-2035
  • Table 80: South Asia & Pacific Market Metric Ton (MT) Forecast by Application , 2020-2035
  • Table 81: South Asia & Pacific Market Value (USD Billion) Forecast by End-Use Industry, 2020-2035
  • Table 82: South Asia & Pacific Market Metric Ton (MT) Forecast by End-Use Industry, 2020-2035
  • Table 83: South Asia & Pacific Market Value (USD Billion) Forecast by Distribution Channel , 2020-2035
  • Table 84: South Asia & Pacific Market Metric Ton (MT) Forecast by Distribution Channel , 2020-2035
  • Table 85: Middle East and Africa Market Value (USD Billion) Forecast by Country, 2020-2035
  • Table 86: Middle East and Africa Market Metric Ton (MT) Forecast by Country, 2020-2035
  • Table 87: Middle East and Africa Market Value (USD Billion) Forecast by Material Type , 2020-2035
  • Table 88: Middle East and Africa Market Metric Ton (MT) Forecast by Material Type , 2020-2035
  • Table 89: Middle East and Africa Market Value (USD Billion) Forecast by Shape /Form, 2020-2035
  • Table 90: Middle East and Africa Market Metric Ton (MT) Forecast by Shape /Form, 2020-2035
  • Table 91: Middle East and Africa Market Value (USD Billion) Forecast by Application , 2020-2035
  • Table 92: Middle East and Africa Market Metric Ton (MT) Forecast by Application , 2020-2035
  • Table 93: Middle East and Africa Market Value (USD Billion) Forecast by End-Use Industry, 2020-2035
  • Table 94: Middle East and Africa Market Metric Ton (MT) Forecast by End-Use Industry, 2020-2035
  • Table 95: Middle East and Africa Market Value (USD Billion) Forecast by Distribution Channel , 2020-2035
  • Table 96: Middle East and Africa Market Metric Ton (MT) Forecast by Distribution Channel , 2020-2035

List of Figures

  • Figure 1: Global Market Metric Ton (MT) Forecast 2020-2035
  • Figure 2: Global Market Pricing Analysis
  • Figure 3: Global Market Value (USD Billion) Forecast 2020-2035
  • Figure 4: Global Market Value Share and BPS Analysis by Material Type , 2025 and 2035
  • Figure 5: Global Market Y-o-Y Growth Comparison by Material Type , 2025-2035
  • Figure 6: Global Market Attractiveness Analysis by Material Type
  • Figure 7: Global Market Value Share and BPS Analysis by Shape /Form, 2025 and 2035
  • Figure 8: Global Market Y-o-Y Growth Comparison by Shape /Form, 2025-2035
  • Figure 9: Global Market Attractiveness Analysis by Shape /Form
  • Figure 10: Global Market Value Share and BPS Analysis by Application , 2025 and 2035
  • Figure 11: Global Market Y-o-Y Growth Comparison by Application , 2025-2035
  • Figure 12: Global Market Attractiveness Analysis by Application
  • Figure 13: Global Market Value Share and BPS Analysis by End-Use Industry, 2025 and 2035
  • Figure 14: Global Market Y-o-Y Growth Comparison by End-Use Industry, 2025-2035
  • Figure 15: Global Market Attractiveness Analysis by End-Use Industry
  • Figure 16: Global Market Value Share and BPS Analysis by Distribution Channel , 2025 and 2035
  • Figure 17: Global Market Y-o-Y Growth Comparison by Distribution Channel , 2025-2035
  • Figure 18: Global Market Attractiveness Analysis by Distribution Channel
  • Figure 19: Global Market Value (USD Billion) Share and BPS Analysis by Region, 2025 and 2035
  • Figure 20: Global Market Y-o-Y Growth Comparison by Region, 2025-2035
  • Figure 21: Global Market Attractiveness Analysis by Region
  • Figure 22: North America Market Incremental $ Opportunity, 2025-2035
  • Figure 23: Latin America Market Incremental $ Opportunity, 2025-2035
  • Figure 24: Western Europe Market Incremental $ Opportunity, 2025-2035
  • Figure 25: Eastern Europe Market Incremental $ Opportunity, 2025-2035
  • Figure 26: East Asia Market Incremental $ Opportunity, 2025-2035
  • Figure 27: South Asia & Pacific Market Incremental $ Opportunity, 2025-2035
  • Figure 28: Middle East and Africa Market Incremental $ Opportunity, 2025-2035
  • Figure 29: North America Market Value Share and BPS Analysis by Country, 2025 and 2035
  • Figure 30: North America Market Value Share and BPS Analysis by Material Type , 2025 and 2035
  • Figure 31: North America Market Y-o-Y Growth Comparison by Material Type , 2025-2035
  • Figure 32: North America Market Attractiveness Analysis by Material Type
  • Figure 33: North America Market Value Share and BPS Analysis by Shape /Form, 2025 and 2035
  • Figure 34: North America Market Y-o-Y Growth Comparison by Shape /Form, 2025-2035
  • Figure 35: North America Market Attractiveness Analysis by Shape /Form
  • Figure 36: North America Market Value Share and BPS Analysis by Application , 2025 and 2035
  • Figure 37: North America Market Y-o-Y Growth Comparison by Application , 2025-2035
  • Figure 38: North America Market Attractiveness Analysis by Application
  • Figure 39: North America Market Value Share and BPS Analysis by End-Use Industry, 2025 and 2035
  • Figure 40: North America Market Y-o-Y Growth Comparison by End-Use Industry, 2025-2035
  • Figure 41: North America Market Attractiveness Analysis by End-Use Industry
  • Figure 42: North America Market Value Share and BPS Analysis by Distribution Channel , 2025 and 2035
  • Figure 43: North America Market Y-o-Y Growth Comparison by Distribution Channel , 2025-2035
  • Figure 44: North America Market Attractiveness Analysis by Distribution Channel
  • Figure 45: Latin America Market Value Share and BPS Analysis by Country, 2025 and 2035
  • Figure 46: Latin America Market Value Share and BPS Analysis by Material Type , 2025 and 2035
  • Figure 47: Latin America Market Y-o-Y Growth Comparison by Material Type , 2025-2035
  • Figure 48: Latin America Market Attractiveness Analysis by Material Type
  • Figure 49: Latin America Market Value Share and BPS Analysis by Shape /Form, 2025 and 2035
  • Figure 50: Latin America Market Y-o-Y Growth Comparison by Shape /Form, 2025-2035
  • Figure 51: Latin America Market Attractiveness Analysis by Shape /Form
  • Figure 52: Latin America Market Value Share and BPS Analysis by Application , 2025 and 2035
  • Figure 53: Latin America Market Y-o-Y Growth Comparison by Application , 2025-2035
  • Figure 54: Latin America Market Attractiveness Analysis by Application
  • Figure 55: Latin America Market Value Share and BPS Analysis by End-Use Industry, 2025 and 2035
  • Figure 56: Latin America Market Y-o-Y Growth Comparison by End-Use Industry, 2025-2035
  • Figure 57: Latin America Market Attractiveness Analysis by End-Use Industry
  • Figure 58: Latin America Market Value Share and BPS Analysis by Distribution Channel , 2025 and 2035
  • Figure 59: Latin America Market Y-o-Y Growth Comparison by Distribution Channel , 2025-2035
  • Figure 60: Latin America Market Attractiveness Analysis by Distribution Channel
  • Figure 61: Western Europe Market Value Share and BPS Analysis by Country, 2025 and 2035
  • Figure 62: Western Europe Market Value Share and BPS Analysis by Material Type , 2025 and 2035
  • Figure 63: Western Europe Market Y-o-Y Growth Comparison by Material Type , 2025-2035
  • Figure 64: Western Europe Market Attractiveness Analysis by Material Type
  • Figure 65: Western Europe Market Value Share and BPS Analysis by Shape /Form, 2025 and 2035
  • Figure 66: Western Europe Market Y-o-Y Growth Comparison by Shape /Form, 2025-2035
  • Figure 67: Western Europe Market Attractiveness Analysis by Shape /Form
  • Figure 68: Western Europe Market Value Share and BPS Analysis by Application , 2025 and 2035
  • Figure 69: Western Europe Market Y-o-Y Growth Comparison by Application , 2025-2035
  • Figure 70: Western Europe Market Attractiveness Analysis by Application
  • Figure 71: Western Europe Market Value Share and BPS Analysis by End-Use Industry, 2025 and 2035
  • Figure 72: Western Europe Market Y-o-Y Growth Comparison by End-Use Industry, 2025-2035
  • Figure 73: Western Europe Market Attractiveness Analysis by End-Use Industry
  • Figure 74: Western Europe Market Value Share and BPS Analysis by Distribution Channel , 2025 and 2035
  • Figure 75: Western Europe Market Y-o-Y Growth Comparison by Distribution Channel , 2025-2035
  • Figure 76: Western Europe Market Attractiveness Analysis by Distribution Channel
  • Figure 77: Eastern Europe Market Value Share and BPS Analysis by Country, 2025 and 2035
  • Figure 78: Eastern Europe Market Value Share and BPS Analysis by Material Type , 2025 and 2035
  • Figure 79: Eastern Europe Market Y-o-Y Growth Comparison by Material Type , 2025-2035
  • Figure 80: Eastern Europe Market Attractiveness Analysis by Material Type
  • Figure 81: Eastern Europe Market Value Share and BPS Analysis by Shape /Form, 2025 and 2035
  • Figure 82: Eastern Europe Market Y-o-Y Growth Comparison by Shape /Form, 2025-2035
  • Figure 83: Eastern Europe Market Attractiveness Analysis by Shape /Form
  • Figure 84: Eastern Europe Market Value Share and BPS Analysis by Application , 2025 and 2035
  • Figure 85: Eastern Europe Market Y-o-Y Growth Comparison by Application , 2025-2035
  • Figure 86: Eastern Europe Market Attractiveness Analysis by Application
  • Figure 87: Eastern Europe Market Value Share and BPS Analysis by End-Use Industry, 2025 and 2035
  • Figure 88: Eastern Europe Market Y-o-Y Growth Comparison by End-Use Industry, 2025-2035
  • Figure 89: Eastern Europe Market Attractiveness Analysis by End-Use Industry
  • Figure 90: Eastern Europe Market Value Share and BPS Analysis by Distribution Channel , 2025 and 2035
  • Figure 91: Eastern Europe Market Y-o-Y Growth Comparison by Distribution Channel , 2025-2035
  • Figure 92: Eastern Europe Market Attractiveness Analysis by Distribution Channel
  • Figure 93: East Asia Market Value Share and BPS Analysis by Country, 2025 and 2035
  • Figure 94: East Asia Market Value Share and BPS Analysis by Material Type , 2025 and 2035
  • Figure 95: East Asia Market Y-o-Y Growth Comparison by Material Type , 2025-2035
  • Figure 96: East Asia Market Attractiveness Analysis by Material Type
  • Figure 97: East Asia Market Value Share and BPS Analysis by Shape /Form, 2025 and 2035
  • Figure 98: East Asia Market Y-o-Y Growth Comparison by Shape /Form, 2025-2035
  • Figure 99: East Asia Market Attractiveness Analysis by Shape /Form
  • Figure 100: East Asia Market Value Share and BPS Analysis by Application , 2025 and 2035
  • Figure 101: East Asia Market Y-o-Y Growth Comparison by Application , 2025-2035
  • Figure 102: East Asia Market Attractiveness Analysis by Application
  • Figure 103: East Asia Market Value Share and BPS Analysis by End-Use Industry, 2025 and 2035
  • Figure 104: East Asia Market Y-o-Y Growth Comparison by End-Use Industry, 2025-2035
  • Figure 105: East Asia Market Attractiveness Analysis by End-Use Industry
  • Figure 106: East Asia Market Value Share and BPS Analysis by Distribution Channel , 2025 and 2035
  • Figure 107: East Asia Market Y-o-Y Growth Comparison by Distribution Channel , 2025-2035
  • Figure 108: East Asia Market Attractiveness Analysis by Distribution Channel
  • Figure 109: South Asia & Pacific Market Value Share and BPS Analysis by Country, 2025 and 2035
  • Figure 110: South Asia & Pacific Market Value Share and BPS Analysis by Material Type , 2025 and 2035
  • Figure 111: South Asia & Pacific Market Y-o-Y Growth Comparison by Material Type , 2025-2035
  • Figure 112: South Asia & Pacific Market Attractiveness Analysis by Material Type
  • Figure 113: South Asia & Pacific Market Value Share and BPS Analysis by Shape /Form, 2025 and 2035
  • Figure 114: South Asia & Pacific Market Y-o-Y Growth Comparison by Shape /Form, 2025-2035
  • Figure 115: South Asia & Pacific Market Attractiveness Analysis by Shape /Form
  • Figure 116: South Asia & Pacific Market Value Share and BPS Analysis by Application , 2025 and 2035
  • Figure 117: South Asia & Pacific Market Y-o-Y Growth Comparison by Application , 2025-2035
  • Figure 118: South Asia & Pacific Market Attractiveness Analysis by Application
  • Figure 119: South Asia & Pacific Market Value Share and BPS Analysis by End-Use Industry, 2025 and 2035
  • Figure 120: South Asia & Pacific Market Y-o-Y Growth Comparison by End-Use Industry, 2025-2035
  • Figure 121: South Asia & Pacific Market Attractiveness Analysis by End-Use Industry
  • Figure 122: South Asia & Pacific Market Value Share and BPS Analysis by Distribution Channel , 2025 and 2035
  • Figure 123: South Asia & Pacific Market Y-o-Y Growth Comparison by Distribution Channel , 2025-2035
  • Figure 124: South Asia & Pacific Market Attractiveness Analysis by Distribution Channel
  • Figure 125: Middle East and Africa Market Value Share and BPS Analysis by Country, 2025 and 2035
  • Figure 126: Middle East and Africa Market Value Share and BPS Analysis by Material Type , 2025 and 2035
  • Figure 127: Middle East and Africa Market Y-o-Y Growth Comparison by Material Type , 2025-2035
  • Figure 128: Middle East and Africa Market Attractiveness Analysis by Material Type
  • Figure 129: Middle East and Africa Market Value Share and BPS Analysis by Shape /Form, 2025 and 2035
  • Figure 130: Middle East and Africa Market Y-o-Y Growth Comparison by Shape /Form, 2025-2035
  • Figure 131: Middle East and Africa Market Attractiveness Analysis by Shape /Form
  • Figure 132: Middle East and Africa Market Value Share and BPS Analysis by Application , 2025 and 2035
  • Figure 133: Middle East and Africa Market Y-o-Y Growth Comparison by Application , 2025-2035
  • Figure 134: Middle East and Africa Market Attractiveness Analysis by Application
  • Figure 135: Middle East and Africa Market Value Share and BPS Analysis by End-Use Industry, 2025 and 2035
  • Figure 136: Middle East and Africa Market Y-o-Y Growth Comparison by End-Use Industry, 2025-2035
  • Figure 137: Middle East and Africa Market Attractiveness Analysis by End-Use Industry
  • Figure 138: Middle East and Africa Market Value Share and BPS Analysis by Distribution Channel , 2025 and 2035
  • Figure 139: Middle East and Africa Market Y-o-Y Growth Comparison by Distribution Channel , 2025-2035
  • Figure 140: Middle East and Africa Market Attractiveness Analysis by Distribution Channel
  • Figure 141: Global Market - Tier Structure Analysis
  • Figure 142: Global Market - Company Share Analysis

Frequently Asked Questions

What is the projected industry size of the thermocol box industry in 2025 and 2035?

The industry size is projected to be USD 1.8 billion in 2025 and USD 2.9 billion by 2035.

What is the expected CAGR for the thermocol box industry from 2025 to 2035?

The expected CAGR is 4.9% from 2025 to 2035.

Which material dominates the thermocol box market in 2025?

Expanded Polystyrene (EPS) is expected to dominate the material segment with a 62% industry share.

Who is the leading company in the thermocol box market?

Storopack Schweiz is the leading company in the market, holding 27-30% of the industry share.

What is the projected CAGR of the thermocol box industry in India?

India is expected to grow at a CAGR of 4.7% from 2025 to 2035.

Explore Similar Insights

Future Market Insights

Thermocol Box Market