Thermochromic Fabrics Market Size and Share Forecast Outlook 2025 to 2035

The thermochromic fabrics market is expected to grow from USD 314.5 million in 2025 to USD 552.7 million by 2035, reflecting a CAGR of 5.8% during the forecast period.
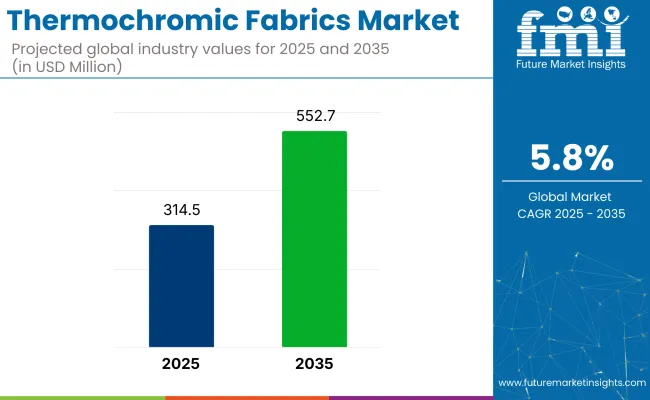
Quick Stats in Thermochromic Fabrics Market

  • Market Size (2025): USD 314.5 million
  • Market Forecast (2035): USD 552.7 million
  • CAGR (2025 to 2035): 5.8%
  • Fastest Growing Type Segment: Printed (30% share in 2025)
  • Leading End Use: Sports & Active Wear (15% share in 2025)
  • Key Growth Country: India (6.6% CAGR)

Thermochromic Fabrics Market

This upward trend is being supported by growing experimentation in fashion, functional textiles, and smart wearable technologies. Thermochromic textiles change color in response to temperature variations, offering a visual indication of thermal shifts, which is increasingly being leveraged in both creative and performance-driven applications.

As of 2025, the thermochromic fabrics market holds a niche but growing position within its broader parent markets. Within the global smart textiles market, it contributes approximately 4-6%, as color-changing fabrics are gaining traction in wearable technology and interactive clothing. In the functional apparel market, its share is around 2-3%, especially in activewear and children’s clothing designed for temperature awareness.

Within the textile chemicals market, thermochromic applications account for roughly 1-2%, since they represent a small subset of specialty pigments and coatings. In the fashion and sportswear market, it holds about 1-1.5%, where novelty and innovation drive limited but premium use cases. In the technical textiles market, the share stands at 2-3%, primarily in defense, medical, and safety applications.

Between 2020 and 2024, the thermochromic fabrics market saw rising consumption due to its integration into high-margin, limited-edition fashion lines by brands like Vollebak and The Unseen, which utilized microencapsulated leuco dyes for responsive color change. Unlike earlier novelty use, recent growth stemmed from activewear and climate-adaptive apparel, especially in North America and Northern Europe, where demand for garments responding to body heat and environmental changes intensified.

Key innovation came from UK-based fabric startups applying dual-temperature response systems that shift shades at both 27°C and 37°C, targeting both external and skin-contact triggers. From 2025 onward, demand is forecasted to pivot toward medical and defense textiles, with military R&D units in South Korea and Israel trialing thermochromic camouflage. Wearable diagnostics firms are incorporating thermochromic patches in wound dressings for non-invasive fever detection.

Analyzing Thermochromic Fabrics Market by Top Investment Segments

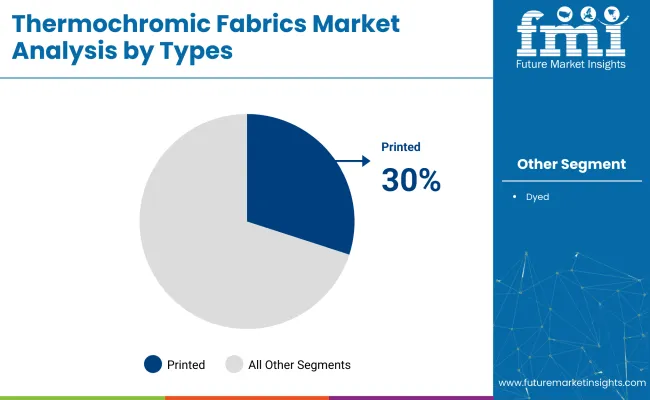
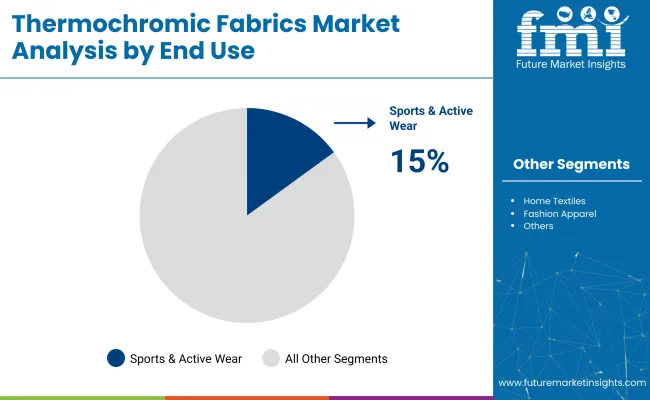
Cotton is projected to lead the substrate segment with a 25% market share by 2025, while printed thermochromic fabrics are expected to dominate the type segment with a 30% share. Sports and active wear will emerge as the leading end-use category, capturing 15% of the market, fueled by rising demand for smart textiles and temperature-responsive apparel.

Cotton to Lead the Substrate Segment with 25% Market Share

Cotton-based thermochromic fabrics are projected to account for 25% of the global substrate segment in 2025 due to their comfort, breathability, and dye compatibility.

  • Cotton-based thermochromic fabrics have been widely preferred in fashion and casual wear, offering dynamic color-changing effects when exposed to temperature shifts. Cotton's high moisture absorption supports consistent thermochromic performance in wearable applications.
  • Apparel designers have adopted cotton thermochromic fabrics to create interactive clothing that reacts to body heat or external climate. With consumer interest in novelty textiles growing, cotton remains a popular substrate for brands seeking both functionality and visual appeal.

Printed Thermochromic Fabrics to Dominate the Type Segment with 30% Market Share

Printed thermochromic fabrics are expected to command 30% of the type segment by 2025, driven by design flexibility and scalable production.
  • Printing techniques have been applied to integrate temperature-sensitive dyes onto various textiles, enabling rapid pattern shifts in response to environmental changes. This format has found strong uptake in lifestyle apparel and promotional clothing.
  • Designers favor printed methods for producing vibrant, reactive visuals at relatively low cost. As brands explore wearable tech and customization trends, printed thermochromic fabrics are being adopted across seasonal collections, limited editions, and interactive apparel lines.

Thermochromic Fabrics Market Analysis By Types

Sports & Active Wear to Lead the End Use Segment with 15% Market Share

Sports and active wear is projected to lead the end-use segment with a 15% market share by 2025, as thermochromic fabrics become more integrated into performance-focused apparel.
  • Sports & Active Wear have been used in athletic clothing to indicate temperature zones, moisture changes, or activity intensity, enhancing the wearer's awareness and engagement.
  • Sports brands have developed color-shifting gear that changes appearance based on exertion or ambient heat, combining style with functionality. The growing focus on fitness, personalization, and tech-enhanced performance is expected to drive increased adoption in this category over the coming years.

Thermochromic Fabrics Market Analysis By End Use

Top Thermochromic Fabrics Market Dynamics

The market is growing due to rising demand for color-changing textiles in fashion, sportswear, home décor, and medical applications. Innovation in microencapsulation and dye chemistry is driving product performance and expanding end-use opportunities.

Increasing Adoption in Fashion, Apparel, and Footwear

Fashion designers and sportswear brands are incorporating thermochromic fabrics to create interactive garments that change color with body heat or environmental temperature. These fabrics enhance visual appeal and offer a novel user experience. Activewear, jackets, and shoes featuring thermochromic elements are gaining traction among trend-driven consumers.

  • Used in clothing and accessories for dynamic, heat-reactive color changes.
  • Popular in sportswear and fashion for visual novelty and personalization.
  • Appealing to youth markets and tech-integrated fashion segments.

Material Innovation and Durability Improvements Supporting Growth

Research into more stable dyes and encapsulation methods is improving the colorfastness, wash resistance, and reusability of thermochromic fabrics. Manufacturers are developing fabrics that respond to narrow temperature ranges, allowing for customized applications. Smart textiles combining thermochromic properties with other sensors are also emerging in wearable technology.
  • Improved encapsulation methods enhance washability and longevity.
  • Narrow-range responsive fabrics allow tailored thermal sensitivity.
  • Smart fabrics with thermochromic features support wearable tech innovation.

Top Countries Producing, Printing, Innovating, and Driving Demand for Thermochromic Fabrics

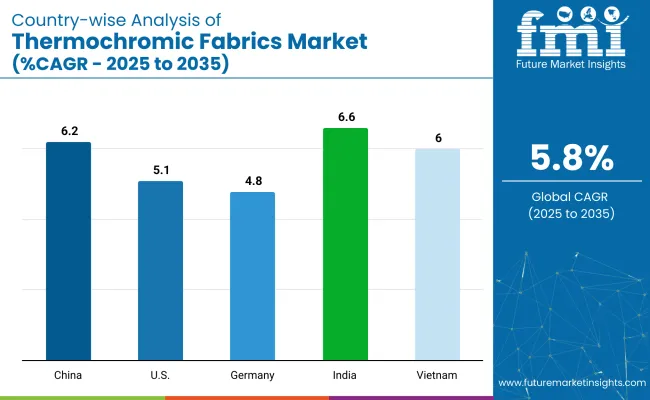
Country Wise Analysis Of Thermochromic Fabrics Market

Countries CAGR (2025 to 2035)
China 6.2%
USA 5.1%
Germany 4.8%
India 6.6%
Vietnam 6.0%

India’s momentum is being driven by textile digitization, smart garment exports, and low-cost pigment integration in domestic mills. China is advancing with high-speed digital textile printing and adoption in sportswear and functional fashion. In contrast, developed economies such as the United States (5.1%), Germany (4.8%), and Vietnam (6.0%) are expanding steadily at 0.73-0.97x the global rate.

The USA focuses on apparel personalization and wearable innovation. Germany is targeting automotive and interior textiles with heat-responsive functions. Vietnam leads in low-cost fashion exports using color-change designs. As the market becomes more design-centric, both functional and fashion-forward regions are shaping thermochromic textile evolution.

The report provides insights across 40+ countries. The five below are highlighted for their strategic influence and growth trajectory.

In-depth Analysis of Thermochromic Fabrics Market in India

Indian market is projected to grow at a CAGR of 6.6% through 2035. Domestic textile clusters are integrating color-changing pigments in casualwear and promotional apparel. Low-cost production and export orientation are attracting orders from European fashion startups and USA sportswear brands. Print-on-demand facilities in Gujarat and Tamil Nadu are leading development. Product use is also expanding in baby apparel and interactive learning accessories. India's pigment suppliers are creating heat-activated blends suitable for cotton and polyester substrates, supporting widespread adoption.

  • Color-change fabrics used in promotional and export garments
  • Print hubs in Gujarat and Coimbatore scaling pigment integration
  • Pigments tailored for high-volume cotton-polyester blends

Sales Analysis of Thermochromic Fabrics Market in China

China is expected to grow at a CAGR of 6.2% through 2035. High-speed digital printing units in Zhejiang and Jiangsu provinces are producing thermochromic fabrics for fast fashion and outerwear. Demand is rising in temperature-sensitive uniforms, wearable health indicators, and novelty-based fashion collections. Domestic chemical suppliers are scaling microencapsulated pigment production to serve apparel exporters. Advanced R&D centers are developing dual-tone and reversible shift fabrics. China's scale and speed advantage make it a key global supplier.

  • Sportswear and novelty wear lines using temperature-sensitive dyes
  • Pigment factories expanding in Zhejiang textile industrial zones
  • Dual-color change designs produced for global retailers

Demand Outlook for Thermochromic Fabrics Market in the United States

The USA market is projected to grow at a CAGR of 5.1% through 2035. Customized fashion, smart garments, and responsive children’s apparel are driving demand. Small-batch runs for streetwear and theme merchandise are incorporating color-shifting effects. R&D partnerships between universities and startups are advancing wearables that respond to skin temperature. Fabric printers are working with local designers to create unique thermally reactive collections. Growth is driven by personalization, sensory engagement, and tech-fashion convergence.

  • Used in small-batch smart fashion and tech-linked wearables
  • University-led R&D driving innovation in temperature-triggered designs
  • Responsive kidswear gaining traction in suburban markets

Opportunity Analysis of Thermochromic Fabrics Market in Germany

Germany is expected to grow at a CAGR of 4.8% through 2035. Functional textiles for car interiors, seating covers, and performance gear are being developed using heat-reactive dyes. Automotive suppliers are using thermochromic materials to improve visual safety and comfort perception. Textile labs are customizing dyes to fit EU environmental safety standards. Premium home textiles and luxury loungewear are also adopting subtle temperature-driven color shifts. Germany’s growth is rooted in performance engineering and sustainable textile chemistry.

  • Thermochromic dyes used in car seats and mobility textiles
  • EU-compliant dye formulations created for premium applications
  • Fabric tech firms integrating color-change into home décor lines

Growth Forecast for Thermochromic Fabrics Market in Vietnam

Vietnam’s market is projected to grow at a CAGR of 6.0% through 2035. Export-oriented garment units are adopting color-change prints for casualwear and children’s clothing. Global brands are sourcing from Vietnamese factories due to competitive pricing and rapid fulfillment. Thermochromic pigment application is expanding in print-on-demand t-shirts and summer activewear. Local dyeing houses are collaborating with Korean and Japanese pigment suppliers to develop stable blends for cotton knits. Vietnam’s position as a low-cost exporter supports fast-scale production.

  • Thermochromic t-shirts produced for USA and EU fashion chains
  • Knitwear factories applying pigments via rotary screen printing
  • OEM exporters partnering with foreign pigment innovators

Leading Thermochromic Fabrics Manufacturers

The thermochromic fabrics market is relatively niche and fragmented, with innovation-driven players focusing on smart textiles that change color with temperature variations. Shadow Shifter leads the market with patented heat-reactive dye technologies used in apparel and accessories.

Yunai Textile and WujiangTuoxin Textile Co., Ltd. offer customizable thermochromic fabrics for sportswear and fashion applications, primarily catering to the Asian and global B2B markets. Mook Fabrics and Kuler LLC are emerging players that supply specialty materials for craft, novelty clothing, and industrial use, emphasizing sustainability and responsiveness to environmental triggers. The market’s growth is fueled by rising demand for interactive clothing and advancements in microencapsulation dye techniques.

Leading Players in Thermochromic Fabrics Market

  • Shadow Shifter
  • Yunai Textile
  • Mook Fabrics
  • Kuler LLC
  • WujiangTuoxin Textile Co., Ltd.

Report Coverage and Scope Summary

Report Attributes Details
Market Size (2025) USD 314.5 million
Projected Market Size (2035) USD 552.7 million
CAGR (2025 to 2035) 5.8%
Base Year for Estimation 2024
Historical Period 2020 to 2024
Projections Period 2025 to 2035
Quantitative Units USD million for market value
Substrates Analyzed (Segment 1) Cotton, Polyester, Nylon, Synthetic Blends, Others
Types Analyzed (Segment 2) Dyed Fabric, Printed Fabric
End Uses Analyzed (Segment 3) Fashion Apparel, Sportswear & Activewear , Home Textiles, Industrial Applications, Others
Regions Covered North America, Latin America, Eastern Europe, Western Europe, South Asia & Pacific, East Asia, Middle East & Africa
Countries Covered United States, Canada, Germany, United Kingdom, France, Japan, China, India, South Korea, Brazil
Key Players Shadow Shifter, Yunai Textile, Mook Fabrics, Kuler LLC, Wujiang Tuoxin Textile Co., Ltd.
Additional Attributes Dollar sales by substrate and end use, expanding applications in a dynamic fashion and home décor, increasing preference for color-changing textiles, and R&D investments in responsive fabric technologies.

Thermochromic Fabrics Market Analyzed by Key Investment Segments

By Substrate:

The market is segmented by substrate into cotton, polyester, nylon, synthetic blends, and other fabric types.

By Type:

Based on type, the market is categorized into dyed fabric and printed fabric segments.

By End Use:

Key end-use industries include fashion apparel, sportswear and activewear, home textiles, industrial applications, and others.

By Region:

Geographically, the market spans North America, Latin America, Eastern Europe, Western Europe, South Asia & Pacific, East Asia, and the Middle East & Africa.

Table of Content

  1. Executive Summary
    • Global Market Outlook
    • Demand-side Trends
    • Supply-side Trends
    • Technology Roadmap Analysis
    • Analysis and Recommendations
  2. Market Overview
    • Market Coverage / Taxonomy
    • Market Definition / Scope / Limitations
  3. Market Background
    • Market Dynamics
      • Drivers
      • Restraints
      • Opportunity
      • Trends
    • Scenario Forecast
      • Demand in Optimistic Scenario
      • Demand in Likely Scenario
      • Demand in Conservative Scenario
    • Opportunity Map Analysis
    • Product Life Cycle Analysis
    • Supply Chain Analysis
      • Supply Side Participants and their Roles
        • Producers
        • Mid-Level Participants (Traders/ Agents/ Brokers)
        • Wholesalers and Distributors
      • Value Added and Value Created at Node in the Supply Chain
      • List of Raw Material Suppliers
      • List of Existing and Potential Buyer’s
    • Investment Feasibility Matrix
    • Value Chain Analysis
      • Profit Margin Analysis
      • Wholesalers and Distributors
      • Retailers
    • PESTLE and Porter’s Analysis
    • Regulatory Landscape
      • By Key Regions
      • By Key Countries
    • Regional Parent Market Outlook
    • Production and Consumption Statistics
    • Import and Export Statistics
  4. Global Market Analysis 2020 to 2024 and Forecast, 2025 to 2035
    • Historical Market Size Value (USD Million) & Volume (Metric tons) Analysis, 2020 to 2024
    • Current and Future Market Size Value (USD Million) & Volume (Metric tons) Projections, 2025 to 2035
      • Y-o-Y Growth Trend Analysis
      • Absolute $ Opportunity Analysis
  5. Global Market Pricing Analysis 2020 to 2024 and Forecast 2025 to 2035
  6. Global Market Analysis 2020 to 2024 and Forecast 2025 to 2035, By Substrate
    • Introduction / Key Findings
    • Historical Market Size Value (USD Million) & Volume (Metric tons) Analysis By Substrate, 2020 to 2024
    • Current and Future Market Size Value (USD Million) & Volume (Metric tons) Analysis and Forecast By Substrate, 2025 to 2035
      • Cotton
      • Polyester
      • Nylon
      • Synthetic Blends
      • Others
    • Y-o-Y Growth Trend Analysis By Substrate, 2020 to 2024
    • Absolute $ Opportunity Analysis By Substrate, 2025 to 2035
  7. Global Market Analysis 2020 to 2024 and Forecast 2025 to 2035, By Type
    • Introduction / Key Findings
    • Historical Market Size Value (USD Million) & Volume (Metric tons) Analysis By Type, 2020 to 2024
    • Current and Future Market Size Value (USD Million) & Volume (Metric tons) Analysis and Forecast By Type, 2025 to 2035
      • Dyed Fabric
      • Printed Fabric
    • Y-o-Y Growth Trend Analysis By Type, 2020 to 2024
    • Absolute $ Opportunity Analysis By Type, 2025 to 2035
  8. Global Market Analysis 2020 to 2024 and Forecast 2025 to 2035, By End Use
    • Introduction / Key Findings
    • Historical Market Size Value (USD Million) & Volume (Metric tons) Analysis By End Use, 2020 to 2024
    • Current and Future Market Size Value (USD Million) & Volume (Metric tons) Analysis and Forecast By End Use, 2025 to 2035
      • Fashion Apparel
      • Sportswear & Active wear
      • Home Textiles
      • Industrial
      • Others
    • Y-o-Y Growth Trend Analysis By End Use, 2020 to 2024
    • Absolute $ Opportunity Analysis By End Use, 2025 to 2035
  9. Global Market Analysis 2020 to 2024 and Forecast 2025 to 2035, By Region
    • Introduction
    • Historical Market Size Value (USD Million) & Volume (Metric tons) Analysis By Region, 2020 to 2024
    • Current Market Size Value (USD Million) & Volume (Metric tons) Analysis and Forecast By Region, 2025 to 2035
      • North America
      • Latin America
      • Western Europe
      • Eastern Europe
      • East Asia
      • South Asia & Pacific
      • Middle East and Africa
    • Market Attractiveness Analysis By Region
  10. North America Market Analysis 2020 to 2024 and Forecast 2025 to 2035, By Country
    • Historical Market Size Value (USD Million) & Volume (Metric tons) Trend Analysis By Market Taxonomy, 2020 to 2024
    • Market Size Value (USD Million) & Volume (Metric tons) Forecast By Market Taxonomy, 2025 to 2035
      • By Country
        • USA
        • Canada
        • Mexico
      • By Substrate
      • By Type
      • By End Use
    • Market Attractiveness Analysis
      • By Country
      • By Substrate
      • By Type
      • By End Use
    • Key Takeaways
  11. Latin America Market Analysis 2020 to 2024 and Forecast 2025 to 2035, By Country
    • Historical Market Size Value (USD Million) & Volume (Metric tons) Trend Analysis By Market Taxonomy, 2020 to 2024
    • Market Size Value (USD Million) & Volume (Metric tons) Forecast By Market Taxonomy, 2025 to 2035
      • By Country
        • Brazil
        • Argentina
        • Rest of LATAM
      • By Substrate
      • By Type
      • By End Use
    • Market Attractiveness Analysis
      • By Country
      • By Substrate
      • By Type
      • By End Use
    • Key Takeaways
  12. Western Europe Market Analysis 2020 to 2024 and Forecast 2025 to 2035, By Country
    • Historical Market Size Value (USD Million) & Volume (Metric tons) Trend Analysis By Market Taxonomy, 2020 to 2024
    • Market Size Value (USD Million) & Volume (Metric tons) Forecast By Market Taxonomy, 2025 to 2035
      • By Country
        • Germany
        • Italy
        • France
        • UK
        • Spain
        • BENELUX
        • Nordic
        • Rest of W.Europe
      • By Substrate
      • By Type
      • By End Use
    • Market Attractiveness Analysis
      • By Country
      • By Substrate
      • By Type
      • By End Use
    • Key Takeaways
  13. Eastern Europe Market Analysis 2020 to 2024 and Forecast 2025 to 2035, By Country
    • Historical Market Size Value (USD Million) & Volume (Metric tons) Trend Analysis By Market Taxonomy, 2020 to 2024
    • Market Size Value (USD Million) & Volume (Metric tons) Forecast By Market Taxonomy, 2025 to 2035
      • By Country
        • Russia
        • Hungary
        • Poland
        • Balkan & Baltics
        • Rest of E. Europe
      • By Substrate
      • By Type
      • By End Use
    • Market Attractiveness Analysis
      • By Country
      • By Substrate
      • By Type
      • By End Use
    • Key Takeaways
  14. East Asia Market Analysis 2020 to 2024 and Forecast 2025 to 2035, By Country
    • Historical Market Size Value (USD Million) & Volume (Metric tons) Trend Analysis By Market Taxonomy, 2020 to 2024
    • Market Size Value (USD Million) & Volume (Metric tons) Forecast By Market Taxonomy, 2025 to 2035
      • By Country
        • China
        • Japan
        • South Korea
      • By Substrate
      • By Type
      • By End Use
    • Market Attractiveness Analysis
      • By Country
      • By Substrate
      • By Type
      • By End Use
    • Key Takeaways
  15. South Asia & Pacific Market Analysis 2020 to 2024 and Forecast 2025 to 2035, By Country
    • Historical Market Size Value (USD Million) & Volume (Metric tons) Trend Analysis By Market Taxonomy, 2020 to 2024
    • Market Size Value (USD Million) & Volume (Metric tons) Forecast By Market Taxonomy, 2025 to 2035
      • By Country
        • India
        • Australia & New Zealand
        • ASEAN
        • Rest of SAP
      • By Substrate
      • By Type
      • By End Use
    • Market Attractiveness Analysis
      • By Country
      • By Substrate
      • By Type
      • By End Use
    • Key Takeaways
  16. Middle East and Africa Market Analysis 2020 to 2024 and Forecast 2025 to 2035, By Country
    • Historical Market Size Value (USD Million) & Volume (Metric tons) Trend Analysis By Market Taxonomy, 2020 to 2024
    • Market Size Value (USD Million) & Volume (Metric tons) Forecast By Market Taxonomy, 2025 to 2035
      • By Country
        • GCC Countries
        • Northern Africa
        • South Africa
        • Turkiye
        • Rest of MEA
      • By Substrate
      • By Type
      • By End Use
    • Market Attractiveness Analysis
      • By Country
      • By Substrate
      • By Type
      • By End Use
    • Key Takeaways
  17. Key Countries Market Analysis
    • USA
      • Pricing Analysis
      • Market Share Analysis, 2024
        • By Substrate
        • By Type
        • By End Use
    • Canada
      • Pricing Analysis
      • Market Share Analysis, 2024
        • By Substrate
        • By Type
        • By End Use
    • Brazil
      • Pricing Analysis
      • Market Share Analysis, 2024
        • By Substrate
        • By Type
        • By End Use
    • Mexico
      • Pricing Analysis
      • Market Share Analysis, 2024
        • By Substrate
        • By Type
        • By End Use
    • Argentina
      • Pricing Analysis
      • Market Share Analysis, 2024
        • By Substrate
        • By Type
        • By End Use
  18. Market Structure Analysis
    • Competition Dashboard
    • Competition Benchmarking
    • Market Share Analysis of Top Players
      • By Regional
      • By Substrate
      • By Type
      • By End Use
  19. Competition Analysis
    • Competition Deep Dive
      • Shadow Shifter
        • Overview
        • Product Portfolio
        • Profitability by Market Segments (Product/Age /Sales Channel/Region)
        • Sales Footprint
        • Strategy Overview
          • Marketing Strategy
          • Product Strategy
          • Channel Strategy
      • Yunai Textile
        • Overview
        • Product Portfolio
        • Profitability by Market Segments (Product/Age /Sales Channel/Region)
        • Sales Footprint
        • Strategy Overview
          • Marketing Strategy
          • Product Strategy
          • Channel Strategy
      • Mook Fabrics
        • Overview
        • Product Portfolio
        • Profitability by Market Segments (Product/Age /Sales Channel/Region)
        • Sales Footprint
        • Strategy Overview
          • Marketing Strategy
          • Product Strategy
          • Channel Strategy
      • Kuler LLC
        • Overview
        • Product Portfolio
        • Profitability by Market Segments (Product/Age /Sales Channel/Region)
        • Sales Footprint
        • Strategy Overview
          • Marketing Strategy
          • Product Strategy
          • Channel Strategy
      • Wujiang Tuoxin Textile Co., Ltd.
        • Overview
        • Product Portfolio
        • Profitability by Market Segments (Product/Age /Sales Channel/Region)
        • Sales Footprint
        • Strategy Overview
          • Marketing Strategy
          • Product Strategy
          • Channel Strategy
  20. Assumptions & Acronyms Used
  21. Research Methodology

List of Tables

  • Table 1: Global Market Value (USD Million) Forecast by Region, 2020 to 2035
  • Table 2: Global Market Volume (Metric tons) Forecast by Region, 2020 to 2035
  • Table 3: Global Market Value (USD Million) Forecast by Substrate, 2020 to 2035
  • Table 4: Global Market Volume (Metric tons) Forecast by Substrate, 2020 to 2035
  • Table 5: Global Market Value (USD Million) Forecast by Type, 2020 to 2035
  • Table 6: Global Market Volume (Metric tons) Forecast by Type, 2020 to 2035
  • Table 7: Global Market Value (USD Million) Forecast by End Use, 2020 to 2035
  • Table 8: Global Market Volume (Metric tons) Forecast by End Use, 2020 to 2035
  • Table 9: North America Market Value (USD Million) Forecast by Country, 2020 to 2035
  • Table 10: North America Market Volume (Metric tons) Forecast by Country, 2020 to 2035
  • Table 11: North America Market Value (USD Million) Forecast by Substrate, 2020 to 2035
  • Table 12: North America Market Volume (Metric tons) Forecast by Substrate, 2020 to 2035
  • Table 13: North America Market Value (USD Million) Forecast by Type, 2020 to 2035
  • Table 14: North America Market Volume (Metric tons) Forecast by Type, 2020 to 2035
  • Table 15: North America Market Value (USD Million) Forecast by End Use, 2020 to 2035
  • Table 16: North America Market Volume (Metric tons) Forecast by End Use, 2020 to 2035
  • Table 17: Latin America Market Value (USD Million) Forecast by Country, 2020 to 2035
  • Table 18: Latin America Market Volume (Metric tons) Forecast by Country, 2020 to 2035
  • Table 19: Latin America Market Value (USD Million) Forecast by Substrate, 2020 to 2035
  • Table 20: Latin America Market Volume (Metric tons) Forecast by Substrate, 2020 to 2035
  • Table 21: Latin America Market Value (USD Million) Forecast by Type, 2020 to 2035
  • Table 22: Latin America Market Volume (Metric tons) Forecast by Type, 2020 to 2035
  • Table 23: Latin America Market Value (USD Million) Forecast by End Use, 2020 to 2035
  • Table 24: Latin America Market Volume (Metric tons) Forecast by End Use, 2020 to 2035
  • Table 25: Western Europe Market Value (USD Million) Forecast by Country, 2020 to 2035
  • Table 26: Western Europe Market Volume (Metric tons) Forecast by Country, 2020 to 2035
  • Table 27: Western Europe Market Value (USD Million) Forecast by Substrate, 2020 to 2035
  • Table 28: Western Europe Market Volume (Metric tons) Forecast by Substrate, 2020 to 2035
  • Table 29: Western Europe Market Value (USD Million) Forecast by Type, 2020 to 2035
  • Table 30: Western Europe Market Volume (Metric tons) Forecast by Type, 2020 to 2035
  • Table 31: Western Europe Market Value (USD Million) Forecast by End Use, 2020 to 2035
  • Table 32: Western Europe Market Volume (Metric tons) Forecast by End Use, 2020 to 2035
  • Table 33: Eastern Europe Market Value (USD Million) Forecast by Country, 2020 to 2035
  • Table 34: Eastern Europe Market Volume (Metric tons) Forecast by Country, 2020 to 2035
  • Table 35: Eastern Europe Market Value (USD Million) Forecast by Substrate, 2020 to 2035
  • Table 36: Eastern Europe Market Volume (Metric tons) Forecast by Substrate, 2020 to 2035
  • Table 37: Eastern Europe Market Value (USD Million) Forecast by Type, 2020 to 2035
  • Table 38: Eastern Europe Market Volume (Metric tons) Forecast by Type, 2020 to 2035
  • Table 39: Eastern Europe Market Value (USD Million) Forecast by End Use, 2020 to 2035
  • Table 40: Eastern Europe Market Volume (Metric tons) Forecast by End Use, 2020 to 2035
  • Table 41: East Asia Market Value (USD Million) Forecast by Country, 2020 to 2035
  • Table 42: East Asia Market Volume (Metric tons) Forecast by Country, 2020 to 2035
  • Table 43: East Asia Market Value (USD Million) Forecast by Substrate, 2020 to 2035
  • Table 44: East Asia Market Volume (Metric tons) Forecast by Substrate, 2020 to 2035
  • Table 45: East Asia Market Value (USD Million) Forecast by Type, 2020 to 2035
  • Table 46: East Asia Market Volume (Metric tons) Forecast by Type, 2020 to 2035
  • Table 47: East Asia Market Value (USD Million) Forecast by End Use, 2020 to 2035
  • Table 48: East Asia Market Volume (Metric tons) Forecast by End Use, 2020 to 2035
  • Table 49: South Asia & Pacific Market Value (USD Million) Forecast by Country, 2020 to 2035
  • Table 50: South Asia & Pacific Market Volume (Metric tons) Forecast by Country, 2020 to 2035
  • Table 51: South Asia & Pacific Market Value (USD Million) Forecast by Substrate, 2020 to 2035
  • Table 52: South Asia & Pacific Market Volume (Metric tons) Forecast by Substrate, 2020 to 2035
  • Table 53: South Asia & Pacific Market Value (USD Million) Forecast by Type, 2020 to 2035
  • Table 54: South Asia & Pacific Market Volume (Metric tons) Forecast by Type, 2020 to 2035
  • Table 55: South Asia & Pacific Market Value (USD Million) Forecast by End Use, 2020 to 2035
  • Table 56: South Asia & Pacific Market Volume (Metric tons) Forecast by End Use, 2020 to 2035
  • Table 57: Middle East and Africa Market Value (USD Million) Forecast by Country, 2020 to 2035
  • Table 58: Middle East and Africa Market Volume (Metric tons) Forecast by Country, 2020 to 2035
  • Table 59: Middle East and Africa Market Value (USD Million) Forecast by Substrate, 2020 to 2035
  • Table 60: Middle East and Africa Market Volume (Metric tons) Forecast by Substrate, 2020 to 2035
  • Table 61: Middle East and Africa Market Value (USD Million) Forecast by Type, 2020 to 2035
  • Table 62: Middle East and Africa Market Volume (Metric tons) Forecast by Type, 2020 to 2035
  • Table 63: Middle East and Africa Market Value (USD Million) Forecast by End Use, 2020 to 2035
  • Table 64: Middle East and Africa Market Volume (Metric tons) Forecast by End Use, 2020 to 2035

List of Figures

  • Figure 1: Global Market Volume (Metric tons) Forecast 2020 to 2035
  • Figure 2: Global Market Pricing Analysis
  • Figure 3: Global Market Value (USD Million) Forecast 2020 to 2035
  • Figure 4: Global Market Value Share and BPS Analysis by Substrate, 2025 and 2035
  • Figure 5: Global Market Y-o-Y Growth Comparison by Substrate, 2025 to 2035
  • Figure 6: Global Market Attractiveness Analysis by Substrate
  • Figure 7: Global Market Value Share and BPS Analysis by Type, 2025 and 2035
  • Figure 8: Global Market Y-o-Y Growth Comparison by Type, 2025 to 2035
  • Figure 9: Global Market Attractiveness Analysis by Type
  • Figure 10: Global Market Value Share and BPS Analysis by End Use, 2025 and 2035
  • Figure 11: Global Market Y-o-Y Growth Comparison by End Use, 2025 to 2035
  • Figure 12: Global Market Attractiveness Analysis by End Use
  • Figure 13: Global Market Value (USD Million) Share and BPS Analysis by Region, 2025 and 2035
  • Figure 14: Global Market Y-o-Y Growth Comparison by Region, 2025 to 2035
  • Figure 15: Global Market Attractiveness Analysis by Region
  • Figure 16: North America Market Incremental $ Opportunity, 2025 to 2035
  • Figure 17: Latin America Market Incremental $ Opportunity, 2025 to 2035
  • Figure 18: Western Europe Market Incremental $ Opportunity, 2025 to 2035
  • Figure 19: Eastern Europe Market Incremental $ Opportunity, 2025 to 2035
  • Figure 20: East Asia Market Incremental $ Opportunity, 2025 to 2035
  • Figure 21: South Asia & Pacific Market Incremental $ Opportunity, 2025 to 2035
  • Figure 22: Middle East and Africa Market Incremental $ Opportunity, 2025 to 2035
  • Figure 23: North America Market Value Share and BPS Analysis by Country, 2025 and 2035
  • Figure 24: North America Market Value Share and BPS Analysis by Substrate, 2025 and 2035
  • Figure 25: North America Market Y-o-Y Growth Comparison by Substrate, 2025 to 2035
  • Figure 26: North America Market Attractiveness Analysis by Substrate
  • Figure 27: North America Market Value Share and BPS Analysis by Type, 2025 and 2035
  • Figure 28: North America Market Y-o-Y Growth Comparison by Type, 2025 to 2035
  • Figure 29: North America Market Attractiveness Analysis by Type
  • Figure 30: North America Market Value Share and BPS Analysis by End Use, 2025 and 2035
  • Figure 31: North America Market Y-o-Y Growth Comparison by End Use, 2025 to 2035
  • Figure 32: North America Market Attractiveness Analysis by End Use
  • Figure 33: Latin America Market Value Share and BPS Analysis by Country, 2025 and 2035
  • Figure 34: Latin America Market Value Share and BPS Analysis by Substrate, 2025 and 2035
  • Figure 35: Latin America Market Y-o-Y Growth Comparison by Substrate, 2025 to 2035
  • Figure 36: Latin America Market Attractiveness Analysis by Substrate
  • Figure 37: Latin America Market Value Share and BPS Analysis by Type, 2025 and 2035
  • Figure 38: Latin America Market Y-o-Y Growth Comparison by Type, 2025 to 2035
  • Figure 39: Latin America Market Attractiveness Analysis by Type
  • Figure 40: Latin America Market Value Share and BPS Analysis by End Use, 2025 and 2035
  • Figure 41: Latin America Market Y-o-Y Growth Comparison by End Use, 2025 to 2035
  • Figure 42: Latin America Market Attractiveness Analysis by End Use
  • Figure 43: Western Europe Market Value Share and BPS Analysis by Country, 2025 and 2035
  • Figure 44: Western Europe Market Value Share and BPS Analysis by Substrate, 2025 and 2035
  • Figure 45: Western Europe Market Y-o-Y Growth Comparison by Substrate, 2025 to 2035
  • Figure 46: Western Europe Market Attractiveness Analysis by Substrate
  • Figure 47: Western Europe Market Value Share and BPS Analysis by Type, 2025 and 2035
  • Figure 48: Western Europe Market Y-o-Y Growth Comparison by Type, 2025 to 2035
  • Figure 49: Western Europe Market Attractiveness Analysis by Type
  • Figure 50: Western Europe Market Value Share and BPS Analysis by End Use, 2025 and 2035
  • Figure 51: Western Europe Market Y-o-Y Growth Comparison by End Use, 2025 to 2035
  • Figure 52: Western Europe Market Attractiveness Analysis by End Use
  • Figure 53: Eastern Europe Market Value Share and BPS Analysis by Country, 2025 and 2035
  • Figure 54: Eastern Europe Market Value Share and BPS Analysis by Substrate, 2025 and 2035
  • Figure 55: Eastern Europe Market Y-o-Y Growth Comparison by Substrate, 2025 to 2035
  • Figure 56: Eastern Europe Market Attractiveness Analysis by Substrate
  • Figure 57: Eastern Europe Market Value Share and BPS Analysis by Type, 2025 and 2035
  • Figure 58: Eastern Europe Market Y-o-Y Growth Comparison by Type, 2025 to 2035
  • Figure 59: Eastern Europe Market Attractiveness Analysis by Type
  • Figure 60: Eastern Europe Market Value Share and BPS Analysis by End Use, 2025 and 2035
  • Figure 61: Eastern Europe Market Y-o-Y Growth Comparison by End Use, 2025 to 2035
  • Figure 62: Eastern Europe Market Attractiveness Analysis by End Use
  • Figure 63: East Asia Market Value Share and BPS Analysis by Country, 2025 and 2035
  • Figure 64: East Asia Market Value Share and BPS Analysis by Substrate, 2025 and 2035
  • Figure 65: East Asia Market Y-o-Y Growth Comparison by Substrate, 2025 to 2035
  • Figure 66: East Asia Market Attractiveness Analysis by Substrate
  • Figure 67: East Asia Market Value Share and BPS Analysis by Type, 2025 and 2035
  • Figure 68: East Asia Market Y-o-Y Growth Comparison by Type, 2025 to 2035
  • Figure 69: East Asia Market Attractiveness Analysis by Type
  • Figure 70: East Asia Market Value Share and BPS Analysis by End Use, 2025 and 2035
  • Figure 71: East Asia Market Y-o-Y Growth Comparison by End Use, 2025 to 2035
  • Figure 72: East Asia Market Attractiveness Analysis by End Use
  • Figure 73: South Asia & Pacific Market Value Share and BPS Analysis by Country, 2025 and 2035
  • Figure 74: South Asia & Pacific Market Value Share and BPS Analysis by Substrate, 2025 and 2035
  • Figure 75: South Asia & Pacific Market Y-o-Y Growth Comparison by Substrate, 2025 to 2035
  • Figure 76: South Asia & Pacific Market Attractiveness Analysis by Substrate
  • Figure 77: South Asia & Pacific Market Value Share and BPS Analysis by Type, 2025 and 2035
  • Figure 78: South Asia & Pacific Market Y-o-Y Growth Comparison by Type, 2025 to 2035
  • Figure 79: South Asia & Pacific Market Attractiveness Analysis by Type
  • Figure 80: South Asia & Pacific Market Value Share and BPS Analysis by End Use, 2025 and 2035
  • Figure 81: South Asia & Pacific Market Y-o-Y Growth Comparison by End Use, 2025 to 2035
  • Figure 82: South Asia & Pacific Market Attractiveness Analysis by End Use
  • Figure 83: Middle East and Africa Market Value Share and BPS Analysis by Country, 2025 and 2035
  • Figure 84: Middle East and Africa Market Value Share and BPS Analysis by Substrate, 2025 and 2035
  • Figure 85: Middle East and Africa Market Y-o-Y Growth Comparison by Substrate, 2025 to 2035
  • Figure 86: Middle East and Africa Market Attractiveness Analysis by Substrate
  • Figure 87: Middle East and Africa Market Value Share and BPS Analysis by Type, 2025 and 2035
  • Figure 88: Middle East and Africa Market Y-o-Y Growth Comparison by Type, 2025 to 2035
  • Figure 89: Middle East and Africa Market Attractiveness Analysis by Type
  • Figure 90: Middle East and Africa Market Value Share and BPS Analysis by End Use, 2025 and 2035
  • Figure 91: Middle East and Africa Market Y-o-Y Growth Comparison by End Use, 2025 to 2035
  • Figure 92: Middle East and Africa Market Attractiveness Analysis by End Use
  • Figure 93: Global Market - Tier Structure Analysis
  • Figure 94: Global Market - Company Share Analysis

Frequently Asked Questions

What is the current valuation of the thermochromic fabrics market?

The market is estimated to be valued at USD 314.5 million in 2025.

What is the projected size of the thermochromic fabrics market by 2035?

The market is expected to reach USD 552.7 million by 2035.

What is the expected CAGR for the thermochromic fabrics market between 2025 and 2035?

The market is projected to grow at a CAGR of 5.8% from 2025 to 2035.

Which type segment is expected to hold the highest market share?

Printed thermochromic fabrics are projected to dominate with a 30% market share in 2025.

Which end-use segment accounts for the largest share of the market?

Sports and active wear is expected to lead the end-use segment with a 15% share in 2025.

Explore Similar Insights

Future Market Insights

Thermochromic Fabrics Market