The thermoformed containers market is valued at USD 12,847 million in 2025 and is expected to reach USD 23,225 million by 2035, expanding at a 6.1% CAGR as demand accelerates for lightweight, cost-effective, and high-clarity packaging solutions across food service, retail, pharmaceutical, and consumer goods sectors. Growth is driven by the global rise of convenience foods, the expansion of quick-service restaurants, and the increasing adoption of protective packaging formats that enhance hygiene and shelf-life performance. Polystyrene, accounting for 46% of the market, dominates due to insulation excellence and cost-efficient thermoforming, while food packaging, retaining 51% share, remains the largest application as restaurants, supermarkets, and delivery platforms scale up single-serve and ready-meal formats.
Regionally, China (7.2% CAGR) and India (6.9%) lead growth due to rapid food service modernization, while the USA, Germany, and Japan sustain steady expansion through regulatory-driven food safety compliance, automated filling systems, and adoption of premium barrier containers. Competitive intensity remains moderate, with Pactiv LLC, Dart Container Corporation, Amcor plc, Berry Global Inc., and Anchor Packaging strengthening market positions through advancements in multi-layer barrier technologies, anti-fog clarity enhancements, and integration of thermoformed containers with high-speed production and sealing systems.
A major dynamic supporting market expansion is the accelerating demand for packaged and ready-to-eat food products. Thermoformed trays, clamshells, bowls, lids, and compartment containers are widely used for bakery items, fruits and vegetables, snacks, deli foods, meat and poultry, confectionery, and meal kits. Their rigid form, stackability, and ability to maintain structural integrity during transport make them ideal for modern food retail. As convenience-driven consumption grows and foodservice operators expand takeout and delivery operations, thermoformed containers remain a preferred choice due to their ease of sealing, heat resistance (for select grades), and compatibility with automated filling lines.
The rapid expansion of supermarkets, hypermarkets, and e-commerce grocery platforms further reinforces demand. Retailers rely on thermoformed containers to enhance product display, improve shelf organization, and extend the shelf life of fresh produce through modified-atmosphere compatible formats. Their clarity and tamper-resistant design help consumers evaluate product quality, supporting higher sales conversion at point-of-purchase. As global grocery distribution networks evolve, demand for robust and visually appealing packaging continues to increase.v
Product innovation continues to transform the competitive landscape. Manufacturers are developing containers with enhanced rigidity, improved barrier properties, advanced ribbing structures for strength optimization, and thermoformed lids compatible with high-speed sealing machinery. Multilayer constructions enhance oxygen and moisture resistance for perishable foods, while advancements in material engineering improve heat tolerance, forming performance, and clarity.
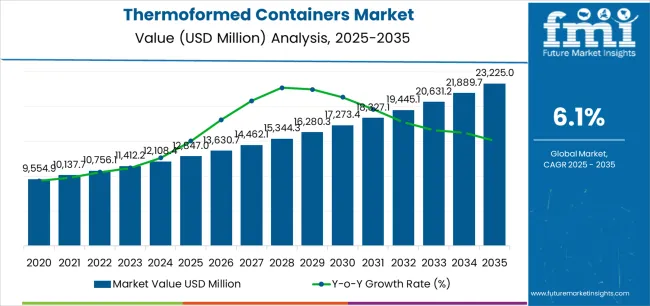
The thermoformed containers market demonstrates distinct growth phases with varying market characteristics and competitive dynamics. Between 2025 and 2030, the market progresses through its convenience packaging adoption phase, expanding from USD 12,847 million to USD 16,742 million with steady annual increments averaging 5.4% growth. This period showcases the transition from basic foam containers to advanced systems with enhanced barrier properties and integrated tamper-evident features becoming mainstream characteristics.
The 2025 to 2030 phase adds USD 3,895 million to market value, representing 38% of total decade expansion. Market maturation factors include standardization of container specifications, declining material costs for specialty polymers, and increasing retailer awareness of thermoforming benefits reaching 72-78% effectiveness in food packaging applications.
Competitive landscape evolution during this period features established manufacturers like Pactiv and Dart Container expanding their product portfolios while new entrants focus on specialized barrier solutions and enhanced stackability technology.
From 2030 to 2035, market dynamics shift toward advanced customization and multi-sector deployment, with growth accelerating from USD 16,742 million to USD 23,225 million, adding USD 6,422 million or 62% of total expansion.
This phase transition logic centers on universal container systems, integration with automated filling equipment, and deployment across diverse application scenarios, becoming standard rather than specialized packaging formats. The competitive environment matures with focus shifting from basic material quality to comprehensive barrier performance and compatibility with high-speed production operations.
The market demonstrates strong fundamentals with polystyrene systems capturing a dominant share through superior insulation properties and cost-effective manufacturing capabilities. Food packaging applications drive primary demand, supported by increasing convenience food consumption and food safety management solutions.
Geographic expansion remains concentrated in developed markets with established retail infrastructure, while emerging economies show accelerating adoption rates driven by quick-service restaurant expansion and rising disposable income levels.
At-a-Glance Metrics
| Metric | Value |
|---|---|
| Market Value (2025) | USD 12,847 million |
| Market Forecast (2035) | USD 23,225 million |
| Growth Rate | 6.1% CAGR |
| Leading Material Type | Polystyrene |
| Primary Application | Food Packaging Segment |
Market expansion rests on three fundamental shifts driving adoption across food service and retail sectors. Convenience consumption creates compelling advantages through thermoformed container systems that provide comprehensive food protection with lightweight portability, enabling restaurants to deliver meals safely while maintaining food quality and justifying investment over traditional rigid packaging.
Retail modernization accelerates as grocery operations worldwide seek efficient packaging systems that deliver product visibility directly to consumers, enabling merchandise presentation that aligns with food safety standards and minimizes handling requirements
Food safety regulations drive adoption from operators requiring protective packaging solutions that maximize contamination prevention while maintaining temperature control during storage and transportation operations.
However, growth faces headwinds from recycling infrastructure limitations that differ across municipalities regarding material acceptance and processing capabilities, potentially limiting adoption in markets with demanding waste management standards. Material perception also persists regarding environmental concerns and disposal management that may increase operational complexity in regions with restrictive single-use packaging regulations.
The thermoformed containers market represents a compelling intersection of packaging innovation, food safety enhancement, and convenience management. With robust growth projected from USD 12,847 million in 2025 to USD 23,225 million by 2035 at a 6.1% CAGR, this market is driven by increasing food service industry trends, retail convenience requirements, and commercial demand for lightweight packaging formats.
The market's expansion reflects a fundamental shift in how retailers and food service operators approach packaging infrastructure. Strong growth opportunities exist across diverse applications, from restaurant operations requiring takeout containers to retail facilities demanding fresh food packaging solutions. Geographic expansion is particularly pronounced in Asia-Pacific markets, led by China (7.2% CAGR) and India (6.9% CAGR), while established markets in North America and Europe drive innovation and specialized segment development.
The dominance of polystyrene systems and food packaging applications underscores the importance of proven insulation technology and barrier protection in driving adoption. Material recyclability and contamination management remain key challenges, creating opportunities for companies that can deliver reliable performance while maintaining operational efficiency.
Primary Classification: The market segments by material type into polystyrene, polypropylene, polyethylene terephthalate (PET), polyvinyl chloride (PVC), and other categories, representing the evolution from basic foam packaging to advanced polymer systems for comprehensive food protection operations.
Secondary Breakdown: Application segmentation divides the market into food packaging, pharmaceutical packaging, electronics packaging, industrial packaging, consumer goods, and others sectors, reflecting distinct requirements for barrier properties, clarity, and temperature resistance.
Regional Classification: Geographic distribution covers North America, Europe, Asia Pacific, Latin America, and the Middle East & Africa, with developed markets leading innovation while emerging economies show accelerating growth patterns driven by food service expansion programs.
The segmentation structure reveals technology progression from standard polystyrene containers toward integrated multi-material platforms with enhanced barrier and protective capabilities, while application diversity spans from food service operations to pharmaceutical facilities requiring comprehensive product protection and long-term preservation solutions.
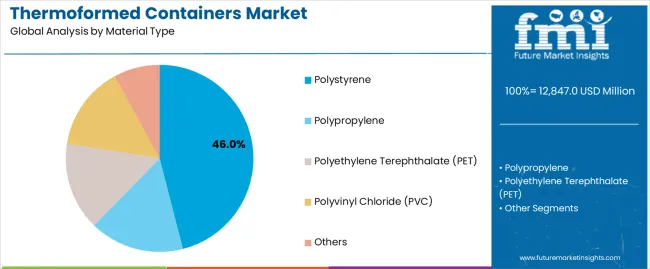
Polystyrene segment is estimated to account for 46% of the thermoformed containers market share in 2025. The segment's leading position stems from its fundamental role as a critical component in food service applications and its extensive use across multiple restaurant and retail sectors. Polystyrene's dominance is attributed to its superior insulation flexibility, including thermal retention, cushioning properties, and cost-effective manufacturing that make it indispensable for hot and cold food packaging operations.
Market Position: Polystyrene systems command the leading position in the thermoformed containers market through advanced extrusion technologies, including comprehensive density options, thickness versatility, and reliable forming performance that enable manufacturers to deploy packaging solutions across diverse application environments.
Value Drivers: The segment benefits from food service preference for proven foam materials that provide exceptional insulation without requiring specialized handling equipment. Cost-effective manufacturing processes enable deployment in takeout containers, clamshell packaging, and portion cups where thermal performance and affordability represent critical selection requirements.
Competitive Advantages: Polystyrene systems differentiate through excellent temperature retention, proven lightweight durability, and compatibility with standard sealing systems that enhance food protection capabilities while maintaining economical operational profiles suitable for diverse food service applications.
Key market characteristics:
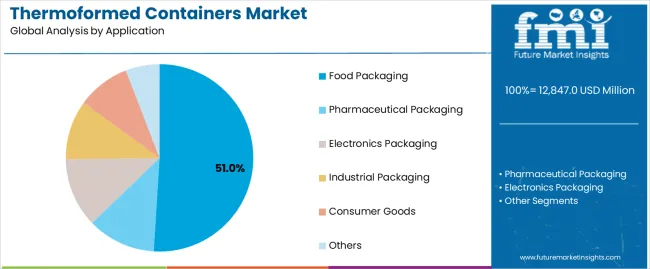
Food packaging segment is projected to hold 51% of the thermoformed containers market share in 2025. The segment's market leadership is driven by the extensive use of thermoformed containers in restaurant takeout, deli counters, fresh produce display, and prepared meal packaging, where containers serve as both a protective barrier and convenience tool. The food service industry's consistent investment in disposable packaging materials supports the segment's dominant position.
Market Context: Food packaging applications dominate the market due to widespread adoption of single-use container materials and increasing focus on food safety management, convenience delivery, and temperature-resistant applications that enhance operational efficiency while maintaining product quality.
Appeal Factors: Food service companies prioritize thermal insulation, leak resistance, and integration with kitchen workflows that enable coordinated packaging across multiple service formats. The segment benefits from substantial hygiene requirements and food safety standards that emphasize reliable containers for hot and cold food applications.
Growth Drivers: Quick-service restaurant expansion programs incorporate thermoformed containers as standard packaging for takeout meals and delivery services. At the same time, food retail initiatives are increasing demand for fresh food packaging systems that comply with food safety standards and enhance product presentation.
Market Challenges: Material disposal concerns and recycling infrastructure limitations may impact adoption flexibility in environmentally-conscious markets or municipalities with restrictive packaging regulations.
Application dynamics include:
Growth Accelerators: Food service expansion drives primary adoption as thermoformed container systems provide exceptional protective capabilities that enable food preservation without excessive material investment, supporting meal quality and operational efficiency that require convenient packaging formats. Convenience demand accelerates market growth as consumers seek ready-to-eat solutions that maintain food freshness during transport while enhancing portability through lightweight container designs. Urbanization increases worldwide, creating sustained demand for takeout packaging systems that complement restaurant operations and provide competitive advantages in food delivery services.
Growth Inhibitors: Recycling infrastructure challenges differ across municipalities regarding material acceptance and processing specifications, which may limit market penetration and adoption in environmentally-conscious categories with demanding waste management requirements. Material cost volatility persists regarding petroleum-based resin pricing and supply chain disruptions that may increase production costs in large-scale operations with tight margin specifications. Market competition from alternative packaging types and reusable container programs creates adoption concerns between different packaging formats and existing food service infrastructure.
Market Evolution Patterns: Adoption accelerates in food service and retail sectors where convenience packaging justifies material investments, with geographic concentration in developed markets transitioning toward mainstream adoption in emerging economies driven by restaurant expansion and retail modernization. Technology development focuses on enhanced barrier properties, improved clarity performance, and integration with automated filling systems that optimize food protection and operational efficiency. The market could face disruption if alternative packaging materials or technology innovations significantly challenge thermoformed container advantages in food service applications.
| Country | CAGR (2025 to 2035) |
|---|---|
| China | 7.2% |
| India | 6.9% |
| USA | 6.5% |
| Germany | 5.8% |
| Japan | 5.55 |
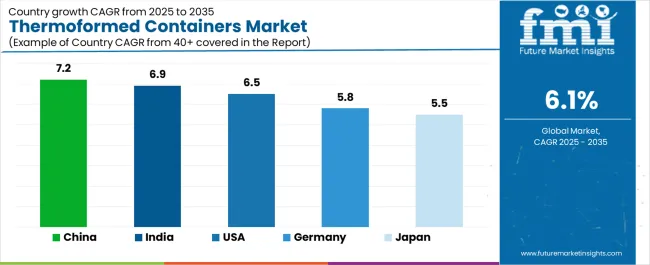
The thermoformed containers market demonstrates varied regional dynamics with Growth Leaders including China (7.2% CAGR) and India (6.9% CAGR) driving expansion through food service modernization and retail infrastructure development. Steady Performers encompass the USA (6.5% CAGR), Germany (5.8% CAGR), and Japan (5.5% CAGR), benefiting from established restaurant sectors and convenience food consumption patterns.
Regional synthesis reveals Asia-Pacific markets leading growth through restaurant expansion and convenience retail development, while European countries maintain steady expansion supported by specialized fresh food applications and pharmaceutical packaging requirements. North American markets show strong growth driven by quick-service restaurant operations and grocery deli expansion.
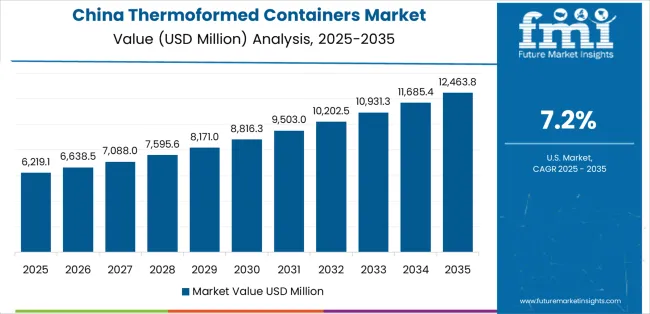
China establishes regional leadership through explosive restaurant expansion and comprehensive retail modernization, integrating advanced thermoformed container systems as standard components in takeout operations and supermarket packaging applications. The country's 7.2% CAGR through 2035 reflects consumer trends favoring convenience consumption and domestic food delivery activity that mandate the use of protective packaging systems in restaurant operations.
Growth concentrates in major urban regions, including Beijing-Tianjin-Hebei, Yangtze River Delta, and Pearl River Delta, where food service chains showcase integrated container systems that appeal to domestic consumers seeking convenient meal solutions and international quality standards.
Chinese manufacturers are developing innovative thermoformed solutions that combine local production advantages with international food safety specifications, including leak-proof construction and advanced insulation capabilities.
Strategic Market Indicators:
The Indian market emphasizes food service applications, including rapid quick-service restaurant development and comprehensive retail modernization that increasingly incorporates thermoformed containers for takeout packaging and fresh food display applications. The country is projected to show a 6.9% CAGR through 2035, driven by massive food service growth under urbanization trends and consumer demand for affordable, hygienic packaging systems. Indian restaurant facilities prioritize cost-effectiveness with containers delivering food protection through economical material usage and efficient manufacturing capabilities.
Technology deployment channels include major restaurant chains, catering services, and retail supermarkets that support high-volume usage for domestic and commercial applications.
Performance Metrics:
The USA market emphasizes advanced container features, including innovative barrier technologies and integration with comprehensive food safety platforms that manage temperature control, contamination prevention, and freshness preservation applications through unified packaging systems.
The country is projected to show a 6.5% CAGR through 2035, driven by quick-service restaurant expansion under convenience consumption trends and commercial demand for reliable, efficient packaging systems. American food service companies prioritize operational efficiency with containers delivering comprehensive protection through automated filling compatibility and tamper-evident integration.
Technology deployment channels include major restaurant chains, grocery retailers, and catering operations that support custom development for high-volume applications.
Performance Metrics:
In Hamburg, Munich, and Berlin, German food retailers and restaurant operators are implementing advanced thermoformed container systems to enhance food protection capabilities and support quality preservation that aligns with hygiene protocols and packaging standards. The German market demonstrates sustained growth with a 5.8% CAGR through 2035, driven by retail innovation programs and food service investments that emphasize reliable packaging systems for prepared meals and fresh food applications.
German retail facilities are prioritizing container systems that provide exceptional barrier protection while maintaining compliance with food contact regulations and minimizing contamination risk, particularly important in deli operations and ready-meal packaging.
Market expansion benefits from food safety programs that mandate protective packaging in retail specifications, creating sustained demand across Germany's food service and retail sectors, where quality and material purity represent critical requirements.
Strategic Market Indicators:
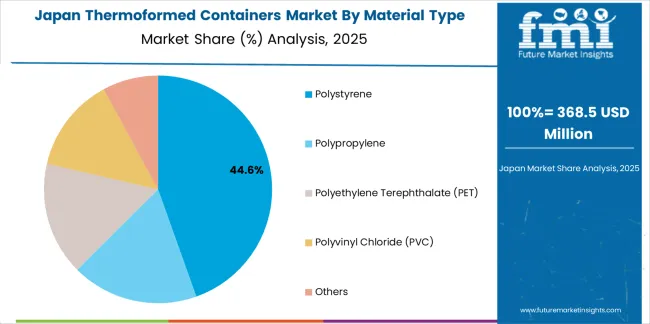
Japan's sophisticated food service market demonstrates meticulous thermoformed container deployment, growing at 5.5% CAGR, with documented operational excellence in convenience store packaging and restaurant takeout applications through integration with existing food preparation systems and quality assurance infrastructure.
The country leverages engineering expertise in polymer science and manufacturing precision to maintain market leadership. Retail centers, including Tokyo, Osaka, and Nagoya, showcase advanced installations where container systems integrate with comprehensive automated filling platforms and temperature management systems to optimize food preservation and quality maintenance.
Japanese food service operators prioritize packaging precision and material purity in product development, creating demand for premium thermoformed containers with advanced features, including anti-fog treatments and integration with microwave-safe specifications. The market benefits from established convenience store infrastructure and willingness to invest in specialized packaging technologies that provide superior food protection and regulatory compliance.
Market Intelligence Brief:
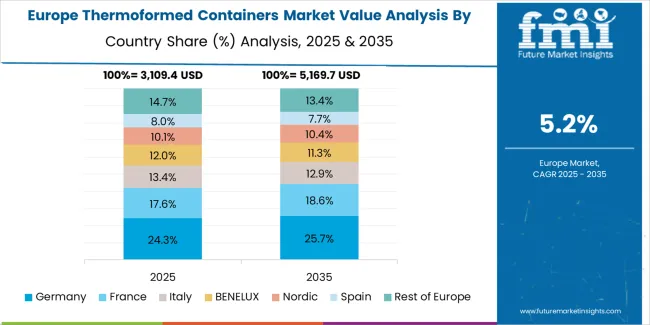
The thermoformed containers market in Europe is projected to grow from USD 3,158 million in 2025 to USD 5,247 million by 2035, registering a CAGR of 5.2% over the forecast period. Germany is expected to maintain its leadership position with a 34.2% market share in 2025, declining slightly to 33.8% by 2035, supported by its food retail excellence and major commercial centers, including North Rhine-Westphalia and Bavaria.
France follows with a 26.4% share in 2025, projected to reach 26.8% by 2035, driven by comprehensive fresh food packaging and restaurant service initiatives. The United Kingdom holds a 19.3% share in 2025, expected to maintain 19.6% by 2035 through established food service sectors and convenience retail adoption.
Italy commands an 11.2% share, while Spain accounts for 6.5% in 2025. The Rest of Europe region is anticipated to gain momentum, expanding its collective share from 2.4% to 2.8% by 2035, attributed to increasing quick-service restaurant development in Eastern European countries and emerging Nordic food retail facilities implementing modern packaging programs.
The Thermoformed Containers Market continues to expand as foodservice operators, FMCG brands, and fresh produce suppliers shift toward lightweight, cost-efficient, and highly customizable packaging formats. Thermoformed containers have gained strong preference due to their clarity, durability, and compatibility with automated filling lines, making them ideal for ready-to-eat meals, bakery items, dairy products, and take-away food applications. Growing demand for recyclable mono-material formats, advances in PET and PP sheet extrusion, and the rise of sealed convenience packaging are further accelerating adoption across global markets.
Pactiv LLC, Dart Container Corporation, and Amcor plc lead the competitive landscape with broad rigid packaging portfolios and strong supply chains serving major retail and foodservice clients. Their focus on lightweight PET and PP solutions, along with investments in closed-loop recycling programs, positions them at the forefront of sustainable thermoforming innovations. Berry Global Inc. and Anchor Packaging LLC continue strengthening their foothold through high-clarity, temperature-resistant containers designed for microwaveable and hot-fill applications.
Regional and specialized producers including Genpak LLC, Sonoco Products Company, D&W Fine Pack LLC, Placon Corporation, and Huhtamaki Group support market growth with tailored designs, rapid tooling capabilities, and food safety–compliant materials. These players cater to segments requiring portion-controlled packs, tamper-evident formats, and high-barrier options for extended shelf life. As sustainability requirements tighten and e-commerce grocery adoption expands, thermoformed containers are set to gain further traction due to their balance of performance, cost efficiency, and recyclability.
| Item | Value |
|---|---|
| Quantitative Units | USD 12,847 million |
| Material Type | Polystyrene, Polypropylene, Polyethylene Terephthalate (PET), Polyvinyl Chloride (PVC), Others |
| Application | Food Packaging, Pharmaceutical Packaging, Electronics Packaging, Industrial Packaging, Consumer Goods, Others |
| Regions Covered | North America, Europe, Asia Pacific, Latin America, Middle East & Africa, and 25+ additional countries |
| Countries Covered | USA, Germany, Japan, China, India |
| Key Companies Profiled | Pactiv LLC, Dart Container Corporation, Amcor plc, Berry Global Inc., Anchor Packaging LLC, Genpak LLC, Sonoco Products Company, D&W Fine Pack LLC, Placon Corporation, Huhtamaki Group |
| Additional Attributes | Dollar sales by material type and application categories, regional adoption trends across North America, Europe, and Asia-Pacific, competitive landscape with packaging manufacturers and polymer suppliers, food service preferences for thermal insulation and barrier excellence, integration with filling equipment and sealing systems, innovations in multi-layer technology and clarity enhancement, and development of specialized protective solutions with enhanced freshness preservation and convenience features |
The global thermoformed containers market is estimated to be valued at USD 12,847.0 million in 2025.
The market size for the thermoformed containers market is projected to reach USD 23,225.0 million by 2035.
The thermoformed containers market is expected to grow at a 6.1% CAGR between 2025 and 2035.
The key product types in thermoformed containers market are polystyrene, polypropylene, polyethylene terephthalate (pet), polyvinyl chloride (pvc) and others.
In terms of application, food packaging segment to command 51.0% share in the thermoformed containers market in 2025.


Our Research Products

The "Full Research Suite" delivers actionable market intel, deep dives on markets or technologies, so clients act faster, cut risk, and unlock growth.

The Leaderboard benchmarks and ranks top vendors, classifying them as Established Leaders, Leading Challengers, or Disruptors & Challengers.

Locates where complements amplify value and substitutes erode it, forecasting net impact by horizon

We deliver granular, decision-grade intel: market sizing, 5-year forecasts, pricing, adoption, usage, revenue, and operational KPIs—plus competitor tracking, regulation, and value chains—across 60 countries broadly.

Spot the shifts before they hit your P&L. We track inflection points, adoption curves, pricing moves, and ecosystem plays to show where demand is heading, why it is changing, and what to do next across high-growth markets and disruptive tech

Real-time reads of user behavior. We track shifting priorities, perceptions of today’s and next-gen services, and provider experience, then pace how fast tech moves from trial to adoption, blending buyer, consumer, and channel inputs with social signals (#WhySwitch, #UX).

Partner with our analyst team to build a custom report designed around your business priorities. From analysing market trends to assessing competitors or crafting bespoke datasets, we tailor insights to your needs.
Supplier Intelligence
Discovery & Profiling
Capacity & Footprint
Performance & Risk
Compliance & Governance
Commercial Readiness
Who Supplies Whom
Scorecards & Shortlists
Playbooks & Docs
Category Intelligence
Definition & Scope
Demand & Use Cases
Cost Drivers
Market Structure
Supply Chain Map
Trade & Policy
Operating Norms
Deliverables
Buyer Intelligence
Account Basics
Spend & Scope
Procurement Model
Vendor Requirements
Terms & Policies
Entry Strategy
Pain Points & Triggers
Outputs
Pricing Analysis
Benchmarks
Trends
Should-Cost
Indexation
Landed Cost
Commercial Terms
Deliverables
Brand Analysis
Positioning & Value Prop
Share & Presence
Customer Evidence
Go-to-Market
Digital & Reputation
Compliance & Trust
KPIs & Gaps
Outputs
Full Research Suite comprises of:
Market outlook & trends analysis
Interviews & case studies
Strategic recommendations
Vendor profiles & capabilities analysis
5-year forecasts
8 regions and 60+ country-level data splits
Market segment data splits
12 months of continuous data updates
DELIVERED AS:
PDF EXCEL ONLINE
Thermoformed Tray Market Size and Share Forecast Outlook 2025 to 2035
Thermoformed Skin Packaging Market Size and Share Forecast Outlook 2025 to 2035
Thermoformed Plastics Market Size and Share Forecast Outlook 2025 to 2035
Thermoformed Tubs Market Trend Analysis Based on Material, Shape, End-Users and Regions through 2025 to 2035
Market Share Distribution Among Thermoformed Tubs Manufacturers
Market Share Breakdown of Thermoformed Tray Market
Thermoformed Lids Market
PS Containers Market Size and Share Forecast Outlook 2025 to 2035
PET Containers Market Growth, Demand and Forecast from 2025 to 2035
PUR containers packaging Market
Roll Containers Market Size and Share Forecast Outlook 2025 to 2035
HDPE Containers Market Insights & Growth Outlook 2025 to 2035
Market Share Breakdown of Roll Containers Manufacturers
Foam Containers Market
Soup Containers Market
Metal Containers Market Demand & Packaging Innovations 2025 to 2035
Steel Containers Market Analysis by Product Type, Capacity Type, End Use, and Region through 2025 to 2035
Key Players & Market Share in the Steel Containers Industry
Smart Containers Market
Spout Containers Market

Thank you!
You will receive an email from our Business Development Manager. Please be sure to check your SPAM/JUNK folder too.
Chat With
MaRIA