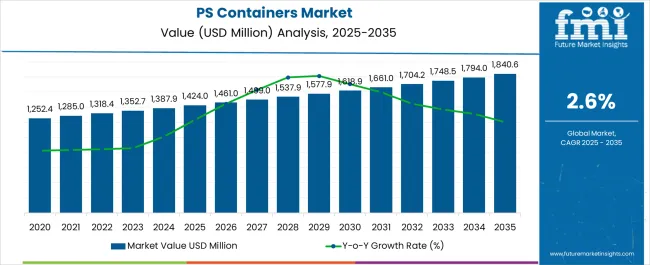
The PS Containers Market is estimated to be valued at USD 1424.0 million in 2025 and is projected to reach USD 1840.6 million by 2035, registering a compound annual growth rate (CAGR) of 2.6% over the forecast period.
Food packaging applications present critical coordination challenges between compliance departments navigating complex regulatory landscapes and operations teams requiring cost-effective packaging solutions. Restaurant chains face municipal polystyrene bans varying by location while procurement teams struggle to identify consistent alternatives across multi-state operations. Supply chain managers require packaging materials that provide thermal insulation and product protection characteristics that polystyrene achieves economically, yet regulatory compliance departments demand alternatives that may compromise food safety or increase operational costs substantially.
Manufacturing environments reveal fundamental tensions between production efficiency optimization and regulatory compliance requirements that differ dramatically across regional markets. Processing facilities require specialized equipment for foam molding operations while facing potential stranded asset risks where polystyrene bans eliminate major application segments. Quality control protocols established for polystyrene containers may not transfer effectively to alternative materials, creating validation challenges where food safety requirements demand extensive testing and certification procedures that paper or compostable alternatives cannot easily accommodate.
International trade dynamics reflect regulatory fragmentation challenges where polystyrene container manufacturers must navigate different restriction levels and implementation timelines across major export markets. European Union bans create immediate market access barriers while North American restrictions vary by state and municipality, complicating production planning and inventory management strategies. Asian markets remain more permissive yet face increasing pressure for environmental compliance that may affect future demand patterns and regulatory developments.
Retail food service demonstrates cross-functional tensions where customer satisfaction requirements conflict with sustainable packaging mandates and cost optimization objectives. Quick service restaurants require containers that maintain food temperature and prevent leakage while environmental compliance teams pursue alternatives that may not achieve equivalent performance standards. Menu engineering becomes complicated where packaging costs significantly impact profit margins yet customer expectations for food quality and presentation remain unchanged regardless of container material modifications.
Supply chain coordination reveals additional complexity dimensions where alternative materials often require different handling procedures and storage conditions compared to established polystyrene operations. Fiber-based alternatives may require moisture control during transportation while biodegradable options face shelf life limitations that affect inventory turnover planning. Procurement teams must evaluate total cost structures where alternative materials command premium pricing yet potentially reduce waste disposal costs and regulatory compliance risks that traditional accounting systems struggle to quantify accurately.

| Metric | Value |
|---|---|
| PS Containers Market Estimated Value in (2025 E) | USD 1424.0 million |
| PS Containers Market Forecast Value in (2035 F) | USD 1840.6 million |
| Forecast CAGR (2025 to 2035) | 2.6% |
The PS containers market is expanding steadily as demand rises for lightweight, cost effective, and versatile packaging solutions across food and non food industries. Growing urbanization, increasing consumption of packaged food, and the convenience offered by disposable containers have supported market adoption.
The ability of PS containers to provide durability, insulation, and ease of handling has made them a preferred choice for quick service restaurants, food delivery platforms, and retail outlets. Regulatory discussions on sustainable packaging are driving manufacturers to innovate with recyclable and eco friendly variants, ensuring compliance while meeting consumer expectations.
Advancements in molding technologies and product design flexibility are also enhancing their market competitiveness. The outlook remains positive as global demand for packaged and ready to eat food continues to grow, positioning PS containers as a significant part of the modern packaging ecosystem.
The bottles segment is expected to account for 47.60% of total market revenue by 2025 within the product category, making it the leading segment. Growth in this segment is supported by rising consumption of beverages, sauces, and condiments which require safe and durable packaging.
PS bottles offer lightweight characteristics, clarity for product visibility, and ease of transport, contributing to widespread use in the food and beverage sector. Additionally, their compatibility with labeling and branding strategies enhances shelf appeal and marketing value.
The segment’s ability to balance cost efficiency with performance has reinforced its dominance in the product category.
The food segment is projected to contribute 42.90% of overall revenue by 2025 within the application category, establishing itself as the leading sector. This share is driven by the growing demand for packaged meals, take away services, and ready to eat products.
PS containers are widely used for their thermal resistance, durability, and capacity to preserve freshness during storage and transport. Food retailers and delivery services increasingly rely on PS containers to meet consumer expectations for convenience and safety.
The segment’s leadership is also supported by the affordability and versatility of PS containers, making them suitable across a wide range of food categories from fresh produce to prepared meals.
As per FMI, the PS Containers market may reach over USD 1840.6 million by 2035. In 2025, the global market increased at a CAGR of 2.0%, which is a market share of USD 1424 million. Although not evenly distributed throughout all regions, this growth is significant in developing markets, where it is predicted to reach USD 1352.7 million by 2025 with a CAGR of 2.6%.
| Historical CAGR | 2.0% |
|---|---|
| Historical Market Value (2025) | USD 1424 million |
| Forecast CAGR | 2.6% |
In the wake of the pandemic, PS containers have experienced low demand than anticipated across all regions compared to pre-pandemic levels. According to FMI analysis, the global PS Containers market declined by 2.0% between 2020 and 2024.
| Particulars | Details |
|---|---|
| Jan-Jun (H1), 2024 (A) | 3.5% |
| Jan-Jun (H1), 2025 Projected (P) | 3.7% |
| Jan-Jun (H1), 2025 Outlook (O) | 3.0% |
| BPS: H1,2025 (O) - H1,2024 (P) | -50 |
| BPS Change: H1,2025 (O) - H1,2024 (A) | -70 |
One of the most important factors which have led to a significant increase in the sales of PS containers is the change in lifestyles, especially in developing countries. In countries like India, China, etc., there has been a paradigm shift in the lifestyle of people, especially over the past 2 decades.
Due to the busy lifestyle of people working in corporate companies, they hardly get any time to cook and eat their food. Instead, they go in for ready-to-eat food or fast food. In such cases, they generally make use of utensils made of Polystyrene. Because of this, there has been an increasing demand for PS containers, not only in developing but also in developed nations.
Moreover, owing to their lightweight and affordable cost, PS containers have become extremely popular. Owing to these features, they are used in a variety of industries ranging from medical, electrical, and electronics, and cosmetics and personal care. These factors have ultimately led to an increase in the sales of PS containers.
Even during the manufacturing of PS Containers, not much energy is utilized. Apart from that, the number of raw materials involved in the manufacturing of PS containers is also quite less. All these indicate the fact that businesses have saved lots of money by making use of polystyrene, and this has further propelled the sales of PS containers.
Some restraints in the PS (polystyrene) containers market include:
Owing to rapid urbanization in developing countries, Asia Pacific is believed to be the most attractive destination for the PS container market. The reason behind this is a lifestyle change, and people don’t get time to prepare food by themselves.
So, while consuming ready-to-eat food or food from a quick-service restaurant, people generally make use of PS containers.
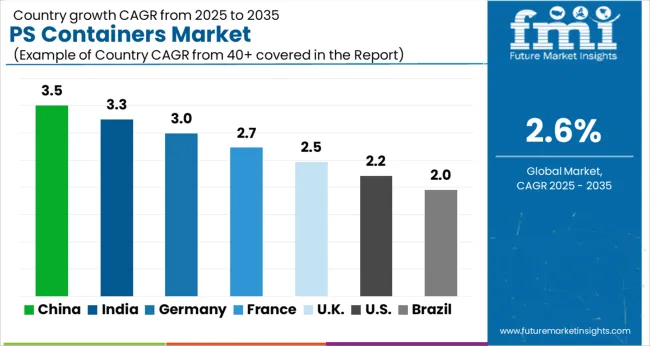
The two countries mainly responsible for such a massive growth of the PS containers market are India and China in the Asia Pacific region, and especially China.
If we talk about North America and Europe, increasing quick-service restaurants in these regions have fueled the demand for PS containers in these regions. Moreover, the existence of rapid urbanization has also increased the sales of PS containers.
Even Latin America has been witnessing an increased demand for PS containers for a variety of industries like medical, electronics, food, etc.

| Country | Statistics |
|---|---|
| The United States | The PS containers market in the United States currently holds the maximum number of shares and has registered a market valuation of USD 1424 million in 2025. The United States PS container market is projected to capture a market share of 17.1% by the end of 2025. |
| The United Kingdom | Europe is identified to hold a significant market share in the PS containers market. Currently, the United Kingdom is the leading country in this region and is accountable for a market valuation of USD 1424.0 million in 2025, advancing at a moderate-paced CAGR of 3.6%. The market valuation is expected to surpass USD 1840.6 million by 2035. |
| China | China is projected to advance at a significant pace, registering a CAGR of 6.8% through the forecast period. The country is currently holding a market valuation of USD 347.1 million in 2025. FMI estimates valuation to surpass USD 670.14 million by the end of 2035. |
| India | India is projected to advance at a moderate pace, registering a CAGR of 7.5% through the forecast period. The country is currently holding a market valuation of USD 310.68 million in 2025. FMI estimates valuation to surpass USD 640.31 million by the end of 2035. |
Many start-ups in the PS Containers market are working on innovative solutions to meet the evolving needs of the industry. These start-ups are hugely driven by the increasing need for enhanced environmental sustainability.
These start-ups are working to bring cutting-edge technologies and solutions to the PS container market, helping to shape the future of the industry.
There are some start-ups operating in the PS (polystyrene) container market, which includes products like foam cups, take-out containers, and packaging materials. Some examples include:
These start-ups are a part of a trend of companies looking for ways to reduce the environmental impact of packaging materials, particularly those made from plastic.

The Polystyrene (PS) Containers Market is experiencing steady growth, supported by increasing demand across the foodservice, consumer goods, and pharmaceutical sectors. PS containers are widely used due to their light weight, rigidity, clarity, and cost-effectiveness, making them ideal for packaging applications such as trays, clamshells, cups, and takeout boxes. The market’s expansion is being driven by urbanization, the rise of quick-service restaurants (QSRs), and growing consumption of packaged foods and beverages worldwide.
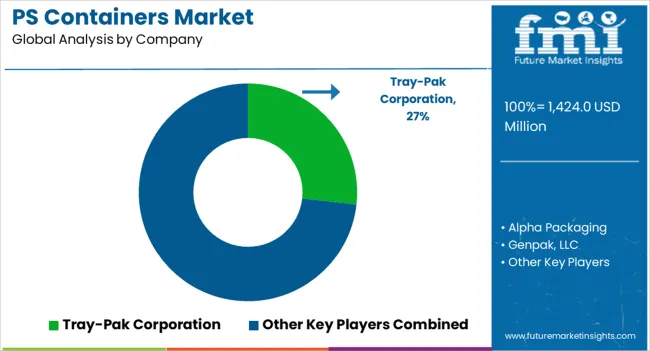
Leading manufacturers such as Tray-Pak Corporation, Genpak LLC, and Sabert Corporation dominate the market with a diverse range of thermoformed PS containers designed for food packaging, catering, and retail applications. Tray-Pak Corporation specializes in custom-engineered trays and inserts for food and medical use, emphasizing design flexibility and precision molding. Genpak LLC and Sabert Corporation are investing in sustainable alternatives by developing recyclable and hybrid PS packaging that reduces environmental impact while maintaining durability and insulation performance.
Alpha Packaging and CKS Packaging Inc. contribute to the market with rigid PS containers for personal care, pharmaceuticals, and household products, leveraging advanced extrusion and injection molding technologies. Takween Advanced Industries and TYH Container Enterprise Co. Ltd. are expanding production capacity in the Middle East and Asia, supplying cost-effective packaging solutions for fast-growing regional markets. Plastipak Holdings Inc. and Sonoco Products Company are focusing on circular packaging initiatives, integrating recycled materials and developing PS containers that comply with emerging sustainability standards.
| Attribute | Details |
|---|---|
| Forecast Period | 2025 to 2035 |
| Historical Data Available for | 2020 to 2025 |
| Market Analysis | USD billion for Value and MT for Volume |
| Key Regions Covered | North America; Latin America; Europe; The Middle East and Africa; East Asia |
| Key Countries Covered | United States, Canada, Brazil, Mexico, Chile, Peru, Germany, United Kingdom., Spain, Italy, France, Russia, Poland, China, India, Japan, Australia, New Zealand, GCC Countries, North Africa, South Africa, and Turkey |
| Key Segments Covered | Product, Application, Region |
| Key Companies Profiled |
Tray-Pak Corporation, Alpha Packaging, Genpak LLC, Sabert Corporation, CKS Packaging Inc., Takween Advanced Industries, TYH Container Enterprise Co. Ltd., Plastipak Holdings Inc., Sonoco Products Company |
| Report Coverage | Market Forecast, Company Share Analysis, Competition Intelligence, DROT Analysis, Market Dynamics and Challenges, and Strategic Growth Initiatives |
| Customization & Pricing | Available upon Request |
The global ps containers market is estimated to be valued at USD 1,424.0 million in 2025.
The market size for the ps containers market is projected to reach USD 1,840.6 million by 2035.
The ps containers market is expected to grow at a 2.6% CAGR between 2025 and 2035.
The key product types in ps containers market are bottles, jars, plates & bowls, trays, blisters & clamshell and others.
In terms of application, food segment to command 42.9% share in the ps containers market in 2025.


Full Research Suite comprises of:
Market outlook & trends analysis
Interviews & case studies
Strategic recommendations
Vendor profiles & capabilities analysis
5-year forecasts
8 regions and 60+ country-level data splits
Market segment data splits
12 months of continuous data updates
DELIVERED AS:
PDF EXCEL ONLINE
Collapsible Rigid Containers Market Size and Share Forecast Outlook 2025 to 2035
Competitive Landscape of Collapsible Rigid Containers Providers
Collapsible Sleeve Containers Market Growth-Forecast 2025 to 2035
Collapsible Food Packaging Containers Market
Psyllium Seed Market Size and Share Forecast Outlook 2025 to 2035
Psoriasis Care Formulas Market Analysis - Size and Share Forecast Outlook 2025 to 2035
Psychotherapeutic Combinations Market Analysis - Size, Share, and Forecast Outlook 2025 to 2035
Psychosis Diagnostics Market Size and Share Forecast Outlook 2025 to 2035
Pseudo Satellite Market Size and Share Forecast Outlook 2025 to 2035
PSA Film Market Analysis - Size, Share, and Forecast Outlook 2025 to 2035
Psychotropic Drugs Market Growth - Industry Trends & Outlook 2025 to 2035
Pseudo Collagen Market Analysis - Size, Share & Forecast 2025 to 2035
Psychobiotic Supplements Market Outlook - Growth, Demand & Forecast 2025 to 2035
Market Share Distribution Among Psychedelic Mushroom Providers
Global Psoriasis Biosimilars Market Analysis – Size, Share & Forecast 2024-2034
Psychedelic Medicine Market
Psoriatic Arthritis (PsA) Treatment Market Insights – Growth & Forecast 2024-2034
Psophometer Market
BPS Pressure Sensors Market Size and Share Forecast Outlook 2025 to 2035
EPS Shippers Market Size and Share Forecast Outlook 2025 to 2035

Thank you!
You will receive an email from our Business Development Manager. Please be sure to check your SPAM/JUNK folder too.
Chat With
MaRIA