Psyllium Seed Market Size and Share Forecast Outlook 2025 to 2035

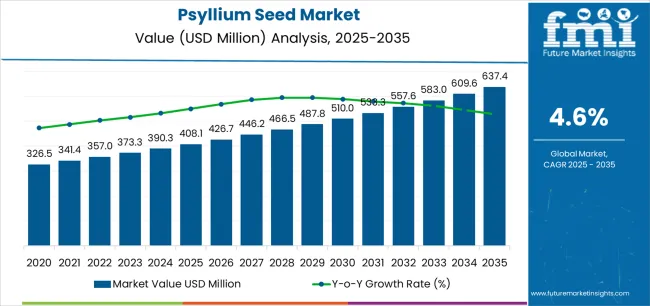
The Psyllium Seed Market is estimated to be valued at USD 408.1 million in 2025 and is projected to reach USD 637.4 million by 2035, registering a compound annual growth rate (CAGR) of 4.6% over the forecast period.

The Psyllium Seed market is experiencing significant growth driven by its increasing use as a functional ingredient in food, pharmaceutical, and nutraceutical applications. Rising consumer awareness of digestive health, cholesterol management, and glycemic control has LED to greater demand for psyllium-based products across both developed and emerging markets. The future outlook for this market is shaped by ongoing research highlighting the health benefits of soluble fiber and the growing trend of clean label and organic ingredients.

Increasing investments in functional food formulations and dietary supplements are further supporting market expansion. Additionally, the surge in B2B demand from food manufacturers and healthcare product developers is driving production and adoption.

Regulatory support for natural and organic ingredients, coupled with consumer preference for plant-based solutions, continues to enhance market growth As lifestyle-related health concerns rise globally, psyllium seeds are expected to maintain a crucial role in digestive health and weight management solutions, creating sustained opportunities for manufacturers and suppliers worldwide.
Quick Stats for Psyllium Seed Market

  • Psyllium Seed Market Industry Value (2025): USD 408.1 million
  • Psyllium Seed Market Forecast Value (2035): USD 637.4 million
  • Psyllium Seed Market Forecast CAGR: 4.6%
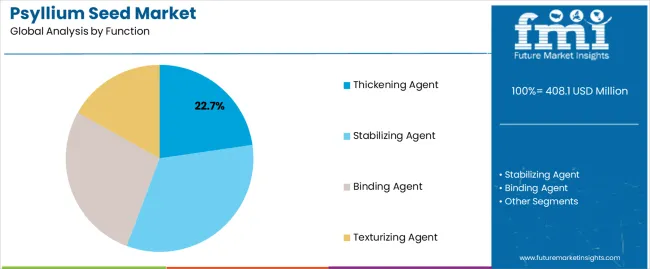
  • Leading Segment in Psyllium Seed Market in 2025: Thickening Agent (22.7%)
  • Key Growth Region in Psyllium Seed Market: North America, Asia-Pacific, Europe
  • Top Key Players in Psyllium Seed Market: Keyur Industries, JYOT Overseas Pvt. Ltd., Atlas Industries, Satnam Psyllium Industries, Abhyuday Industries, Shree Mahalaxmi Psyllium Pvt. Ltd., Rajganga Agro Product Pvt. Ltd., Jyotindra International, Ispasen Remedies, Shubh Psyllium Industries, Others

Psyllium Seed Market Market Value Analysis

Metric Value
Psyllium Seed Market Estimated Value in (2025 E) USD 408.1 million
Psyllium Seed Market Forecast Value in (2035 F) USD 637.4 million
Forecast CAGR (2025 to 2035) 4.6%

Segmental Analysis

The market is segmented by Function, End Use, and Nature and region. By Function, the market is divided into Thickening Agent, Stabilizing Agent, Binding Agent, and Texturizing Agent. In terms of End Use, the market is classified into B2B and B2C. Based on Nature, the market is segmented into Organic and Conventional. Regionally, the market is classified into North America, Latin America, Western Europe, Eastern Europe, Balkan & Baltic Countries, Russia & Belarus, Central Asia, East Asia, South Asia & Pacific, and the Middle East & Africa.
Insights into the Thickening Agent Function Segment

Psyllium Seed Market Analysis By Function

The thickening agent function segment is projected to hold 22.70% of the Psyllium Seed market revenue share in 2025, establishing it as a leading functional application. This growth has been driven by the ability of psyllium to improve texture, viscosity, and stability in food and pharmaceutical formulations.

Its natural thickening properties have made it highly preferred in product development, offering clean label and plant-based alternatives to synthetic stabilizers. The versatility of psyllium as a thickening agent allows integration into a variety of applications including bakery, beverages, and dietary supplements, enhancing its adoption.

The increasing emphasis on health-conscious and functional products, along with demand for gluten-free and low-calorie formulations, has reinforced the growth of this segment The combination of natural functionality, cost-effectiveness, and widespread industrial acceptance continues to strengthen its dominant position in the market.
Insights into the B2B End-Use Segment

Psyllium Seed Market Analysis By End Use

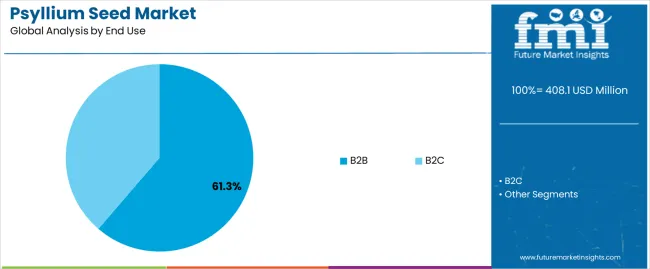
The B2B end-use segment is expected to account for 61.30% of the Psyllium Seed market revenue in 2025, making it the leading customer category. This segment growth has been driven by the demand from food manufacturers, nutraceutical companies, and pharmaceutical producers seeking high-quality psyllium for formulation purposes.

Bulk purchasing and integration into commercial product lines have reinforced adoption across the supply chain. The focus on functional ingredients in product innovation, regulatory compliance, and standardized quality has further strengthened the preference for B2B sourcing.

As manufacturers increasingly emphasize digestive health, metabolic wellness, and clean label products, the B2B segment continues to capture the largest share of market revenue.
Insights into the Organic Nature Segment

Psyllium Seed Market Analysis By Nature

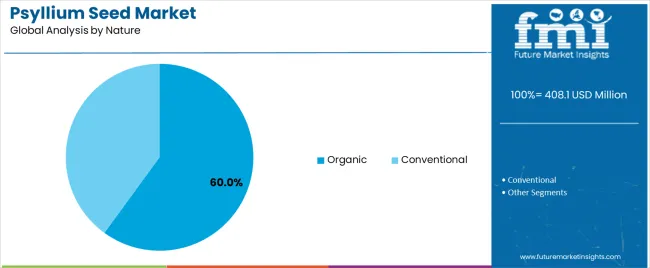
The organic nature segment is anticipated to hold 60.00% of the Psyllium Seed market revenue share in 2025, positioning it as the dominant category. The preference for organic psyllium has been fueled by consumer demand for natural, non-GMO, and chemical-free ingredients.

The growing focus on health, sustainability, and environmental responsibility has driven adoption in both food and pharmaceutical applications. Organic certification provides assurance of quality and compliance, which is highly valued by manufacturers and end consumers alike.

Additionally, the rising popularity of plant-based and holistic health products has reinforced the demand for organic psyllium seeds, ensuring continued growth of this segment in the market.

Semi Annual Market Update

Particular Value CAGR
H1 4.2% (2025 to 2035)
H2 3.9% (2025 to 2035)
H1 4.6% (2025 to 2035)
H2 4.4% (2025 to 2035)

The above table presents the expected CAGR for the global Psyllium Seed industry over several semi-annual periods spanning from 2025 to 2035. In the first half (H1) of the decade from 2025 to 2035, the business is predicted to surge at a CAGR of 4.2%, followed by a slightly lower growth rate of 3.9% in the second half (H2) of the same decade.

Moving into the subsequent period, from H1 2025 to H2 2035, the CAGR is projected to increase slightly to 4.6% in the first half and remain relatively moderate at 4.4% in the second half. In the first half (H1) the industry witnessed an increase of 40 BPS while in the second half (H2), the industry witnessed an increase of 60 BPS

Key Industry Highlights

Health Craze Fuels Psyllium Surge

The global health and wellness boom is significantly propelling the psyllium seed category. As awareness about the importance of dietary fiber in maintaining overall health increases, psyllium is gaining recognition for its benefits in aiding digestion, controlling blood sugar levels, and managing cholesterol. This trend is amplified by the rise in lifestyle-related health conditions such as obesity, diabetes, and cardiovascular diseases.

Informed consumers are actively seeking natural and effective dietary supplements, making psyllium a popular choice. The growing emphasis on self-care and preventive health measures is expected to continue boosting demand for psyllium-based products. Additionally, the trend towards personalized nutrition and functional foods is driving innovation in psyllium-based dietary supplements, catering to specific health needs and preferences.

Psyllium Takes Center Stage

Manufacturers are increasingly exploring innovative product developments incorporating psyllium. Beyond traditional uses, companies are formulating new applications such as psyllium-infused beverages, functional snacks, and meal replacements. This trend is driven by the need to cater to diverse consumer preferences and dietary requirements.

The versatility of psyllium allows it to be integrated into various product categories, enhancing their nutritional profile and product appeal. For example, psyllium is being used in gluten-free baking to improve texture and moisture retention, and in health drinks to add a fiber boost. Innovation in product development is not only expanding psyllium's industry presence but also creating new opportunities for growth in untapped segments, including vegan and plant-based diets.

Organic and Sustainable Psyllium

The push towards organic and sustainable farming is gaining momentum, and psyllium seed production is no exception. As consumers become more environmentally conscious, there is a growing demand for organic psyllium seeds. Sustainable farming practices reduce environmental impact and improve soil health, aligning with the global shift towards eco-friendly agriculture.

This trend is supported by regulatory frameworks and certifications that promote organic farming. Producers adopting organic practices are likely to gain a competitive edge, meeting the rising consumer demand for clean and green products. Moreover, organic psyllium farming can command higher prices, providing economic benefits to farmers while supporting environmental sustainability.

Tapping Emerging Markets

Emerging regions such as Asia-Pacific, Latin America, and Africa are presenting new growth opportunities for the psyllium seed sales. Increased awareness about the health benefits of psyllium and rising disposable incomes are driving demand in these regions. Additionally, urbanization and changing dietary habits are contributing to higher consumption of dietary supplements and functional foods.

As these categories continue to develop, they offer significant potential for sales expansion. Companies are investing in education and awareness campaigns to inform consumers about psyllium's health benefits, further driving adoption. Strategic partnerships and local collaborations are also helping to penetrate these emerging industries effectively.

Agri-Tech Boom: Advancing Psyllium Cultivation

Technological advancements in agriculture are transforming psyllium seed cultivation and production. Innovations such as precision farming, drone technology, and advanced irrigation systems are improving crop yields and quality. These technologies enable farmers to optimize resource use, reduce waste, and enhance productivity. Furthermore, advancements in seed genetics, including the development of genetically modified (GMO) psyllium seeds, are addressing challenges related to pests, diseases, and climate change.

The adoption of these technologies is expected to increase efficiency and sustainability in psyllium production, meeting the growing global demand while ensuring environmental stewardship. Enhanced farming techniques also improve the consistency and quality of psyllium seeds, making them more attractive to both food and pharmaceutical industries.

2020 to 2025 Psyllium Seed Sales Outlook Compared to 2025 to 2035 Forecast

In the historical outlook of the psyllium seed sales, the value increased from USD 326.5 million in 2020 to USD 408.1 million in 2025, with a compounded annual growth rate (CAGR) of 4.0% over this period. Looking forward, projections indicate robust growth, with the industry expected to reach USD 637.4 million by 2035, growing at a CAGR of 4.8%.

This growth trajectory underscores increasing consumer awareness and demand for psyllium-based products across various industries including food, pharmaceuticals, and cosmetics.

By 2050, the United Nations predicts a global population of 9.8 billion, highlighting the critical need for environmentally sustainable agricultural practices. Psyllium Seeds play a crucial role in sustainable agriculture by reducing water consumption and minimizing seed waste, thereby supporting eco-friendly crop production practices.

Global per capita land and arable land availability are declining steadily, exacerbating the gap between agricultural supply and demand. According to United Nations data, the per capita arable land decreased from 0.227 hectares in 2000 to 0.192 hectares by 2020, with further declines projected. This scarcity of arable land underscores the urgency for maximizing agricultural productivity per unit of land.

Farmers worldwide are increasingly turning to advanced materials such as Psyllium Seeds to optimize crop yield and efficiency. These seeds are known for their ability to enhance soil structure, retain moisture, and promote healthier plant growth. By adopting innovative agricultural technologies and sustainable practices, farmers can mitigate environmental impact while meeting the rising global demand for food and agricultural products.

Market Concentration

The psyllium seed category operates within a structured supply chain that encompasses multiple tiers of concentration. At the top tier, approximately 30% of the industry is dominated by large multinational companies and major agricultural players.

These entities oversee extensive farming operations and exert significant control over psyllium seed production and distribution channels.

The middle tier, comprising around 50% of the sales, includes medium-sized enterprises and regional suppliers. These actors, including local farmers and cooperatives, play integral roles in both cultivating psyllium seeds and undertaking initial processing stages. They facilitate the transition of raw psyllium seeds from farms to processing facilities, where seeds undergo cleaning, sorting, and grading processes.

Further downstream, the remaining 20% of the sales is served by smaller players, local distributors, and niche participants. These entities operate primarily in the distribution of processed psyllium products to end-users across diverse industries such as food, pharmaceuticals, and cosmetics.

Psyllium seeds are primarily sourced from farmers located in key regions like India, Pakistan, and Iran, where favorable agro-climatic conditions support their cultivation. The supply chain begins with these farmers, who cultivate and harvest psyllium seeds using traditional farming methods.

As the seeds move through successive stages of processing and distribution, they are transformed into various forms such as husk, husk powder, and industrial powder, tailored to meet specific industry requirements.

This structured supply chain ensures efficient production, processing, and distribution of psyllium products, catering to the increasing global demand driven by applications in health foods, dietary supplements, pharmaceuticals, and cosmetics.

Country-wise Insights

The following table shows the estimated growth rates of the top five geographies. Germany and Australia are set to exhibit high psyllium seed consumption, recording CAGRs of 8.5% and 9.3%, respectively, through 2035.

Countries CAGR 2025 to 2035
United States 4.1%
Germany 8.5%
China 3.2%
Australia 9.3%
India 2.8%

United States Digestive Health Drives Psyllium Popularity

The USA sales for psyllium seed is flourishing, fueled by rising consumer awareness of its health benefits. Psyllium-based products like capsules and powders are gaining popularity for their convenience and efficacy in enhancing digestive health. Contributing 23.1% to the global revenue, the USA reflects a strong demand for dietary supplements and functional foods enriched with psyllium.

Germany Soluble Fiber Sparks Psyllium Demand

Germany sees rapid expansion in the psyllium seed sales as consumers embrace its digestive health benefits. Psyllium seeds, known for their soluble fiber content, are favored for regulating digestion and improving overall well-being. With a substantial 24.6% contribution to Europe's industry, Germany highlights significant growth potential driven by health-conscious consumer preferences.

Japan Health Supplements Boost Psyllium Sales

Japan experiences robust growth in the psyllium seed sales driven by increasing demand for dietary fiber and health supplements. Psyllium seeds are valued for their contribution to digestive health and balanced nutrition. The products in Japan is steadily expanding, focusing on dietary supplements and functional foods catering to a health-conscious demographic.

India and China Asia Pacific Leads Psyllium Growth

Asia Pacific, particularly India and China, emerges as the fastest-growing market for psyllium seed globally. These countries exhibit a strong demand for dietary fiber and laxatives, driven by evolving lifestyles and heightened health awareness. With substantial market growth potential, India and China are pivotal in shaping the psyllium seed sales in the region.

Category-wise Insights

Thickening Agent - Enhancing Texture and Stability

Segment Function (Thickening Agent)
Value Share (2025) 22.7%

Psyllium seeds are gaining significant traction as a thickening agent, with a projected value share of 22.7% in 2025. This function is particularly vital in the food and beverage industry, where psyllium's ability to enhance the texture and stability of products is highly valued. Psyllium’s natural gelling properties make it an excellent choice for improving the consistency of sauces, soups, and baked goods, contributing to a superior mouthfeel and extended shelf life.

Additionally, the clean-label movement, where consumers seek natural and recognizable ingredients, further propels the demand for psyllium as a thickening agent. Its multifunctionality also extends to pharmaceutical applications, where it is used in formulations to improve the viscosity and stability of medicinal suspensions and emulsions. As manufacturers continue to innovate with plant-based and health-focused products, psyllium’s role as a versatile thickening agent is set to expand, driving its market share further.

B2B - Driving Bulk Demand and Industry Integration

Segment End Use (B2B)
Value Share (2025) 61.3%

The B2B segment dominates the psyllium seed market with a substantial value share of 61.3% in 2025. This dominance is driven by the extensive use of psyllium seeds and their derivatives in various industries, including food and beverages, pharmaceuticals, and cosmetics. In the food industry, bulk purchases of psyllium seeds are crucial for producing dietary supplements, health drinks, and high-fiber bakery products.

Pharmaceutical companies leverage psyllium's health benefits in bulk to manufacture laxatives, cholesterol-lowering products, and other health supplements. The cosmetic industry also utilizes psyllium in large quantities for its moisturizing and stabilizing properties in skincare and haircare formulations.

The B2B segment's growth is further supported by strategic partnerships and collaborations between psyllium producers and industrial users, ensuring a steady supply chain and fostering innovation. As health and wellness trends continue to rise, the B2B demand for psyllium seeds is expected to maintain its significant share, reinforcing its critical role in various industrial applications.
Competitive Landscape

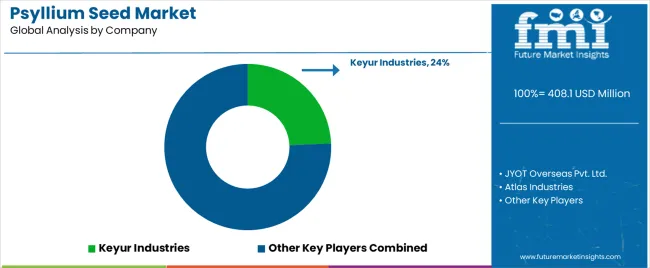
Psyllium Seed Market Analysis By Company

Key Psyllium Seed manufacturers are focusing on expanding product portfolio with new product innovations and going for research and development, while top Psyllium Seed brands are expanding comapny share with inorganic growth strategies involving new footprints in different other countries.

For instance

  • February 2025, Ginsa brands officially launched ginsa, the first-to-industry sparkling ginseng tonic centered around Korean red ginseng, an antioxidant-rich root celebrated for its ability to increase energy, enhance immunity, fight inflammation and improve focus.
  • February 2025, South Korean cosmetics startup FM Biohealth Co. launched a new skincare product that contains ginseng fruit extracts as an active substance.

Leading Psyllium Seed Brands

  • Keyur Industries
  • JYOT Overseas Pvt. Ltd.
  • Atlas Industries
  • Satnam Psyllium Industries
  • Abhyuday Industries
  • Shree Mahalaxmi psyllium Pvt. Ltd.
  • Rajganga Agro Product Pvt.Ltd.
  • Jyotindra International
  • Ispasen Remedies
  • Shubh Psyllium Industries
  • Others

Key Segments of Market Report

By Function:

As per function the industry has been categorized into Thickening Agent, Stabilizing Agent, Binding Agent, Texturizing Agent

By End Use:

The segment is further categorized into B2B (Food and Beverage, Pharmaceuticals, Animal Feed, Dietary Supplements), and B2C

By Nature:

Nature in further categorized into Organic and Conventional

By Region:

Industry analysis has been carried out in key countries of North America, Latin America, Europe, East Asia, South Asia, Oceania and Middle East & Africa

Frequently Asked Questions

How big is the psyllium seed market in 2025?

The global psyllium seed market is estimated to be valued at USD 408.1 million in 2025.

What will be the size of psyllium seed market in 2035?

The market size for the psyllium seed market is projected to reach USD 637.4 million by 2035.

How much will be the psyllium seed market growth between 2025 and 2035?

The psyllium seed market is expected to grow at a 4.6% CAGR between 2025 and 2035.

What are the key product types in the psyllium seed market?

The key product types in psyllium seed market are thickening agent, stabilizing agent, binding agent and texturizing agent.

Which end use segment to contribute significant share in the psyllium seed market in 2025?

In terms of end use, b2b segment to command 61.3% share in the psyllium seed market in 2025.

Table of Content

  1. Executive Summary
    • Global Market Outlook
    • Demand-side Trends
    • Supply-side Trends
    • Technology Roadmap Analysis
    • Analysis and Recommendations
  2. Market Overview
    • Market Coverage / Taxonomy
    • Market Definition / Scope / Limitations
  3. Market Background
    • Market Dynamics
      • Drivers
      • Restraints
      • Opportunity
      • Trends
    • Scenario Forecast
      • Demand in Optimistic Scenario
      • Demand in Likely Scenario
      • Demand in Conservative Scenario
    • Opportunity Map Analysis
    • Product Life Cycle Analysis
    • Supply Chain Analysis
    • Investment Feasibility Matrix
    • Value Chain Analysis
    • PESTLE and Porter’s Analysis
    • Regulatory Landscape
    • Regional Parent Market Outlook
    • Production and Consumption Statistics
    • Import and Export Statistics
  4. Global Market Analysis 2020 to 2024 and Forecast, 2025 to 2035
    • Historical Market Size Value (USD Million) Analysis, 2020 to 2024
    • Current and Future Market Size Value (USD Million) Projections, 2025 to 2035
      • Y-o-Y Growth Trend Analysis
      • Absolute $ Opportunity Analysis
  5. Global Market Pricing Analysis 2020 to 2024 and Forecast 2025 to 2035
  6. Global Market Analysis 2020 to 2024 and Forecast 2025 to 2035, By Function
    • Introduction / Key Findings
    • Historical Market Size Value (USD Million) Analysis By Function , 2020 to 2024
    • Current and Future Market Size Value (USD Million) Analysis and Forecast By Function , 2025 to 2035
      • Thickening Agent
      • Stabilizing Agent
      • Binding Agent
      • Texturizing Agent
    • Y-o-Y Growth Trend Analysis By Function , 2020 to 2024
    • Absolute $ Opportunity Analysis By Function , 2025 to 2035
  7. Global Market Analysis 2020 to 2024 and Forecast 2025 to 2035, By End Use
    • Introduction / Key Findings
    • Historical Market Size Value (USD Million) Analysis By End Use, 2020 to 2024
    • Current and Future Market Size Value (USD Million) Analysis and Forecast By End Use, 2025 to 2035
      • B2B
        • Food and Beverage
        • Pharmaceuticals
        • Animal Feed
        • Dietary Supplements
      • B2C
    • Y-o-Y Growth Trend Analysis By End Use, 2020 to 2024
    • Absolute $ Opportunity Analysis By End Use, 2025 to 2035
  8. Global Market Analysis 2020 to 2024 and Forecast 2025 to 2035, By Nature
    • Introduction / Key Findings
    • Historical Market Size Value (USD Million) Analysis By Nature, 2020 to 2024
    • Current and Future Market Size Value (USD Million) Analysis and Forecast By Nature, 2025 to 2035
      • Organic
      • Conventional
    • Y-o-Y Growth Trend Analysis By Nature, 2020 to 2024
    • Absolute $ Opportunity Analysis By Nature, 2025 to 2035
  9. Global Market Analysis 2020 to 2024 and Forecast 2025 to 2035, By Region
    • Introduction
    • Historical Market Size Value (USD Million) Analysis By Region, 2020 to 2024
    • Current Market Size Value (USD Million) Analysis and Forecast By Region, 2025 to 2035
      • North America
      • Latin America
      • Western Europe
      • Eastern Europe
      • East Asia
      • South Asia and Pacific
      • Middle East & Africa
    • Market Attractiveness Analysis By Region
  10. North America Market Analysis 2020 to 2024 and Forecast 2025 to 2035, By Country
    • Historical Market Size Value (USD Million) Trend Analysis By Market Taxonomy, 2020 to 2024
    • Market Size Value (USD Million) Forecast By Market Taxonomy, 2025 to 2035
      • By Country
        • USA
        • Canada
        • Mexico
      • By Function
      • By End Use
      • By Nature
    • Market Attractiveness Analysis
      • By Country
      • By Function
      • By End Use
      • By Nature
    • Key Takeaways
  11. Latin America Market Analysis 2020 to 2024 and Forecast 2025 to 2035, By Country
    • Historical Market Size Value (USD Million) Trend Analysis By Market Taxonomy, 2020 to 2024
    • Market Size Value (USD Million) Forecast By Market Taxonomy, 2025 to 2035
      • By Country
        • Brazil
        • Chile
        • Rest of Latin America
      • By Function
      • By End Use
      • By Nature
    • Market Attractiveness Analysis
      • By Country
      • By Function
      • By End Use
      • By Nature
    • Key Takeaways
  12. Western Europe Market Analysis 2020 to 2024 and Forecast 2025 to 2035, By Country
    • Historical Market Size Value (USD Million) Trend Analysis By Market Taxonomy, 2020 to 2024
    • Market Size Value (USD Million) Forecast By Market Taxonomy, 2025 to 2035
      • By Country
        • Germany
        • UK
        • Italy
        • Spain
        • France
        • Nordic
        • BENELUX
        • Rest of Western Europe
      • By Function
      • By End Use
      • By Nature
    • Market Attractiveness Analysis
      • By Country
      • By Function
      • By End Use
      • By Nature
    • Key Takeaways
  13. Eastern Europe Market Analysis 2020 to 2024 and Forecast 2025 to 2035, By Country
    • Historical Market Size Value (USD Million) Trend Analysis By Market Taxonomy, 2020 to 2024
    • Market Size Value (USD Million) Forecast By Market Taxonomy, 2025 to 2035
      • By Country
        • Russia
        • Poland
        • Hungary
        • Balkan & Baltic
        • Rest of Eastern Europe
      • By Function
      • By End Use
      • By Nature
    • Market Attractiveness Analysis
      • By Country
      • By Function
      • By End Use
      • By Nature
    • Key Takeaways
  14. East Asia Market Analysis 2020 to 2024 and Forecast 2025 to 2035, By Country
    • Historical Market Size Value (USD Million) Trend Analysis By Market Taxonomy, 2020 to 2024
    • Market Size Value (USD Million) Forecast By Market Taxonomy, 2025 to 2035
      • By Country
        • China
        • Japan
        • South Korea
      • By Function
      • By End Use
      • By Nature
    • Market Attractiveness Analysis
      • By Country
      • By Function
      • By End Use
      • By Nature
    • Key Takeaways
  15. South Asia and Pacific Market Analysis 2020 to 2024 and Forecast 2025 to 2035, By Country
    • Historical Market Size Value (USD Million) Trend Analysis By Market Taxonomy, 2020 to 2024
    • Market Size Value (USD Million) Forecast By Market Taxonomy, 2025 to 2035
      • By Country
        • India
        • ASEAN
        • Australia & New Zealand
        • Rest of South Asia and Pacific
      • By Function
      • By End Use
      • By Nature
    • Market Attractiveness Analysis
      • By Country
      • By Function
      • By End Use
      • By Nature
    • Key Takeaways
  16. Middle East & Africa Market Analysis 2020 to 2024 and Forecast 2025 to 2035, By Country
    • Historical Market Size Value (USD Million) Trend Analysis By Market Taxonomy, 2020 to 2024
    • Market Size Value (USD Million) Forecast By Market Taxonomy, 2025 to 2035
      • By Country
        • Kingdom of Saudi Arabia
        • Other GCC Countries
        • Turkiye
        • South Africa
        • Other African Union
        • Rest of Middle East & Africa
      • By Function
      • By End Use
      • By Nature
    • Market Attractiveness Analysis
      • By Country
      • By Function
      • By End Use
      • By Nature
    • Key Takeaways
  17. Key Countries Market Analysis
    • USA
      • Pricing Analysis
      • Market Share Analysis, 2024
        • By Function
        • By End Use
        • By Nature
    • Canada
      • Pricing Analysis
      • Market Share Analysis, 2024
        • By Function
        • By End Use
        • By Nature
    • Mexico
      • Pricing Analysis
      • Market Share Analysis, 2024
        • By Function
        • By End Use
        • By Nature
    • Brazil
      • Pricing Analysis
      • Market Share Analysis, 2024
        • By Function
        • By End Use
        • By Nature
    • Chile
      • Pricing Analysis
      • Market Share Analysis, 2024
        • By Function
        • By End Use
        • By Nature
    • Germany
      • Pricing Analysis
      • Market Share Analysis, 2024
        • By Function
        • By End Use
        • By Nature
    • UK
      • Pricing Analysis
      • Market Share Analysis, 2024
        • By Function
        • By End Use
        • By Nature
    • Italy
      • Pricing Analysis
      • Market Share Analysis, 2024
        • By Function
        • By End Use
        • By Nature
    • Spain
      • Pricing Analysis
      • Market Share Analysis, 2024
        • By Function
        • By End Use
        • By Nature
    • France
      • Pricing Analysis
      • Market Share Analysis, 2024
        • By Function
        • By End Use
        • By Nature
    • India
      • Pricing Analysis
      • Market Share Analysis, 2024
        • By Function
        • By End Use
        • By Nature
    • ASEAN
      • Pricing Analysis
      • Market Share Analysis, 2024
        • By Function
        • By End Use
        • By Nature
    • Australia & New Zealand
      • Pricing Analysis
      • Market Share Analysis, 2024
        • By Function
        • By End Use
        • By Nature
    • China
      • Pricing Analysis
      • Market Share Analysis, 2024
        • By Function
        • By End Use
        • By Nature
    • Japan
      • Pricing Analysis
      • Market Share Analysis, 2024
        • By Function
        • By End Use
        • By Nature
    • South Korea
      • Pricing Analysis
      • Market Share Analysis, 2024
        • By Function
        • By End Use
        • By Nature
    • Russia
      • Pricing Analysis
      • Market Share Analysis, 2024
        • By Function
        • By End Use
        • By Nature
    • Poland
      • Pricing Analysis
      • Market Share Analysis, 2024
        • By Function
        • By End Use
        • By Nature
    • Hungary
      • Pricing Analysis
      • Market Share Analysis, 2024
        • By Function
        • By End Use
        • By Nature
    • Kingdom of Saudi Arabia
      • Pricing Analysis
      • Market Share Analysis, 2024
        • By Function
        • By End Use
        • By Nature
    • Turkiye
      • Pricing Analysis
      • Market Share Analysis, 2024
        • By Function
        • By End Use
        • By Nature
    • South Africa
      • Pricing Analysis
      • Market Share Analysis, 2024
        • By Function
        • By End Use
        • By Nature
  18. Market Structure Analysis
    • Competition Dashboard
    • Competition Benchmarking
    • Market Share Analysis of Top Players
      • By Regional
      • By Function
      • By End Use
      • By Nature
  19. Competition Analysis
    • Competition Deep Dive
      • Keyur Industries
        • Overview
        • Product Portfolio
        • Profitability by Market Segments (Product/Age /Sales Channel/Region)
        • Sales Footprint
        • Strategy Overview
          • Marketing Strategy
          • Product Strategy
          • Channel Strategy
      • JYOT Overseas Pvt. Ltd.
      • Atlas Industries
      • Satnam Psyllium Industries
      • Abhyuday Industries
      • Shree Mahalaxmi Psyllium Pvt. Ltd.
      • Rajganga Agro Product Pvt. Ltd.
      • Jyotindra International
      • Ispasen Remedies
      • Shubh Psyllium Industries
      • Others
  20. Assumptions & Acronyms Used
  21. Research Methodology

List of Tables

  • Table 1: Global Market Value (USD Million) Forecast by Region, 2020-2035
  • Table 2: Global Market Value (USD Million) Forecast by Function , 2020-2035
  • Table 3: Global Market Value (USD Million) Forecast by End Use, 2020-2035
  • Table 4: Global Market Value (USD Million) Forecast by Nature, 2020-2035
  • Table 5: North America Market Value (USD Million) Forecast by Country, 2020-2035
  • Table 6: North America Market Value (USD Million) Forecast by Function , 2020-2035
  • Table 7: North America Market Value (USD Million) Forecast by End Use, 2020-2035
  • Table 8: North America Market Value (USD Million) Forecast by Nature, 2020-2035
  • Table 9: Latin America Market Value (USD Million) Forecast by Country, 2020-2035
  • Table 10: Latin America Market Value (USD Million) Forecast by Function , 2020-2035
  • Table 11: Latin America Market Value (USD Million) Forecast by End Use, 2020-2035
  • Table 12: Latin America Market Value (USD Million) Forecast by Nature, 2020-2035
  • Table 13: Western Europe Market Value (USD Million) Forecast by Country, 2020-2035
  • Table 14: Western Europe Market Value (USD Million) Forecast by Function , 2020-2035
  • Table 15: Western Europe Market Value (USD Million) Forecast by End Use, 2020-2035
  • Table 16: Western Europe Market Value (USD Million) Forecast by Nature, 2020-2035
  • Table 17: Eastern Europe Market Value (USD Million) Forecast by Country, 2020-2035
  • Table 18: Eastern Europe Market Value (USD Million) Forecast by Function , 2020-2035
  • Table 19: Eastern Europe Market Value (USD Million) Forecast by End Use, 2020-2035
  • Table 20: Eastern Europe Market Value (USD Million) Forecast by Nature, 2020-2035
  • Table 21: East Asia Market Value (USD Million) Forecast by Country, 2020-2035
  • Table 22: East Asia Market Value (USD Million) Forecast by Function , 2020-2035
  • Table 23: East Asia Market Value (USD Million) Forecast by End Use, 2020-2035
  • Table 24: East Asia Market Value (USD Million) Forecast by Nature, 2020-2035
  • Table 25: South Asia and Pacific Market Value (USD Million) Forecast by Country, 2020-2035
  • Table 26: South Asia and Pacific Market Value (USD Million) Forecast by Function , 2020-2035
  • Table 27: South Asia and Pacific Market Value (USD Million) Forecast by End Use, 2020-2035
  • Table 28: South Asia and Pacific Market Value (USD Million) Forecast by Nature, 2020-2035
  • Table 29: Middle East & Africa Market Value (USD Million) Forecast by Country, 2020-2035
  • Table 30: Middle East & Africa Market Value (USD Million) Forecast by Function , 2020-2035
  • Table 31: Middle East & Africa Market Value (USD Million) Forecast by End Use, 2020-2035
  • Table 32: Middle East & Africa Market Value (USD Million) Forecast by Nature, 2020-2035

List of Figures

  • Figure 1: Global Market Pricing Analysis
  • Figure 2: Global Market Value (USD Million) Forecast 2020-2035
  • Figure 3: Global Market Value Share and BPS Analysis by Function , 2025 and 2035
  • Figure 4: Global Market Y-o-Y Growth Comparison by Function , 2025-2035
  • Figure 5: Global Market Attractiveness Analysis by Function
  • Figure 6: Global Market Value Share and BPS Analysis by End Use, 2025 and 2035
  • Figure 7: Global Market Y-o-Y Growth Comparison by End Use, 2025-2035
  • Figure 8: Global Market Attractiveness Analysis by End Use
  • Figure 9: Global Market Value Share and BPS Analysis by Nature, 2025 and 2035
  • Figure 10: Global Market Y-o-Y Growth Comparison by Nature, 2025-2035
  • Figure 11: Global Market Attractiveness Analysis by Nature
  • Figure 12: Global Market Value (USD Million) Share and BPS Analysis by Region, 2025 and 2035
  • Figure 13: Global Market Y-o-Y Growth Comparison by Region, 2025-2035
  • Figure 14: Global Market Attractiveness Analysis by Region
  • Figure 15: North America Market Incremental Dollar Opportunity, 2025-2035
  • Figure 16: Latin America Market Incremental Dollar Opportunity, 2025-2035
  • Figure 17: Western Europe Market Incremental Dollar Opportunity, 2025-2035
  • Figure 18: Eastern Europe Market Incremental Dollar Opportunity, 2025-2035
  • Figure 19: East Asia Market Incremental Dollar Opportunity, 2025-2035
  • Figure 20: South Asia and Pacific Market Incremental Dollar Opportunity, 2025-2035
  • Figure 21: Middle East & Africa Market Incremental Dollar Opportunity, 2025-2035
  • Figure 22: North America Market Value Share and BPS Analysis by Country, 2025 and 2035
  • Figure 23: North America Market Value Share and BPS Analysis by Function , 2025 and 2035
  • Figure 24: North America Market Y-o-Y Growth Comparison by Function , 2025-2035
  • Figure 25: North America Market Attractiveness Analysis by Function
  • Figure 26: North America Market Value Share and BPS Analysis by End Use, 2025 and 2035
  • Figure 27: North America Market Y-o-Y Growth Comparison by End Use, 2025-2035
  • Figure 28: North America Market Attractiveness Analysis by End Use
  • Figure 29: North America Market Value Share and BPS Analysis by Nature, 2025 and 2035
  • Figure 30: North America Market Y-o-Y Growth Comparison by Nature, 2025-2035
  • Figure 31: North America Market Attractiveness Analysis by Nature
  • Figure 32: Latin America Market Value Share and BPS Analysis by Country, 2025 and 2035
  • Figure 33: Latin America Market Value Share and BPS Analysis by Function , 2025 and 2035
  • Figure 34: Latin America Market Y-o-Y Growth Comparison by Function , 2025-2035
  • Figure 35: Latin America Market Attractiveness Analysis by Function
  • Figure 36: Latin America Market Value Share and BPS Analysis by End Use, 2025 and 2035
  • Figure 37: Latin America Market Y-o-Y Growth Comparison by End Use, 2025-2035
  • Figure 38: Latin America Market Attractiveness Analysis by End Use
  • Figure 39: Latin America Market Value Share and BPS Analysis by Nature, 2025 and 2035
  • Figure 40: Latin America Market Y-o-Y Growth Comparison by Nature, 2025-2035
  • Figure 41: Latin America Market Attractiveness Analysis by Nature
  • Figure 42: Western Europe Market Value Share and BPS Analysis by Country, 2025 and 2035
  • Figure 43: Western Europe Market Value Share and BPS Analysis by Function , 2025 and 2035
  • Figure 44: Western Europe Market Y-o-Y Growth Comparison by Function , 2025-2035
  • Figure 45: Western Europe Market Attractiveness Analysis by Function
  • Figure 46: Western Europe Market Value Share and BPS Analysis by End Use, 2025 and 2035
  • Figure 47: Western Europe Market Y-o-Y Growth Comparison by End Use, 2025-2035
  • Figure 48: Western Europe Market Attractiveness Analysis by End Use
  • Figure 49: Western Europe Market Value Share and BPS Analysis by Nature, 2025 and 2035
  • Figure 50: Western Europe Market Y-o-Y Growth Comparison by Nature, 2025-2035
  • Figure 51: Western Europe Market Attractiveness Analysis by Nature
  • Figure 52: Eastern Europe Market Value Share and BPS Analysis by Country, 2025 and 2035
  • Figure 53: Eastern Europe Market Value Share and BPS Analysis by Function , 2025 and 2035
  • Figure 54: Eastern Europe Market Y-o-Y Growth Comparison by Function , 2025-2035
  • Figure 55: Eastern Europe Market Attractiveness Analysis by Function
  • Figure 56: Eastern Europe Market Value Share and BPS Analysis by End Use, 2025 and 2035
  • Figure 57: Eastern Europe Market Y-o-Y Growth Comparison by End Use, 2025-2035
  • Figure 58: Eastern Europe Market Attractiveness Analysis by End Use
  • Figure 59: Eastern Europe Market Value Share and BPS Analysis by Nature, 2025 and 2035
  • Figure 60: Eastern Europe Market Y-o-Y Growth Comparison by Nature, 2025-2035
  • Figure 61: Eastern Europe Market Attractiveness Analysis by Nature
  • Figure 62: East Asia Market Value Share and BPS Analysis by Country, 2025 and 2035
  • Figure 63: East Asia Market Value Share and BPS Analysis by Function , 2025 and 2035
  • Figure 64: East Asia Market Y-o-Y Growth Comparison by Function , 2025-2035
  • Figure 65: East Asia Market Attractiveness Analysis by Function
  • Figure 66: East Asia Market Value Share and BPS Analysis by End Use, 2025 and 2035
  • Figure 67: East Asia Market Y-o-Y Growth Comparison by End Use, 2025-2035
  • Figure 68: East Asia Market Attractiveness Analysis by End Use
  • Figure 69: East Asia Market Value Share and BPS Analysis by Nature, 2025 and 2035
  • Figure 70: East Asia Market Y-o-Y Growth Comparison by Nature, 2025-2035
  • Figure 71: East Asia Market Attractiveness Analysis by Nature
  • Figure 72: South Asia and Pacific Market Value Share and BPS Analysis by Country, 2025 and 2035
  • Figure 73: South Asia and Pacific Market Value Share and BPS Analysis by Function , 2025 and 2035
  • Figure 74: South Asia and Pacific Market Y-o-Y Growth Comparison by Function , 2025-2035
  • Figure 75: South Asia and Pacific Market Attractiveness Analysis by Function
  • Figure 76: South Asia and Pacific Market Value Share and BPS Analysis by End Use, 2025 and 2035
  • Figure 77: South Asia and Pacific Market Y-o-Y Growth Comparison by End Use, 2025-2035
  • Figure 78: South Asia and Pacific Market Attractiveness Analysis by End Use
  • Figure 79: South Asia and Pacific Market Value Share and BPS Analysis by Nature, 2025 and 2035
  • Figure 80: South Asia and Pacific Market Y-o-Y Growth Comparison by Nature, 2025-2035
  • Figure 81: South Asia and Pacific Market Attractiveness Analysis by Nature
  • Figure 82: Middle East & Africa Market Value Share and BPS Analysis by Country, 2025 and 2035
  • Figure 83: Middle East & Africa Market Value Share and BPS Analysis by Function , 2025 and 2035
  • Figure 84: Middle East & Africa Market Y-o-Y Growth Comparison by Function , 2025-2035
  • Figure 85: Middle East & Africa Market Attractiveness Analysis by Function
  • Figure 86: Middle East & Africa Market Value Share and BPS Analysis by End Use, 2025 and 2035
  • Figure 87: Middle East & Africa Market Y-o-Y Growth Comparison by End Use, 2025-2035
  • Figure 88: Middle East & Africa Market Attractiveness Analysis by End Use
  • Figure 89: Middle East & Africa Market Value Share and BPS Analysis by Nature, 2025 and 2035
  • Figure 90: Middle East & Africa Market Y-o-Y Growth Comparison by Nature, 2025-2035
  • Figure 91: Middle East & Africa Market Attractiveness Analysis by Nature
  • Figure 92: Global Market - Tier Structure Analysis
  • Figure 93: Global Market - Company Share Analysis
Dashboard
Dashboard
Dashboard
Dashboard
Dashboard
Dashboard

Full Research Suite comprises of:

Market outlook & trends analysis

Market outlook & trends analysis

Interviews & case studies

Interviews & case studies

Strategic recommendations

Strategic recommendations

Vendor profiles & capabilities analysis

Vendor profiles & capabilities analysis

5-year forecasts

5-year forecasts

8 regions and 60+ country-level data splits

8 regions and 60+ country-level data splits

Market segment data splits

Market segment data splits

12 months of continuous data updates

12 months of continuous data updates

DELIVERED AS:

PDF EXCEL ONLINE

Full Research Suite


$3500

$5000

$6500

Buy Report Now
Similar Industry Reports

Similar Industry Reports

Seed Paper Bag Market

Seed Paper Bag Market Size and Share Forecast Outlook 2025 to 2035

Seed Processing Equipment Market

Seed Processing Equipment Market Size and Share Forecast Outlook 2025 to 2035

Seed Treatment Materials Market

Seed Treatment Materials Market Size and Share Forecast Outlook 2025 to 2035

Seed Biostimulants Market

Seed Biostimulants Market Size and Share Forecast Outlook 2025 to 2035

Seed Health Market
Seed Health Market

Seed Health Market Size and Share Forecast Outlook 2025 to 2035

Seed Additives Market

Seed Additives Market Analysis - Size and Share Forecast Outlook 2025 to 2035

Seed Coating Material Market

Seed Coating Material Market Analysis - Size, Share, and Forecast 2025 to 2035

Seed Packaging Market

Seed Packaging Market Analysis – Growth & Forecast 2025 to 2035

Seed Binders Market
Seed Binders Market

Seed Binders Market Analysis - Size, Share & Forecast 2025 to 2035

Seed Cracker Market Share Analysis

Market Share Breakdown of Seed Cracker Manufacturers

Seed Polymer Market
Seed Polymer Market

Seed Polymer Market

Seed Testing Services Market

Seed Testing Services Market Growth – Trends & Forecast 2018-2028

Teaseed Cake Market
Teaseed Cake Market

Teaseed Cake Market – Trends & Forecast 2025 to 2035

Linseed Oil Market
Linseed Oil Market

The Linseed Oil Market is Analysis by Nature, Product Type, Application, and Region from 2025 to 2035

Rapeseed Protein Market

Rapeseed Protein Market Size and Share Forecast Outlook 2025 to 2035

Flaxseed Gum Market
Flaxseed Gum Market

Flaxseed Gum Market Size and Share Forecast Outlook 2025 to 2035

Rapeseed Oil Market
Rapeseed Oil Market

Rapeseed Oil Market Size and Share Forecast Outlook 2025 to 2035

Rapeseed Meal Market

Rapeseed Meal Market Analysis by Type, Application, Nature, and Region Through 2035

Hempseed Milk Market

Analysis and Growth Projections for Hempseed Milk Business

Rapeseed Protein Market Share Analysis

Assessing Rapeseed Protein Market Share & Industry Trends

Future Market Insights

Psyllium Seed Market

Chat With MaRIA

Chat With

MaRIA

Hi There, I am MaRIA, Your Market Research Intelligence Assistant. How may I help you?