Thermoformed Plastics Market Outlook (2022 to 2032)

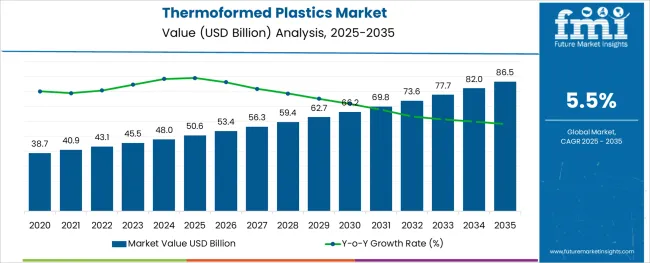
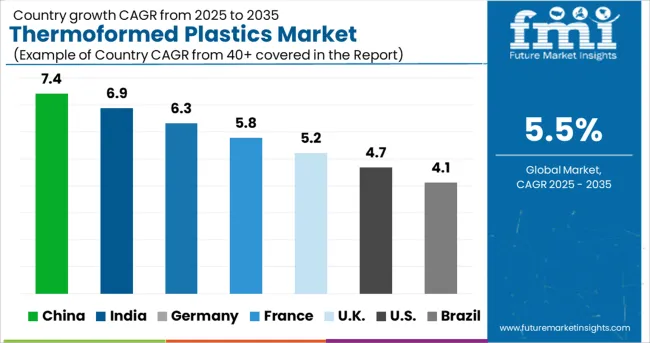
The global thermoformed plastics market is anticipated to reach a market valuation of US$ 66.16 Billion by the year 2032, flourishing at an average CAGR of 5.5% from 2022 to 2032. Though, the thermoformed plastics market share holds a revenue of US$ 40.86 Billion in 2022.

The fueling growth of the medical and pharmaceuticals industry with the integration of new advanced technology, using different types of plastic engineering at their manufacturing hubs are flourishing the growth of global thermoformed plastics

Attributes Value
Thermoformed Plastics Market Size (2022) US$ 40.86 Billion
Thermoformed Plastics Market Projected Size (2032) US$ 66.12 Billion
Thermoformed Plastics Market Value CAGR (2022 to 2032) 5.5%

Demand for thermoformed plastic is rising with the paradigm shift from two-dimensional polymers to three-dimensional polymers. The use of this type of plastic has increased in multiple manufacturing sectors due to environmental concerns. Thermoformed plastics can be defined as fabricated plastic that is transformed through the rising temperature, making it bendable for reshaping. A global study on thermoformed plastic at FMI explains the growing plastic business involving its use in construction, crockery, and the medical and pharmaceutical industry.

The thermoformed plastic market analysis explains that multiple regions are adopting safe plastic use including the recyclable use of it and making it less harmful to the environment and humans. For example, with the growing awareness compliance policy of governments pushing the manufacturing units to use recyclable plastics. This includes the use of thermoformed plastic in the healthcare and medical industry as most of the medical appliances and supplies hold a good amount of plastic use. Medical products like prefilled syringes, pharmaceutical bottles, and medical electronics. These supplies also involve capsules and tablet packing, formally known as blister packaging. Use of it in the construction industry thrives the thermoformed plastic market as it creates flooring, concrete, and furniture.

The thermoforming process sets through the fabrication of plastic sheets by beating and heating procedures. It has largely been used as a replacement for metal during procedures like the gauging process, expanding its applications in industrial equipment, aerospace, transportation, and medical devices, increasing the sale of thermoformed plastic.

The growing number of electric and petrol vehicles using hard plastic is also attributed to thermoformed plastic growth, using its qualities in manufacturing lightweight vehicles. The use of it in automobiles is set to thrive the demand for thermoformed plastic favoring lightweight vehicles.

Don't pay for what you don't need

Customize your report by selecting specific countries or regions and save 30%!

What are the Major Driving Factors for the Thermoformed Plastics Market?

The thermoformed plastic survey explains that the government initiatives, increasing plastic use coupled with the latest advanced technology increase the sales of thermoformed plastics. The increase in popularity of retail shopping and online shopping has pushed the demand for thermoformed plastic as it is applicable in the packaging of multiple brands. These e-retailing channels deliver goods to the end user through long sales and distribution channels. This takes a lot of precision and carefulness in packaging.

The chemical resistance quality of a certain class of plastics helps it in being used in chemical laboratories to store certain utensils and chemicals, including the vacuum plastic jars for the sortation of chemical products. These applications gain traction in the market, fueling the sales of thermoformed plastics.

Advanced technology like machine learning has provided substantial data that helps plastic manufacturers to produce plastic that has lower impacts on environmental degradation. Making it decomposable to some extent. The government setting up Research and Analysis programs to produce better plastic.

What are the Possible Limitations for the Thermoformed Plastics Market future Trends?

Thermoformed plastic outlook states that the fluctuating raw material costs coupled with environmental concerns and covid-19 implications have hampered the growth of thermoformed plastics market growth. The challenging process of gaining the thick form of plastic, including consistent product thickness. Another way that restricts the sales of thermoformed plastics is the alternatives expanding their market spaces. These alternatives are anticipated to hinder the growth of thermoformed plastic.

The covid-19 impacted different markets including the industries that were dealing with the manufacturing units, coupled with the logistics ban. This pushed down the growth of thermoformed plastic.

Nikhil Kaitwade
Nikhil Kaitwade

Principal Consultant

Talk to Analyst

Find your sweet spots for generating winning opportunities in this market.

Comparative View of Adjacent Thermoformed Plastics Market

Thermoformed Plastics Market:

Attributes Thermoformed Plastics Market
CAGR (2022 to 2032) 5.5%
Market Value (2022) US$ 40.86 Billion
Growth Factor Increased use of thermoformed plastics in the medical & pharmaceuticals industry coupled with high use of it inside manufacturing units.
Future Opportunities Transformation of plastic use is flourishing in the sector of new plastic production including multi-dimensional plastic formation
Market Trends The latest technology is attributed to the advancements in plastic manufacturing

Rigid Plastic Market:

Attributes Rigid Plastic Market
CAGR (2022 to 2032) 4.7%
Market Value (2022) US$ 199.62 Billion
Growth Factor Consumption of rigid plastic has increased with the rising automobile and construction industry.
Future Opportunities Increased government spending, especially in the construction industry along with the research and development industry creates new opportunities for the market.
Market Trends E-commerce companies have set an upward trend for the rigid market, creating lucrative opportunities for the component markets.

Flexible Plastic Market:

Attributes Flexible Plastic Market
CAGR (2022 to 2032) 4.3%
Market Value (2022) US$ 175.50 Billion
Growth Factor The accelerated e-commerce industry along with cosmetic and personal care is pushing the sales of flexible plastic globally.
Future Opportunities New regulatory initiatives and packaging options create new opportunities for the flexible plastic market, adding bio-degradable plastic materials into the portfolio.
Market Trends The latest trends in the market are attributed to the developed packaging and offer extended shelf-life.

The integration of technology with plastic engineering increases the sales of thermoformed plastic. The manufacturing platforms are increasing the number of the thermoforming process. With the higher demand for lightweight vehicles, increasing the sales of thermoformed plastic. This demand for light vehicles has fueled the demand for thermoformed plastic.

Thermoformed plastic market growth is revolving around the trends that are related to plastic transformation, changing its dimensions, adding more layers to it, and making it more rigid. The new modern-age construction styles also want to consume a huge number of thermoformed plastics.

Packaged drinking water is another industry that pushes the demand for thermoformed plastic, increasing the consumption of single-layered thermoformed plastic into the manufacturing of various kinds of water bottles that come in different shapes. Though, most products available in hypermarkets or supermarkets are packed in different types of plastic packaging, fueling the sales of thermoformed plastic.

Category-wise Insights for Thermoformed Plastics Market

Which Type of Thermoformed Plastics Products Are Most Preferred in the Global Market?

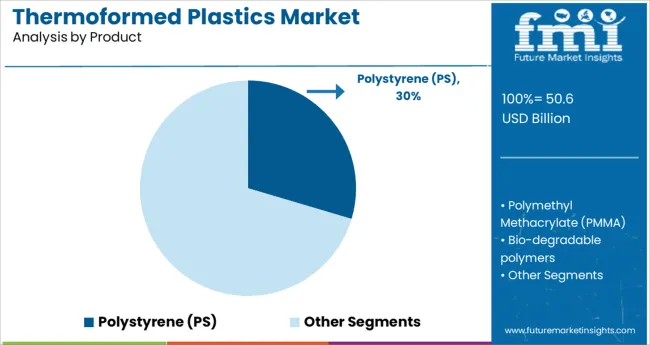
As per the new market research report on thermoformed plastics for the years 2022 to 2032, polypropylene is dominating the product segment and holds more than 21.0% of the share. This segment is likely to expand its use because of its increasing distribution channel and increased consumption. Other commonly used products of thermoformed plastic are polyethylene (PE), polystyrene (PS), and Polypropylene (PP). The growing number of manufacturers is also owing to the sales of Polypropylene. This played a driving factor in the sales of thermoformed plastics.

What are the Various Segments of the Global Thermoformed Plastics Market according to Process?

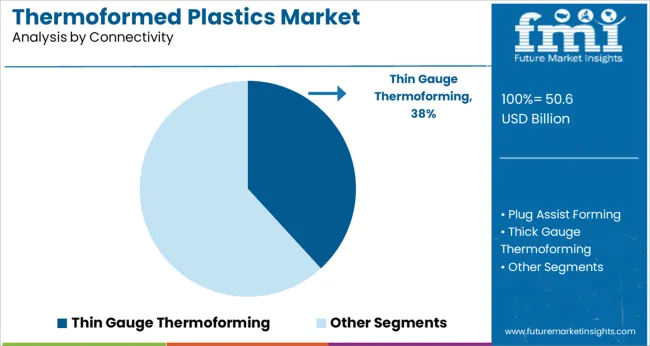
By process, the thermoformed plastics are distributed into plus assist forming thick gauge thermoforming, thin gauge thermoforming, and vacuum snapback. These segments are performed differently in different regions. The thin-gauge thermoformed plastic segment is likely to dominate the process category while holding sales through the process. It holds a 35% revenue share in the global thermoformed plastics market. Thermoformed plastics are made through radiant, contact, and hot air heating techniques, adding new sales of thermoformed plastics.

What are the Major Applications of the Global Thermoformed Plastics Market?

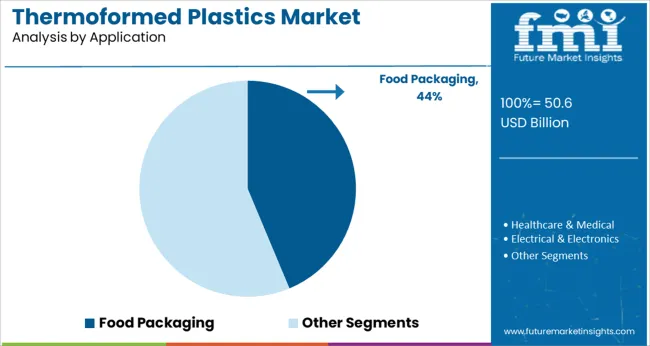
Food packaging is the leading application segment in the thermoformed plastics market. The other segments of the application are healthcare & medical, food packaging, electrical & electronics, automotive, construction, and consumer goods & appliances. The food packaging segment holds 42% of the global revenue. The factors contributing to the growth of this segment are the most commonly used food packaging, including high-quality packaging materials and bacteria-free plastic crockery and packaging.
Get the data you need at a Fraction of the cost

Personalize your report by choosing insights you need
and save 40%!

Regional Analysis of the Thermoformed Plastics Market

The thermoformed plastics market survey divides the market into regions; North America, Latin America, Asia Pacific, Middle East and Africa, and Europe. The biggest and highest-growing market is the USA, holding a 53.8% share of the global market. The region is likely to hold a major share through 2032. The growing manufacturing and suppliers of thermoformed plastics in the region are attributed to the high consumption. Increasing food and e-commerce industry are also pushing the demand for thermoformed plastics in the region. Other regions like the Asia Pacific include the second highest growing region for the Thermoformed plastics market.
Competitive Landscape for the Thermoformed Plastics Market

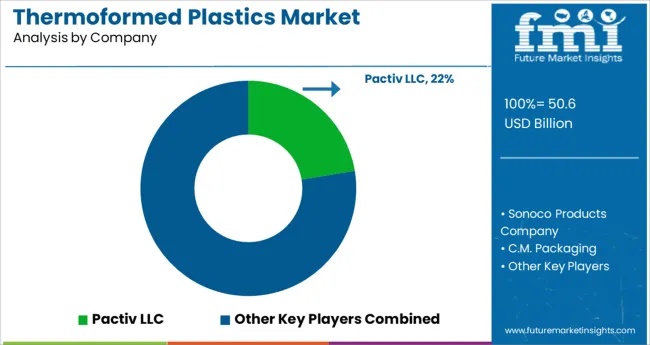
Thermoformed plastics market has various key competitors that focus on expanding their sales channel and opening up new distribution networks. The key players are currently focusing on the variety of thermoformed plastics. This makes the competitive landscape more dynamic and versatile, owing to the expansion of thermoformed plastics market size.

The key players attributing to the growth of thermoformed plastics are Greiner Packaging GmbH; Dongguan Ditai Plastic Products Co., Ltd; Palram Americas Ltd, Pactiv LLC; Genpak LLC; Sonoco Products Company; CM Packaging; Placon Corporation; Anchor Packaging LLC; Brentwood Industries.

Recent Developments in Global Thermoformed plastics Market

  • Greiner Packaging GmbH, under its sustainability prospects, has launched new thermoformed plastic solutions to cater to multiple industries like medical, pharmaceuticals, and food. The self-separating cup named K 3 r100 has been in news lately, appreciated for its green future program.
  • Palram Americans Ltd has distributed its produced plastic channels into Acrylic, PVC, and Polycarbonate that define their own characteristics, applicable to various industries. It has also expanded its manufacturing units with high demand for thermoformed plastics.
  • Completing more those 55 years in the industry, Brentwood has expanded its business segments including Battery, Building and construction, cooling tower, medical and custom forming. This has pushed the demand for thermoformed plastics.

Global Thermoformed plastics Market Key Players

  • Greiner Packaging GmbH
  • Dongguan Ditai Plastic Products Co Ltd
  • Palram Americas Ltd
  • Pactiv LLC
  • Genpak LLC
  • Sonoco Products Company
  • CM Packaging
  • Placon Corporation
  • Anchor Packaging LLC
  • Brentwood Industries

Thermoformed plastics Market by Segmentation

By Product:

  • Polymethyl Methacrylate (PMMA)
  • Bio-degradable polymers
  • Polyethylene (PE)
  • Acrylonitrile Butadiene Styrene (ABS)
  • Poly Vinyl Chloride (PVC)
  • High Impact Polystyrene (HIPS)
  • Polystyrene (PS)
  • Polypropylene (PP)

By Connectivity:

  • Plug Assist Forming
  • Thick Gauge Thermoforming
  • Thin Gauge Thermoforming
  • Vacuum Snapback

By Application:

  • Healthcare & Medical
  • Food Packaging
  • Electrical & Electronics
  • Automotive
  • Construction
  • Consumer Goods & Appliances

By Region:

  • North America
  • Latin America
  • Europe
  • East Asia
  • South Asia
  • Oceania
  • Middle East and Africa

Frequently Asked Questions

At What Rate will the Thermoformed Plastics Market Grow?

The thermoformed plastics market is expected to grow at 5.5% CAGR from 2022 to 2032.

What is the Net Worth of the Global Thermoformed Plastics Market?

The thermoformed plastics market is estimated to be around US$ 40.86 Billion in 2022.

What is the Projected Value of the Thermoformed Plastics Market?

The Thermoformed plastics market is anticipated to reach a valuation of US$ 66.16 Billion by 2032.

Which is the Best Performing Product Type of the Thermoformed plastics Market?

The polypropylene segment is predicted to hold the largest market share by product type in the thermoformed plastics market.

Which is the Rapidly Growing Region for the Thermoformed plastics Market?

North American region is the most dominating region for thermoformed plastics market.

Table of Content
1. Executive Summary | Thermoformed Plastics Market

    1.1. Global Market Outlook

    1.2. Demand-side Trends

    1.3. Supply-side Trends

    1.4. Technology Roadmap Analysis

    1.5. Analysis and Recommendations

2. Market Overview

    2.1. Market Coverage / Taxonomy

    2.2. Market Definition / Scope / Limitations

3. Market Background

    3.1. Market Dynamics

        3.1.1. Drivers

        3.1.2. Restraints

        3.1.3. Opportunity

        3.1.4. Trends

    3.2. Scenario Forecast

        3.2.1. Demand in Optimistic Scenario

        3.2.2. Demand in Likely Scenario

        3.2.3. Demand in Conservative Scenario

    3.3. Opportunity Map Analysis

    3.4. Product Life Cycle Analysis

    3.5. Supply Chain Analysis

        3.5.1. Supply Side Participants and Their Roles

            3.5.1.1. Producers

            3.5.1.2. Mid-Level Participants (Traders/ Agents/ Brokers)

            3.5.1.3. Wholesalers and Distributors

        3.5.2. Value Added and Value Created at Node in the Supply Chain

        3.5.3. List of Raw Material Suppliers

        3.5.4. List of Existing and Potential Buyers

    3.6. Investment Feasibility Matrix

    3.7. Value Chain Analysis

        3.7.1. Profit Margin Analysis

        3.7.2. Wholesalers and Distributors

        3.7.3. Retailers

    3.8. PESTLE and Porter’s Analysis

    3.9. Regulatory Landscape

        3.9.1. By Key Regions

        3.9.2. By Key Countries

    3.10. Regional Parent Market Outlook

    3.11. Production and Consumption Statistics

    3.12. Import and Export Statistics

4. Global Market Analysis 2017 to 2021 and Forecast, 2022 to 2032

    4.1. Historical Market Size Value (US$ Million) & Volume (Tons) Analysis, 2017 to 2021

    4.2. Current and Future Market Size Value (US$ Million) & Volume (Tons) Projections, 2022 to 2032

        4.2.1. Y-o-Y Growth Trend Analysis

        4.2.2. Absolute $ Opportunity Analysis

5. Global Market Analysis 2017 to 2021 and Forecast 2022 to 2032, By Product

    5.1. Introduction / Key Findings

    5.2. Historical Market Size Value (US$ Million) & Volume (Tons) Analysis By Product, 2017 to 2021

    5.3. Current and Future Market Size Value (US$ Million) & Volume (Tons) Analysis and Forecast By Product, 2022 to 2032

        5.3.1. Polymethyl Methacrylate (PMMA)

        5.3.2. Bio-degradable Polymers

        5.3.3. Polyethylene (PE)

        5.3.4. Acrylonitrile Butadiene Styrene (ABS)

        5.3.5. Poly Vinyl Chloride (PVC)

        5.3.6. High Impact Polystyrene (HIPS)

        5.3.7. Polystyrene (PS)

        5.3.8. Polypropylene (PP)

    5.4. Y-o-Y Growth Trend Analysis By Product, 2017 to 2021

    5.5. Absolute $ Opportunity Analysis By Product, 2022 to 2032

6. Global Market Analysis 2017 to 2021 and Forecast 2022 to 2032, By Process

    6.1. Introduction / Key Findings

    6.2. Historical Market Size Value (US$ Million) & Volume (Tons) Analysis By Process, 2017 to 2021

    6.3. Current and Future Market Size Value (US$ Million) & Volume (Tons) Analysis and Forecast By Process, 2022 to 2032

        6.3.1. Plug Assist Forming

        6.3.2. Thick Gauge Thermoforming

        6.3.3. Thin Gauge Thermoforming

        6.3.4. Vacuum Snapback

    6.4. Y-o-Y Growth Trend Analysis By Process, 2017 to 2021

    6.5. Absolute $ Opportunity Analysis By Process, 2022 to 2032

7. Global Market Analysis 2017 to 2021 and Forecast 2022 to 2032, By Application

    7.1. Introduction / Key Findings

    7.2. Historical Market Size Value (US$ Million) & Volume (Tons) Analysis By Application, 2017 to 2021

    7.3. Current and Future Market Size Value (US$ Million) & Volume (Tons) Analysis and Forecast By Application, 2022 to 2032

        7.3.1. Healthcare & Medical

        7.3.2. Food Packaging

        7.3.3. Electrical & Electronics

        7.3.4. Automotive

        7.3.5. Construction

        7.3.6. Consumer Goods & Appliances

    7.4. Y-o-Y Growth Trend Analysis By Application, 2017 to 2021

    7.5. Absolute $ Opportunity Analysis By Application, 2022 to 2032

8. Global Market Analysis 2017 to 2021 and Forecast 2022 to 2032, By Region

    8.1. Introduction

    8.2. Historical Market Size Value (US$ Million) & Volume (Tons) Analysis By Region, 2017 to 2021

    8.3. Current Market Size Value (US$ Million) & Volume (Tons) Analysis and Forecast By Region, 2022 to 2032

        8.3.1. North America

        8.3.2. Latin America

        8.3.3. Europe

        8.3.4. Asia Pacific

        8.3.5. Middle East and Africa

    8.4. Market Attractiveness Analysis By Region

9. North America Market Analysis 2017 to 2021 and Forecast 2022 to 2032, By Country

    9.1. Historical Market Size Value (US$ Million) & Volume (Tons) Trend Analysis By Market Taxonomy, 2017 to 2021

    9.2. Market Size Value (US$ Million) & Volume (Tons) Forecast By Market Taxonomy, 2022 to 2032

        9.2.1. By Country

            9.2.1.1. USA

            9.2.1.2. Canada

        9.2.2. By Product

        9.2.3. By Process

        9.2.4. By Application

    9.3. Market Attractiveness Analysis

        9.3.1. By Country

        9.3.2. By Product

        9.3.3. By Process

        9.3.4. By Application

    9.4. Key Takeaways

10. Latin America Market Analysis 2017 to 2021 and Forecast 2022 to 2032, By Country

    10.1. Historical Market Size Value (US$ Million) & Volume (Tons) Trend Analysis By Market Taxonomy, 2017 to 2021

    10.2. Market Size Value (US$ Million) & Volume (Tons) Forecast By Market Taxonomy, 2022 to 2032

        10.2.1. By Country

            10.2.1.1. Brazil

            10.2.1.2. Mexico

            10.2.1.3. Rest of Latin America

        10.2.2. By Product

        10.2.3. By Process

        10.2.4. By Application

    10.3. Market Attractiveness Analysis

        10.3.1. By Country

        10.3.2. By Product

        10.3.3. By Process

        10.3.4. By Application

    10.4. Key Takeaways

11. Europe Market Analysis 2017 to 2021 and Forecast 2022 to 2032, By Country

    11.1. Historical Market Size Value (US$ Million) & Volume (Tons) Trend Analysis By Market Taxonomy, 2017 to 2021

    11.2. Market Size Value (US$ Million) & Volume (Tons) Forecast By Market Taxonomy, 2022 to 2032

        11.2.1. By Country

            11.2.1.1. Germany

            11.2.1.2. United Kingdom

            11.2.1.3. France

            11.2.1.4. Spain

            11.2.1.5. Italy

            11.2.1.6. Rest of Europe

        11.2.2. By Product

        11.2.3. By Process

        11.2.4. By Application

    11.3. Market Attractiveness Analysis

        11.3.1. By Country

        11.3.2. By Product

        11.3.3. By Process

        11.3.4. By Application

    11.4. Key Takeaways

12. Asia Pacific Market Analysis 2017 to 2021 and Forecast 2022 to 2032, By Country

    12.1. Historical Market Size Value (US$ Million) & Volume (Tons) Trend Analysis By Market Taxonomy, 2017 to 2021

    12.2. Market Size Value (US$ Million) & Volume (Tons) Forecast By Market Taxonomy, 2022 to 2032

        12.2.1. By Country

            12.2.1.1. China

            12.2.1.2. Japan

            12.2.1.3. South Korea

            12.2.1.4. Malaysia

            12.2.1.5. Singapore

            12.2.1.6. Australia

            12.2.1.7. New Zealand

            12.2.1.8. Rest of Asia Pacific

        12.2.2. By Product

        12.2.3. By Process

        12.2.4. By Application

    12.3. Market Attractiveness Analysis

        12.3.1. By Country

        12.3.2. By Product

        12.3.3. By Process

        12.3.4. By Application

    12.4. Key Takeaways

13. Middle East and Africa Market Analysis 2017 to 2021 and Forecast 2022 to 2032, By Country

    13.1. Historical Market Size Value (US$ Million) & Volume (Tons) Trend Analysis By Market Taxonomy, 2017 to 2021

    13.2. Market Size Value (US$ Million) & Volume (Tons) Forecast By Market Taxonomy, 2022 to 2032

        13.2.1. By Country

            13.2.1.1. GCC Countries

            13.2.1.2. South Africa

            13.2.1.3. Israel

            13.2.1.4. Rest of Middle East and Africa

        13.2.2. By Product

        13.2.3. By Process

        13.2.4. By Application

    13.3. Market Attractiveness Analysis

        13.3.1. By Country

        13.3.2. By Product

        13.3.3. By Process

        13.3.4. By Application

    13.4. Key Takeaways

14. Key Countries Market Analysis

    14.1. USA

        14.1.1. Pricing Analysis

        14.1.2. Market Share Analysis, 2021

            14.1.2.1. By Product

            14.1.2.2. By Process

            14.1.2.3. By Application

    14.2. Canada

        14.2.1. Pricing Analysis

        14.2.2. Market Share Analysis, 2021

            14.2.2.1. By Product

            14.2.2.2. By Process

            14.2.2.3. By Application

    14.3. Brazil

        14.3.1. Pricing Analysis

        14.3.2. Market Share Analysis, 2021

            14.3.2.1. By Product

            14.3.2.2. By Process

            14.3.2.3. By Application

    14.4. Mexico

        14.4.1. Pricing Analysis

        14.4.2. Market Share Analysis, 2021

            14.4.2.1. By Product

            14.4.2.2. By Process

            14.4.2.3. By Application

    14.5. Germany

        14.5.1. Pricing Analysis

        14.5.2. Market Share Analysis, 2021

            14.5.2.1. By Product

            14.5.2.2. By Process

            14.5.2.3. By Application

    14.6. United Kingdom

        14.6.1. Pricing Analysis

        14.6.2. Market Share Analysis, 2021

            14.6.2.1. By Product

            14.6.2.2. By Process

            14.6.2.3. By Application

    14.7. France

        14.7.1. Pricing Analysis

        14.7.2. Market Share Analysis, 2021

            14.7.2.1. By Product

            14.7.2.2. By Process

            14.7.2.3. By Application

    14.8. Spain

        14.8.1. Pricing Analysis

        14.8.2. Market Share Analysis, 2021

            14.8.2.1. By Product

            14.8.2.2. By Process

            14.8.2.3. By Application

    14.9. Italy

        14.9.1. Pricing Analysis

        14.9.2. Market Share Analysis, 2021

            14.9.2.1. By Product

            14.9.2.2. By Process

            14.9.2.3. By Application

    14.10. China

        14.10.1. Pricing Analysis

        14.10.2. Market Share Analysis, 2021

            14.10.2.1. By Product

            14.10.2.2. By Process

            14.10.2.3. By Application

    14.11. Japan

        14.11.1. Pricing Analysis

        14.11.2. Market Share Analysis, 2021

            14.11.2.1. By Product

            14.11.2.2. By Process

            14.11.2.3. By Application

    14.12. South Korea

        14.12.1. Pricing Analysis

        14.12.2. Market Share Analysis, 2021

            14.12.2.1. By Product

            14.12.2.2. By Process

            14.12.2.3. By Application

    14.13. Malaysia

        14.13.1. Pricing Analysis

        14.13.2. Market Share Analysis, 2021

            14.13.2.1. By Product

            14.13.2.2. By Process

            14.13.2.3. By Application

    14.14. Singapore

        14.14.1. Pricing Analysis

        14.14.2. Market Share Analysis, 2021

            14.14.2.1. By Product

            14.14.2.2. By Process

            14.14.2.3. By Application

    14.15. Australia

        14.15.1. Pricing Analysis

        14.15.2. Market Share Analysis, 2021

            14.15.2.1. By Product

            14.15.2.2. By Process

            14.15.2.3. By Application

    14.16. New Zealand

        14.16.1. Pricing Analysis

        14.16.2. Market Share Analysis, 2021

            14.16.2.1. By Product

            14.16.2.2. By Process

            14.16.2.3. By Application

    14.17. GCC Countries

        14.17.1. Pricing Analysis

        14.17.2. Market Share Analysis, 2021

            14.17.2.1. By Product

            14.17.2.2. By Process

            14.17.2.3. By Application

    14.18. South Africa

        14.18.1. Pricing Analysis

        14.18.2. Market Share Analysis, 2021

            14.18.2.1. By Product

            14.18.2.2. By Process

            14.18.2.3. By Application

    14.19. Israel

        14.19.1. Pricing Analysis

        14.19.2. Market Share Analysis, 2021

            14.19.2.1. By Product

            14.19.2.2. By Process

            14.19.2.3. By Application

15. Market Structure Analysis

    15.1. Competition Dashboard

    15.2. Competition Benchmarking

    15.3. Market Share Analysis of Top Players

        15.3.1. By Regional

        15.3.2. By Product

        15.3.3. By Process

        15.3.4. By Application

16. Competition Analysis

    16.1. Competition Deep Dive

        16.1.1. Pactiv LLC

            16.1.1.1. Overview

            16.1.1.2. Product Portfolio

            16.1.1.3. Profitability by Market Segments

            16.1.1.4. Sales Footprint

            16.1.1.5. Strategy Overview

                16.1.1.5.1. Marketing Strategy

                16.1.1.5.2. Product Strategy

                16.1.1.5.3. Channel Strategy

        16.1.2. Sonoco Products Company

            16.1.2.1. Overview

            16.1.2.2. Product Portfolio

            16.1.2.3. Profitability by Market Segments

            16.1.2.4. Sales Footprint

            16.1.2.5. Strategy Overview

                16.1.2.5.1. Marketing Strategy

                16.1.2.5.2. Product Strategy

                16.1.2.5.3. Channel Strategy

        16.1.3. C.M. Packaging

            16.1.3.1. Overview

            16.1.3.2. Product Portfolio

            16.1.3.3. Profitability by Market Segments

            16.1.3.4. Sales Footprint

            16.1.3.5. Strategy Overview

                16.1.3.5.1. Marketing Strategy

                16.1.3.5.2. Product Strategy

                16.1.3.5.3. Channel Strategy

        16.1.4. Placon Corporation

            16.1.4.1. Overview

            16.1.4.2. Product Portfolio

            16.1.4.3. Profitability by Market Segments

            16.1.4.4. Sales Footprint

            16.1.4.5. Strategy Overview

                16.1.4.5.1. Marketing Strategy

                16.1.4.5.2. Product Strategy

                16.1.4.5.3. Channel Strategy

        16.1.5. Genpak, LLC

            16.1.5.1. Overview

            16.1.5.2. Product Portfolio

            16.1.5.3. Profitability by Market Segments

            16.1.5.4. Sales Footprint

            16.1.5.5. Strategy Overview

                16.1.5.5.1. Marketing Strategy

                16.1.5.5.2. Product Strategy

                16.1.5.5.3. Channel Strategy

        16.1.6. Anchor Packaging

            16.1.6.1. Overview

            16.1.6.2. Product Portfolio

            16.1.6.3. Profitability by Market Segments

            16.1.6.4. Sales Footprint

            16.1.6.5. Strategy Overview

                16.1.6.5.1. Marketing Strategy

                16.1.6.5.2. Product Strategy

                16.1.6.5.3. Channel Strategy

        16.1.7. Brentwood Industries, Inc.

            16.1.7.1. Overview

            16.1.7.2. Product Portfolio

            16.1.7.3. Profitability by Market Segments

            16.1.7.4. Sales Footprint

            16.1.7.5. Strategy Overview

                16.1.7.5.1. Marketing Strategy

                16.1.7.5.2. Product Strategy

                16.1.7.5.3. Channel Strategy

        16.1.8. Greiner Packaging International GmbH

            16.1.8.1. Overview

            16.1.8.2. Product Portfolio

            16.1.8.3. Profitability by Market Segments

            16.1.8.4. Sales Footprint

            16.1.8.5. Strategy Overview

                16.1.8.5.1. Marketing Strategy

                16.1.8.5.2. Product Strategy

                16.1.8.5.3. Channel Strategy

17. Assumptions & Acronyms Used

18. Research Methodology
Recommendations

Chemicals & Materials

Wood Plastic Composite Market

April 2016

REP-GB-1372

May 2024

301 pages

Explore Chemicals & Materials Insights

View Reports
Future Market Insights

Thermoformed Plastics Market