The Biopharma Plastics Market is estimated to be valued at USD 6.7 billion in 2025 and is projected to reach USD 19.8 billion by 2035, registering a compound annual growth rate (CAGR) of 11.4% over the forecast period.
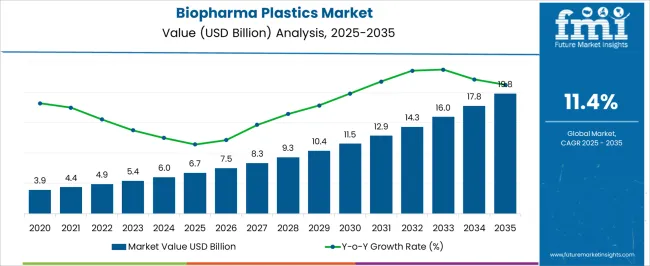
| Metric | Value |
|---|---|
| Biopharma Plastics Market Estimated Value in (2025 E) | USD 6.7 billion |
| Biopharma Plastics Market Forecast Value in (2035 F) | USD 19.8 billion |
| Forecast CAGR (2025 to 2035) | 11.4% |
The biopharma plastics market is expanding rapidly due to the increasing demand for sterile, durable, and chemically resistant materials in pharmaceutical production and handling. The growth of biologics, personalized medicine, and complex drug formulations has necessitated advanced packaging and containment solutions that comply with strict regulatory standards.
Plastics offer critical benefits such as reduced contamination risk, lightweight properties, and compatibility with high precision molding for single use systems. The emphasis on operational efficiency and hygiene in biopharma processing is further boosting the use of disposable components including tubing, containers, and protective barriers.
Moreover, the growing adoption of automation and closed system bioprocessing has increased reliance on specialized polymers. The outlook remains positive as pharmaceutical manufacturers prioritize safety, flexibility, and scalability in production while meeting global compliance mandates.
The market is segmented by Polymer Type and Application and region. By Polymer Type, the market is divided into Polyethylene – PE, Polypropylene – PP, Acrylonitrile Butadiene Styrene – ABS, Polyethylene Terephthalate – PET, Polyvinyl Chloride – PVC, Polytetrafluoroethylene – PTFE, and Other. In terms of Application, the market is classified into Protective Wear, Container, Bioreactor Bags, Syringes, Depth Filter, Disposable Medical Connectors, and Others. Regionally, the market is classified into North America, Latin America, Western Europe, Eastern Europe, Balkan & Baltic Countries, Russia & Belarus, Central Asia, East Asia, South Asia & Pacific, and the Middle East & Africa.
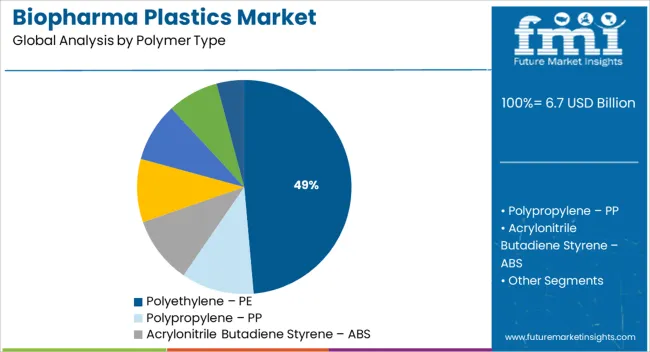
Polyethylene holds 48.60% of the total revenue in the polymer type category, establishing it as the leading segment. This dominance is attributed to its excellent chemical resistance, flexibility, and ease of processing which are essential in sterile pharmaceutical environments.
Polyethylene is widely used in the manufacturing of containers, tubing, films, and liners due to its low extractables and leachables profile, which ensures product purity and regulatory compliance. Its cost effectiveness and availability in various grades suitable for high purity applications have further contributed to its widespread adoption.
As the demand for reliable and compliant material solutions increases, polyethylene continues to be the preferred choice for critical applications across the biopharma value chain.
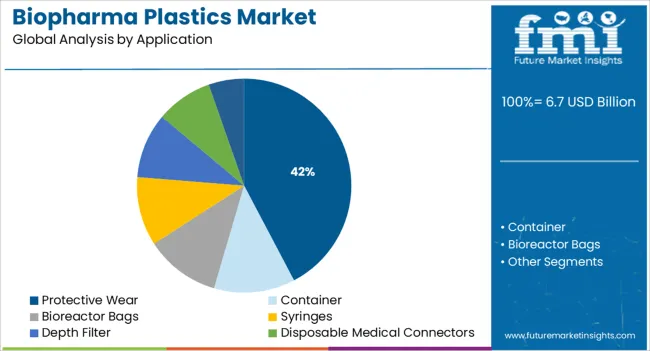
Protective wear is projected to represent 42.30% of the total market revenue by 2025 under the application category, making it the dominant segment. This is driven by heightened safety standards in pharmaceutical manufacturing and the need for personal protection in sterile and cleanroom environments.
The use of plastic based protective wear such as gowns, gloves, masks, and aprons has become essential to prevent cross contamination and ensure compliance with GMP protocols. Increased production of biologics and vaccines, especially under accelerated timelines, has emphasized the importance of disposable and contamination free protective solutions.
As regulatory agencies tighten requirements for operator and product safety, demand for high quality protective wear continues to rise, reinforcing its position as the leading application in the biopharma plastics market.
The biopharma plastics market is expected to gain market growth in the forecast period of 2025 to 2035. Latest market analysis by FMI the market is to grow at a CAGR of 11.4% in the above-mentioned forecast period.
The COVID-19 pandemic has affected positively the Biopharma Plastics Market. During this pandemic, there was an immense requirement from the hospitals for biopharma plastic-based products such as syringes, gloves, and masks resulting in the surging demand for biopharma plastics polymers
The usage of biopharma plastics in various end-use industries is expanding as technology is developing all the time. Manufacturers are interested in investing in the research and development of biopharma plastics to boost the downstream usability of these materials in sectors such as healthcare, agriculture, packaging, and others.
Technological Advancements in Healthcare to boost the biopharma plastics market growth
Biopharma plastics are being utilized for providing higher stability to several applications including depth filters, syringes, and containers. Increased preference for use of high-grade polymers material in the construction of single-use biopharma plastics has fuelled the market growth.
Different types of polymer have several applications including depth filters, syringes, and containers. The market offers opportunities for the usage of a variety of polymer types such as PP, PE, PET, PTFE, and ABS as these polymer types are used for manufacturing biopharma plastic components including personal equipment (PPE), face masks, gloves, and gowns.
Increasing health concerns and growth in healthcare expenditure are expected to drive the market for biopharma plastics along with polymers. Moreover, the presence of large-scale PP molding facilities and the manufacturing sector is projected to propel the market growth over the forecast period. Industry leaders are investing heavily in Research and Development to provide biopharmaceutical products that suit every aspect of consumer needs, which is driving the biopharma plastics market.
Increasing Investments in Single-Use Products to drive the growth of the Global Biopharma Plastics Market
The increasing investments in single-use products for pharmaceutical processing are expected to fuel the growth of global biopharma plastics over the forecast period.
The global biopharma plastics market is being driven by prominent factors such as a rise in the incidence of chronic illnesses such as cancer and diabetes, as well as the increasing global adoption of single-use plastics.
Rapid advancements by prominent players toward constant innovations backed by technologies in the field of biopharmaceuticals act as one of the major factors strongly supporting the global growth of the biopharma plastics market.
Although the biopharma plastics market has numerous end-uses, there are some obstacles that likely pose a challenge to market growth during the forecast period.
Patented production processes and high raw material costs have made it difficult for new companies to enter the biopharma plastics industry. The widespread accessibility of alternatives and strict regulatory environment is also hampering the biopharma plastics market growth.
Increased advancement in medical technology to propel the market growth
North America is expected to register a CAGR of 11.6% in the biopharma plastics market, with the USA market for biopharma plastics contributing higher revenue, due to an increase in the number of healthcare facilities and advancements in medical technology.
The North American biopharma plastics market growth will be further fuelled by the increasing demand for these plastics in pharmaceutical packaging applications, itself due to the booming pharmaceutical industry in Canada. Additionally, many medical component and device manufacturers in the USA are adopting biopharma plastics in their products. Another significant element propelling the market in the nations is the existence of leading manufacturers and suppliers of medical-grade plastics.
The presence of key manufacturers of biopharma plastics such as Celanese Corporation, Eastman Chemical Co., and DuPont can be regarded as one of the leading factors driving the market in the country. Additionally, strong purchasing power coupled with high technological acceptance is a major factor for market growth in the region.
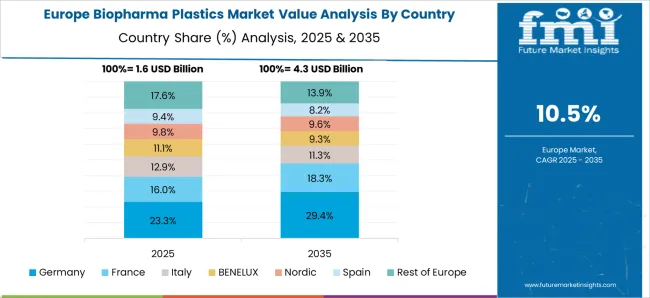
The Europe biopharma plastics market is expected to rise at a CAGR of 11.4% from 2025 to 2035. Europe is the second-largest shareholder in the market, mainly due to the growing political support and favorable reimbursement regulations for medical devices.
Additionally, updates to the region's medical device directives will improve the effectiveness, innovation potential, and safety of medical products. As a result, the demand for better medical devices would rise, which will likely have a favorable impact on the market.
Asia Pacific is likely to dominate the biopharma plastics market owing to rapidly growing industries in emerging economies such as India, China, and South Korea. Asia Pacific region has high demand and high manufacturing capacity due to the large population.
Asia-Pacific is expected to deliver impressive outcomes in the global biopharma plastics market. A large amount of investment, significant government meddling in the healthcare sector, and significant development in the developing economy all contribute to increased demand for biopharma plastics.
Furthermore, advancements in healthcare infrastructure, rising government spending on healthcare policies, and the presence of important members in Asia Pacific all contribute to the growth of the global biopharma plastics market.
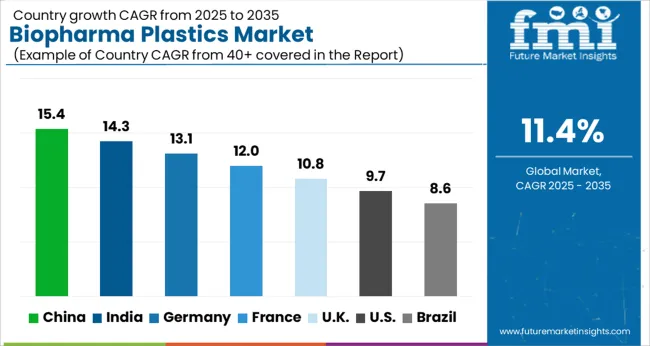
| Country | CAGR |
|---|---|
| China | 15.4% |
| India | 14.3% |
| Germany | 13.1% |
| France | 12% |
| UK | 10.8% |
| USA | 9.7% |
| Brazil | 8.6% |
Polyvinyl chloride (PVC) dominated the market
Among all the polymer types polyvinyl chloride segment dominates the global market. Polyvinyl chloride accounted for more than 21.5% share of the overall revenue in 2025.
Polyvinyl chloride has the ability to undergo many processes without breaking or cracking, which accounts for its multiple uses in the market. It is extremely flexible, resistant, and can easily withstand high temperatures, making it suitable for the production of syringes, disposable connectors, depth filters, and other applications of biopharma plastics.
The presence of large-scale PP molding facilities and the manufacturing sector is projected to propel the market growth over the forecast period. Other polymer types such as polyethylene and polytetrafluoroethylene are mainly used in various applications owing to their properties such as gloss, durability, and detergent resistance all these factors are likely to boost market growth over the forecast period.
Syringes Segment remains dominant among other types
Based on application, the global biopharma plastics market can be categorized into Protective wear, Container, Bioreactor Bags, Syringes, Depth Filter, Disposable Medical Connectors, and Others. The syringes segment accounts for a market share of 20.2% through 2025. The Increasing demand for prefilled syringes owing to their usage convenience, low costs, minimal microbial contamination, low injection errors, and dilution errors is expected to boost the growth of the market.
Syringes are among the most popular healthcare products used by medical professionals to inject liquids and semi-solid compositions into the bodies of humans and animals. They are also used for withdrawing fluids as well for cleaning wounds or body cavities. The increased need for technically advanced healthcare and growing production of large molecules, and the rising expenditure for the development of advanced healthcare facilities are fueling the growth. The ease of usage and convenience offered by disposable biopharma plastic syringes boost the segment's growth.
How do New Entrants Contribute to the Biopharma Plastics Market?
With technological innovations happening at a rapid pace, and companies looking for ways to increase customer engagement, start-ups are taking all possible steps to establish a name for themselves in the biopharma plastics market.
Some of the start-ups in the biopharma plastics market include-
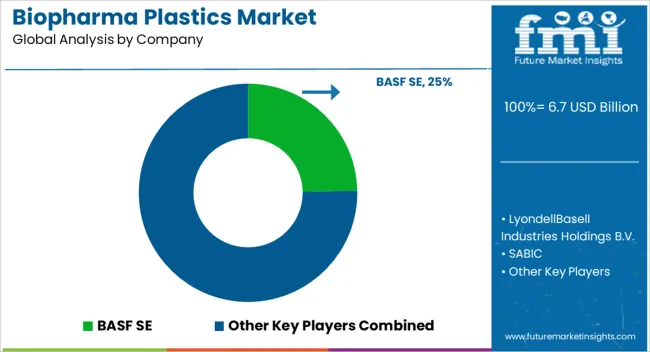
BASF SE, LyondellBasell Industries Holdings B.V., SABIC, LG chem, Toray Industries, Inc., Solvay, Dow, Inc., DuPont de Nemours, Inc., Saint-Gobain Performance Plastics, Tekni-Plex are some of the key players in the biopharma plastics industry.
The manufacturers are involved in the production of biopharma plastics in a larger capacity. Research and innovation are also conducted to launch innovative plastics for biopharmaceutical products. Also, some of the key players are acquiring small pharmaceutical companies to increase their production capacity.
| Report Attribute | Details |
|---|---|
| Growth Rate | CAGR of 11.4% from 2025 to 2035 |
| Expected Market Value (2025) | USD 6.7 billion |
| Projected Forecast Value (2035) | USD 19.8 billion |
| Base Year for Estimation | 2025 |
| Historical Data | 2020 to 2025 |
| Forecast Period | 2025 to 2035 |
| Quantitative Units | Revenue in USD Million & CAGR from 2025 to 2035 |
| Report Coverage | Revenue Forecast, Volume Forecast, Company Ranking, Competitive Landscape, Growth Factors, Trends & Pricing Analysis |
| Segments Covered | Polymer Type, Application, Regions |
| Regions Covered | North America; Latin America; Europe; Asia Pacific; Middle East & Africa |
| Key Countries Profiled | USA, Canada, Brazil, Mexico, Germany, United Kingdom, France, Spain, Italy, China, Japan, South Korea, Singapore, Thailand, Indonesia, Australia, New Zealand, GCC Countries, South Africa, Israel |
| Key Companies Profiled | BASF SE; LyondellBasell Industries Holdings B.V.; SABIC; LG Chem; Toray Industries, Inc.; Solvay; Dow, Inc.; DuPont de Nemours, Inc.; Saint-Gobain Performance Plastics; Tekni-Plex; Chevron Phillips Chemical Co. Ltd.; ExxonMobil Corporation; Formosa Plastics Corporation; Covestro AG; TEIJIN LIMITED; Mitsui & Co. Plastics Ltd.; INEOS Group; CHIMEI |
| Customization | Available Upon Request |
The global biopharma plastics market is estimated to be valued at USD 6.7 billion in 2025.
The market size for the biopharma plastics market is projected to reach USD 19.8 billion by 2035.
The biopharma plastics market is expected to grow at a 11.4% CAGR between 2025 and 2035.
The key product types in biopharma plastics market are polyethylene – pe, polypropylene – pp, acrylonitrile butadiene styrene – abs, polyethylene terephthalate – pet, polyvinyl chloride – pvc, polytetrafluoroethylene – ptfe and other.
In terms of application, protective wear segment to command 42.3% share in the biopharma plastics market in 2025.


Full Research Suite comprises of:
Market outlook & trends analysis
Interviews & case studies
Strategic recommendations
Vendor profiles & capabilities analysis
5-year forecasts
8 regions and 60+ country-level data splits
Market segment data splits
12 months of continuous data updates
DELIVERED AS:
PDF EXCEL ONLINE
Biopharmaceutical Fermentation Excipients Market Analysis - Size, Share, and Forecast Outlook 2025 to 2035
Biopharmaceutical Contract Manufacturing Market Analysis - Size, Share, and Forecast 2025 to 2035
Biopharmaceuticals Packaging Market Growth – Forecast 2025 to 2035
Biopharmaceutical Oral Drug Delivery Market
Plastics-To-Fuel (PTF) Market Size and Share Forecast Outlook 2025 to 2035
Bioplastics For Packaging Market Size and Share Forecast Outlook 2025 to 2035
Bioplastics Market Analysis - Size, Share & Forecast 2025 to 2035
Foam Plastics Market Size and Share Forecast Outlook 2025 to 2035
Medical Plastics Market Size and Share Forecast Outlook 2025 to 2035
Extruded Plastics Market Size and Share Forecast Outlook 2025 to 2035
Corn-Based Plastics for Packaging Market Size and Share Forecast Outlook 2025 to 2035
Conductive Plastics Market Growth - Trends & Forecast 2025 to 2035
Transparent Plastics Market Size and Share Forecast Outlook 2025 to 2035
Thermoformed Plastics Market Size and Share Forecast Outlook 2025 to 2035
Evaluating Algae-Based Bioplastics Market Share & Provider Insights
Breaking Down Market Share in the Fire Retardant Plastics Industry
Industry Share Analysis for Wire and Cable Plastics Companies
Algae-Based Bioplastics Market Analysis – Growth & Forecast 2024-2034
Starch-Based Bioplastics Packaging Market Insights - Growth & Forecast 2025 to 2035
Türkiye Medical Plastics Market Analysis by Plastic Type, End-Use, and Region through 2035

Thank you!
You will receive an email from our Business Development Manager. Please be sure to check your SPAM/JUNK folder too.
Chat With
MaRIA