The metal containers market is projected to grow from USD 140.3 billion in 2025 to USD 220.3 billion by 2035, registering a CAGR of 4.6% during the forecast period. Sales in 2024 reached USD 134.2 billion, reflecting a steady increase in demand across various industries.
This growth has been attributed to the rising need for durable and sustainable packaging solutions in sectors such as food and beverage, pharmaceuticals, and personal care. The increasing adoption of recyclable materials and the expansion of e-commerce have further propelled the market's expansion.
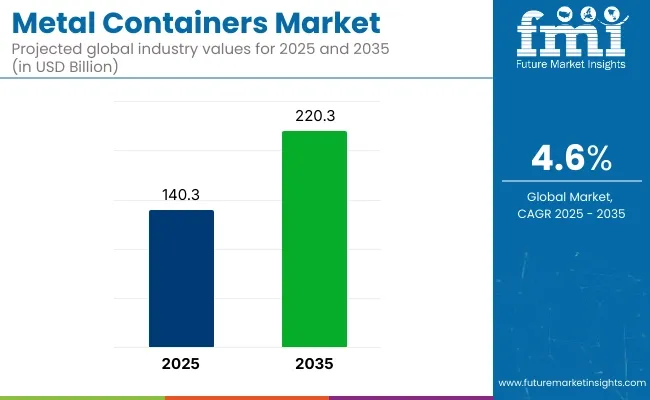
| Metric | Value |
|---|---|
| Market Size in 2025 | USD 140.3 Billion |
| Projected Market Size in 2035 | USD 220.3 Billion |
| CAGR (2025 to 2035) | 4.6% |
Significant investments have been made by leading companies to expand production capacities and develop innovative metal container solutions. Silgan Holdings Inc., a leading supplier of sustainable rigid packaging solutions for the world's essential consumer goods products, announced today that it has entered into a sale and purchase agreement to acquire Weener Plastics Holdings B.V., a leading producer of differentiated dispensing solutions for personal care, food and healthcare products.
“The proposed acquisition of Weener represents the continuation of our strategy to expand our global dispensing and specialty closures franchise and a clear example of the effectiveness of our disciplined capital allocation model to create value for our shareholders,” said Adam Greenlee, President and CEO.
The shift towards sustainable and environmentally friendly solutions has significantly influenced the metal containers market. Manufacturers have been focusing on developing containers that are recyclable, lightweight, and made from renewable resources. Innovations include the integration of biodegradable materials, modular designs, and the use of recycled metals to reduce environmental impact.
These advancements align with global sustainability goals and regulatory requirements, making metal containers an attractive option for environmentally conscious industries. Additionally, the development of automated manufacturing processes has enhanced efficiency and consistency in production, further driving market growth.
The metal containers market is poised for significant growth, driven by increasing demand in food and beverage, pharmaceuticals, and personal care industries. Companies investing in sustainable materials, innovative designs, and eco-friendly production processes are expected to gain a competitive edge.
As global supply chains expand and environmental regulations become more stringent, the adoption of metal containers is anticipated to rise, offering cost-effective and eco-friendly solutions for product packaging and storage. Furthermore, the integration of smart technologies and automation in metal container applications is expected to enhance operational efficiency and meet the evolving needs of various industries.
Steel containers are projected to account for approximately 48.6% of the global metal containers market by 2025, as they have been widely adopted for their high mechanical durability, corrosion resistance, and ability to preserve contents over long storage periods. Low-carbon and tin-plated steel variants have been predominantly used in the packaging of both solid and liquid goods across multiple industries.
Long-term shelf stability and product protection have been achieved through hermetically sealed steel cans and drums, particularly in food preservation, paints, adhesives, and bulk chemicals. Their recyclability and magnetic recoverability have made steel containers a sustainable option in closed-loop packaging systems.
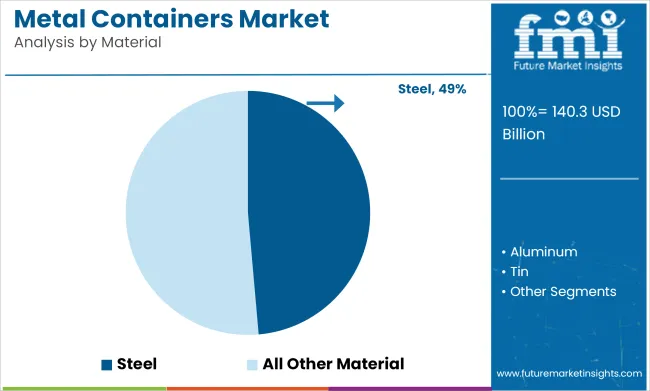
Steel containers have been manufactured in various sizes and formats, including cans, barrels, pails, and intermediate bulk containers, enabling their use across retail, industrial, and institutional supply chains. Compatibility with high-speed filling and sterilization processes has further reinforced their utility in mass production. As industries seek strong, secure, and recyclable packaging solutions, steel is expected to maintain its dominance within the metal container market, supported by ongoing technological improvements in coating, shaping, and weight reduction.
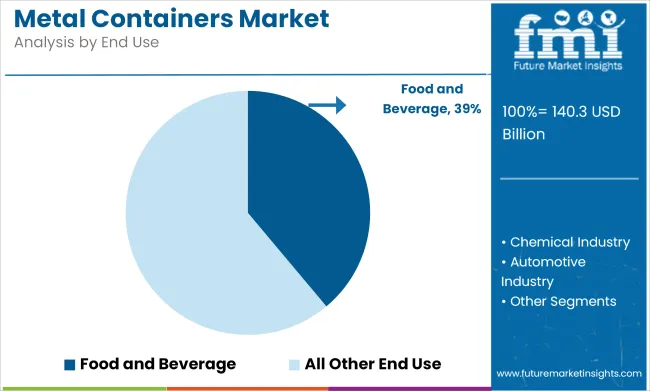
The food and beverage industry is expected to hold the largest share of the metal containers market by 2025, accounting for an estimated 38.9%, due to its reliance on metal packaging for product longevity, contamination prevention, and efficient distribution. A broad array of canned fruits, vegetables, meats, beverages, and prepared meals has been packaged using steel and aluminum containers to ensure product safety and market accessibility.
Steel cans have been utilized for both thermal and aseptic processing, allowing extended shelf life without refrigeration. Tamper resistance, light-proofing, and flavor preservation have been achieved, making metal containers the preferred format for food preservation.
In beverage applications, carbonated and non-carbonated drinks have been stored and transported using lightweight, recyclable metal bottles and cans. Branding through lithographic printing has also been implemented, supporting consumer engagement and product differentiation.
Global export standards and regulatory compliance requirements have been fulfilled through the use of metal packaging, particularly in regions with high demand for canned goods and limited cold chain infrastructure. As food security, storage efficiency, and sustainability become central to packaging strategies, metal containers in the food and beverage sector are expected to retain their leadership in end-use demand.
Challenges
Opportunities
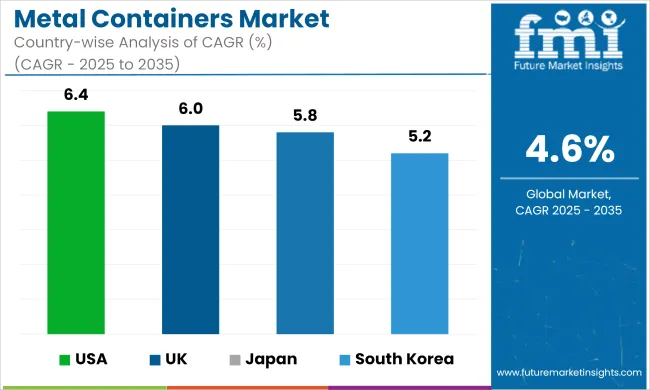
The USA leads the metal containers industry because of the growing need for strong, light, and recyclable packaging material in industries like food & beverages, pharmaceuticals, and chemicals. The focus on sustainability, along with stringent FDA regulations for food-grade packaging, is compelling innovation in aluminum and steel container production.
Businesses are spending money on AI-based production automation, corrosion-proof coatings, and improved embossing technologies to create greater durability and branding capabilities. The emphasis also on pushing the extended producer responsibility (EPR) schemes and the increased application of circular economy measures are pressuring firms to shift towards entirely recyclable and reusable metal container packaging.
| Country | CAGR (2025 to 2035) |
|---|---|
| United States | 6.4% |
The UK metal packaging market is growing steadily as companies emphasize sustainability, longer recyclability, and alignment with regulatory systems like the UK Plastic Packaging Tax. The surge in plastic-free packaging solutions is fueling the use of aluminum cans, tinplate packaging, and stainless steel packaging options.
Companies are concentrating on light-weight metal packaging, high-barrier coatings, and sustainable metal alloys to enhance performance and sustainability. Moreover, digital printing innovations, tamper-evident closure, and smart packaging technologies are improving traceability and consumer interaction. The increase in refill and reuse packaging sizes is also improving the UK market for metal containers.
| Country | CAGR (2025 to 2035) |
|---|---|
| United Kingdom | 6.0% |
Japan's metal containers market is witnessing consistent growth as a result of the country's high standards in precision engineering, packaging automation, and sustainability. Food, pharmaceutical, and cosmetic markets are driving demand for high-barrier, light-weight, and corrosion-resistant metal containers, fueling innovation. Ultra-thin aluminum containers, antimicrobial-coated tinplate packaging, and vacuum-sealed metal canisters are being designed by companies to ensure better product protection and shelf life.
Further, the sustainability push in Japan is pushing manufacturers to adopt bio-based coatings, AI-based defect detection, and energy-efficient metal forming processes. The move towards smart packaging solutions with RFID-based traceability and interactive branding is also pushing Japan's adoption of metal containers.
| Country | CAGR (2025 to 2035) |
|---|---|
| Japan | 5.8% |
South Korea's metal containers market is expanding fast with rising demand for high-performance, reusable, and sustainable packaging solutions. Plastic waste reduction policies, longer recycling programs, and green packaging innovations are spurring investments in aluminum and steel container manufacturing.
Firms are emphasizing ultra-lightweight aluminum alloys, high-strength tinplate cans, and bio-based protective coatings to boost performance and sustainability. Furthermore, development of AI-powered packaging automation, digital printing, and tamper-proof metal caps is streamlining efficiency in the manufacture of metal containers. Increasing trend toward reusable, stackable, and sealable metal packagings further supports the South Korean market.
| Country | CAGR (2025 to 2035) |
|---|---|
| South Korea | 5.2% |
The metal containers market is influenced by rising demand in food & beverage, pharmaceuticals, personal care, and industrial packaging applications. The market is witnessing innovation through new smart packaging technologies, such as ultra-light aluminum canisters, AI-powered defect detection, and RFID-enabled tracking, addressing concerns about efficiency, sustainability, and branding optimization.
Additionally, advancements in high-speed container fabrication and automated quality control systems are further shaping industry trends. The rising preference for plastic-free, high-barrier, and premium-quality metal containers is also contributing to market growth. Furthermore, increased investments in sustainable packaging integration, circular economy initiatives, and AI-enabled production monitoring are improving product efficiency and expanding market opportunities.
Companies are also exploring hybrid packaging solutions that integrate metal containers with compostable materials, smart tracking features, and high-barrier linings for enhanced usability. Additionally, collaborations between metal container manufacturers and luxury brands are driving the development of customized high-end packaging solutions tailored to diverse industry needs.
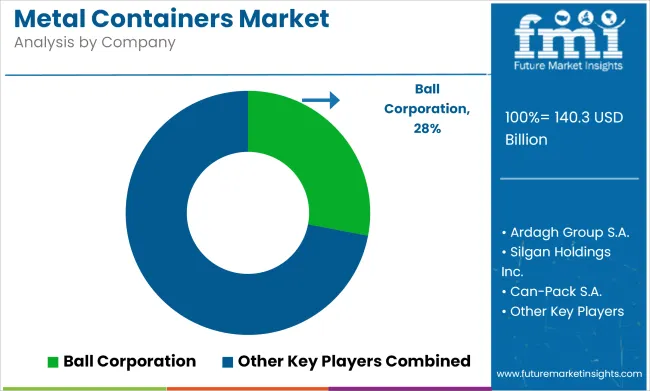
Other Key Players (45-55% Combined)
Several specialty metal container manufacturers contribute to the expanding market. These include:
The overall market size for the Metal Containers Market was USD 140.3 Billion in 2025.
The Metal Containers Market is expected to reach USD 220.3 Billion in 2035.
The market will be driven by increasing demand from food & beverage, pharmaceutical, and personal care industries. Innovations in AI-powered defect detection, lightweight metal fabrication, and improvements in recyclable and high-barrier metal containers will further propel market expansion.
Key challenges include fluctuating raw material costs, high energy consumption in manufacturing, and recyclability concerns. However, advancements in AI-driven quality control, solvent-free protective coatings, and lightweight aluminum can fabrication are addressing these concerns and supporting market growth.
North America and Europe are expected to dominate due to strong investment in sustainable packaging technologies, stringent regulatory frameworks, and high consumer demand for recyclable and tamper-proof metal containers. Meanwhile, Asia-Pacific is experiencing rapid growth driven by increasing industrialization, rising demand for high-end packaging, and expansion in manufacturing capabilities.


Our Research Products

The "Full Research Suite" delivers actionable market intel, deep dives on markets or technologies, so clients act faster, cut risk, and unlock growth.

The Leaderboard benchmarks and ranks top vendors, classifying them as Established Leaders, Leading Challengers, or Disruptors & Challengers.

Locates where complements amplify value and substitutes erode it, forecasting net impact by horizon

We deliver granular, decision-grade intel: market sizing, 5-year forecasts, pricing, adoption, usage, revenue, and operational KPIs—plus competitor tracking, regulation, and value chains—across 60 countries broadly.

Spot the shifts before they hit your P&L. We track inflection points, adoption curves, pricing moves, and ecosystem plays to show where demand is heading, why it is changing, and what to do next across high-growth markets and disruptive tech

Real-time reads of user behavior. We track shifting priorities, perceptions of today’s and next-gen services, and provider experience, then pace how fast tech moves from trial to adoption, blending buyer, consumer, and channel inputs with social signals (#WhySwitch, #UX).

Partner with our analyst team to build a custom report designed around your business priorities. From analysing market trends to assessing competitors or crafting bespoke datasets, we tailor insights to your needs.
Supplier Intelligence
Discovery & Profiling
Capacity & Footprint
Performance & Risk
Compliance & Governance
Commercial Readiness
Who Supplies Whom
Scorecards & Shortlists
Playbooks & Docs
Category Intelligence
Definition & Scope
Demand & Use Cases
Cost Drivers
Market Structure
Supply Chain Map
Trade & Policy
Operating Norms
Deliverables
Buyer Intelligence
Account Basics
Spend & Scope
Procurement Model
Vendor Requirements
Terms & Policies
Entry Strategy
Pain Points & Triggers
Outputs
Pricing Analysis
Benchmarks
Trends
Should-Cost
Indexation
Landed Cost
Commercial Terms
Deliverables
Brand Analysis
Positioning & Value Prop
Share & Presence
Customer Evidence
Go-to-Market
Digital & Reputation
Compliance & Trust
KPIs & Gaps
Outputs
Full Research Suite comprises of:
Market outlook & trends analysis
Interviews & case studies
Strategic recommendations
Vendor profiles & capabilities analysis
5-year forecasts
8 regions and 60+ country-level data splits
Market segment data splits
12 months of continuous data updates
DELIVERED AS:
PDF EXCEL ONLINE
Two Piece Metal Containers Market
Pressurized Metal Containers Market
Metallurgical Lighting Market Size and Share Forecast Outlook 2025 to 2035
Metal Evaporation Boat Market Size and Share Forecast Outlook 2025 to 2035
Metal Miniature Bone Plates Market Size and Share Forecast Outlook 2025 to 2035
Metal Locking Plate and Screw System Market Size and Share Forecast Outlook 2025 to 2035
Metal Pallet Market Size and Share Forecast Outlook 2025 to 2035
Metal Oxide Varistor (MOV) Surge Arresters Market Size and Share Forecast Outlook 2025 to 2035
Metal Straw Market Size and Share Forecast Outlook 2025 to 2035
Metal Can Market Size and Share Forecast Outlook 2025 to 2035
Metal IBC Market Forecast and Outlook 2025 to 2035
Metalized Barrier Film Market Forecast and Outlook 2025 to 2035
Metal Packaging Market Size and Share Forecast Outlook 2025 to 2035
Metal Bellow Market Size and Share Forecast Outlook 2025 to 2035
Metal based Safety Gratings Market Size and Share Forecast Outlook 2025 to 2035
Metal Modifiers Market Size and Share Forecast Outlook 2025 to 2035
Metallic Stearate Market Size and Share Forecast Outlook 2025 to 2035
Metallic Labels Market Size and Share Forecast Outlook 2025 to 2035
Metal Recycling Market Size and Share Forecast Outlook 2025 to 2035
Metal Forming Fluids Market Size and Share Forecast Outlook 2025 to 2035

Thank you!
You will receive an email from our Business Development Manager. Please be sure to check your SPAM/JUNK folder too.
Chat With
MaRIA