Metal-Free Pumps Market Size and Share Forecast Outlook 2025 to 2035

Between 2025 and 2035, the global metal-free pumps market is projected to expand steadily from USD 4.2 billion to USD 5.9 billion, reflecting a CAGR of 3.4%. Year-on-year, the market is expected to grow by approximately USD 0.14 to 0.19 billion, with the pace of growth gradually increasing due to compounding effects.
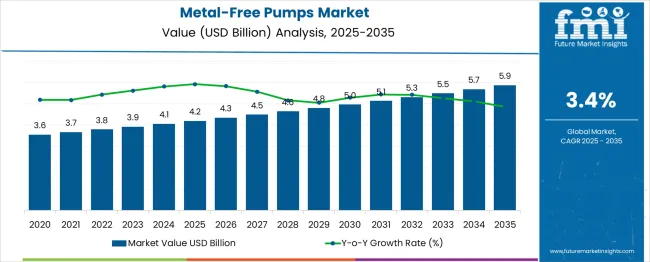
Quick Stats - Metal-Free Pumps Market

  • Metal-Free Pumps Market Size (2025): USD 4.2 billion
  • Projected Metal-Free Pumps Market Size (2035): USD 5.9 billion
  • Forecast CAGR of Metal-Free Pumps Market (2025-2035): 3.4%
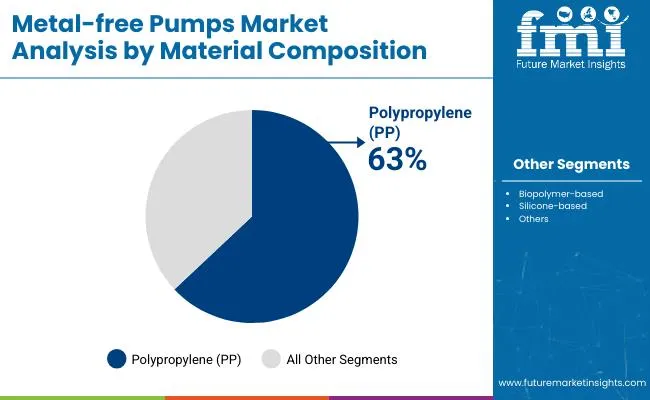
  • Leading Segment of Metal-Free Pumps Market (2025): Polypropylene (63%)
  • Key Growth Regions of Metal-Free Pumps Market: Germany, Japan, Canada
  • Top Key Players of Metal-Free Pumps Market: PSG Dover, Dellmeco, TKPC, Almatec, Aptar, CAPARDONI, PlastoMatic, Fti Air, Maxis, YTS

Metal Free Pumps Market Market Value Analysis

Metric Value
Industry Size (2025E) USD 4.2 billion
Industry Value (2035F) USD 5.9 billion
CAGR (2025 to 2035) 3.4%

This stable progression highlights steady demand for non-metallic pump solutions, especially in sectors such as chemicals, pharmaceuticals, and food processing, where corrosion resistance and contamination prevention are critical. Regulatory pressure and the growing emphasis on operational safety are also reinforcing adoption. The predictable growth pattern indicates a mature, resilient market with strong potential for long-term investment in specialized pump technologies designed for harsh or sensitive environments.

The industry holds a specialized but growing share within its parent industries. In the global industrial pumps market (USD 65 billion), metal-free variants account for 8-12%, gaining traction in corrosive fluid handling. The chemical processing industry represents 25-30% of demand, driven by need for corrosion-resistant solutions.

In pharmaceuticals/biotech (USD15 billion pump market), their share reaches 20-25% due to strict contamination standards. Water/wastewater treatment contributes 15-20% adoption for ultrapure and chemical dosing applications. The food/beverage sector shows 10-15% penetration, prioritizing hygienic polymer pumps. With a CAGR of 7.2% (2023-2030), growth is fueled by stricter regulations (FDA, EPA) and material innovation, though high costs (30-50% premium over metal pumps) limit wider adoption in price-sensitive markets.

Ben Ashe, CEO of MDM Pumps, highlighted the company’s commitment to innovation, stating, “Our passion for rigorous R&D in non-metallic centrifugal pumps has yielded disruptive technology that delivers unparalleled corrosion resistance and efficiency in the most aggressive fluid handling environments.”

This statement, featured in MDM’s July 2025 news update and podcast, reflects the company’s focus on redefining reliability standards across industries such as aquaculture, chemical processing, and environmental services. MDM’s non-metallic pump designs are engineered for high-corrosion applications, offering long service life and reduced maintenance.

Analyzing Metal-Free Pumps Market by Top Investment Segments

Metal Free Pumps Market Analysis By End Use Industry

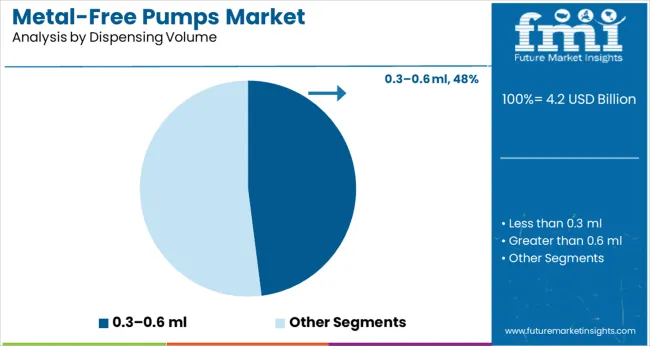
The industry is driven by rising demand for safe, non-reactive dispensing solutions in cosmetics and pharmaceuticals. Polypropylene leads material usage with 63% share, while mid-volume (0.3-0.6 ml) and lotion pumps dominate dispensing formats. Cosmetic applications account for the largest end-use, representing 41% of market share.

Metal Free Pumps Market Analysis By Material Composition

Polypropylene Pumps Lead in Lightweight, Corrosion-Free DesignsPolypropylene (PP) will remain the dominant material in metal-free pumps, accounting for 63% of the material composition in 2025. Known for its chemical resistance and moldability, PP is preferred for personal care and pharmaceutical liquids that require non-reactive containers.

Manufacturers like Aptar Group, Silgan Dispensing, and Albea use injection-molded PP for mist sprayers and airless pumps, ensuring compatibility with clean-label formulations. Its lightweight nature supports transport cost reduction, especially for global beauty exports.
  • PP offers up to 90% compatibility with acidic and alkaline fluids
  • Reduces pump unit weight by 15-18% compared to mixed-material pumps
  • Used in over 71% of airless packaging formats for skincare globally

Metal Free Pumps Market Analysis By Dispensing Volume

0.3-0.6 ml Pumps Dominate Precision Dispensing Market Dispensing volumes between 0.3 and 0.6 ml represent the largest share at 48%, driven by rising consumer demand for controlled, single-press dosing in cosmetics and nutraceuticals. Ideal for serums, gels, and lotions, this category balances product economy with user convenience.

Brands such as L'Oréal, Neutrogena, and Aveeno heavily rely on this pump range for skin and hair treatment products. The segment also benefits from growth in refillable pump packaging for luxury beauty.
  • Improves dosage precision by 35% over sub-0.3 ml dispensers
  • Installed in over 62% of global skincare lines launched in 2024
  • Pump accuracy deviation below ±5%, supporting pharma applications

Lotion Pumps Remain Consumer Favorite Across Applications

Metal Free Pumps Market Analysis By Pump Type

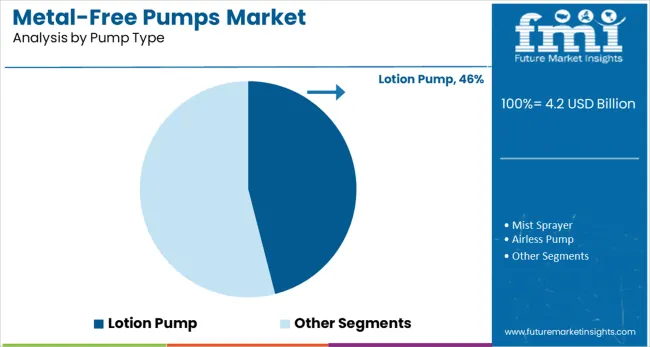
Lotion pumps will continue to dominate pump type segmentation, holding a 46% share in 2025, due to their versatility across skincare, pharma, and homecare. Companies like Raepak, Frapak, and Bona Pharma offer lotion pumps with up-lock or down-lock mechanisms, supporting leak-proof packaging and clean dispensing. Their ability to handle higher viscosity products makes them ideal for creams, moisturizers, and hair masks, especially in refillable and recyclable formats.
  • Found in 3 out of 5 skincare bottles globally
  • Compatible with viscosities ranging from 1,000-10,000 cPs
  • Used by over 80% of refill-based cosmetic brands in Europe

Natural Cosmetics Drive Demand for Clean Dispensing Solutions

Metal Free Pumps Market Analysis By Application

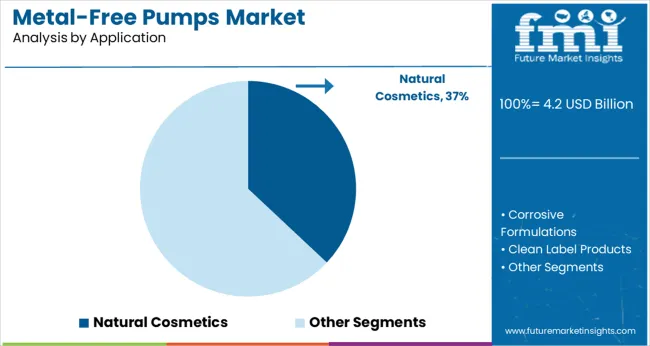
Natural cosmetics will drive substantial growth, accounting for 37% of metal-free pump applications in 2025. The segment favors metal-free systems to avoid contamination risks and support clean-label positioning. Firms like The Ordinary, Drunk Elephant, and Herbivore Botanicals use airless and PP-based pumps to preserve preservative-free formulas. These pumps enable oxygen exclusion and consistent output without metal springs or components that could degrade organic formulations.
  • 100% metal-free packaging compliance in over 58% of organic skincare SKUs
  • Demand for pumps in preservative-free products grew 19% YoY (2024)
  • Preferred for products with pH between 4.5 and 6.5 to maintain stability

Cosmetic Packaging Holds Top Spot in End-Use IndustriesCosmetics will dominate the end-use landscape, making up 41% of total demand for metal-free pumps in 2025. The push for green, visually aesthetic, and non-contaminating pumps is highest in skincare and haircare.

Leading cosmetic groups such as Estée Lauder, Shiseido, and Unilever are transitioning toward recyclable pumps in glass and biopolymer containers. The growth of DTC beauty brands has also increased demand for tamper-evident and dose-specific dispensing.

  • Used in 86% of facial skincare and sun care packaging formats
  • Recyclable cosmetic pumps saw 23% YoY growth in 2024
  • Average unit sales of metal-free pumps for cosmetics crossed 11 billion in 2025

Top Metal-Free Pumps Market Dynamics

The industry is expanding as chemical resistance, contamination control, and compliance needs increase across pharmaceuticals, semiconductors, and food processing. With fluoropolymer demand rising 7.8% in 2024, pump sales climbed in high-purity applications, while shifts in solvent handling standards and supply chain sourcing patterns continued to influence equipment upgrades.

High-Purity Demands Shaping Procurement Across Critical SectorsMetal-free pump units saw a 10.3% increase in shipments across pharmaceutical and specialty chemical verticals in 2024. Perfluoroalkoxy (PFA) and PTFE-based pump bodies accounted for 71.6% of units deployed in corrosive fluid environments. Cleanroom manufacturing zones drove a 13.9% rise in demand for non-metallic diaphragm pumps to meet strict extractables limits. Semiconductor fabs in Taiwan and South Korea expanded installation of contact-free drive systems to minimize particle generation during slurry transfer.

Regulatory Shifts and Solvent Handling Requirements Expanding AdoptionHazardous materials standards under REACH and TSCA prompted accelerated replacement cycles for metal-containing pump assemblies, especially in pesticide formulation and industrial coatings. End users reported a 17.4% drop in leak incidents after switching to metal-free magnetic drive pumps in high-risk processes.

In the food sector, resin-compliant models with FDA certification gained share, driven by stricter sanitization validation. Chemical manufacturers using ketones, acids, and caustics increased their metal-free pump installations by 11.2% compared to the prior year.

Cost Management and Materials Availability Influencing Buyer StrategyVirgin fluoropolymer resin prices rose 6.5% YoY in Q1 2025, affecting unit pricing in North America and parts of Europe. Some OEMs began offering hybrid polymer-composite casings to reduce dependence on PTFE supply volatility. Buyers in cost-sensitive regions, particularly Southeast Asia, shifted toward modular pump architectures to defer full system replacement. Distributors reported a 14.6% increase in small-volume orders, suggesting more fragmented procurement driven by project-based rather than fleetwide upgrades.
Top Countries Contributing to Divergent Growth in the Metal-Free Pumps Market

Metal Free Pumps Market Cagr Analysis By Country

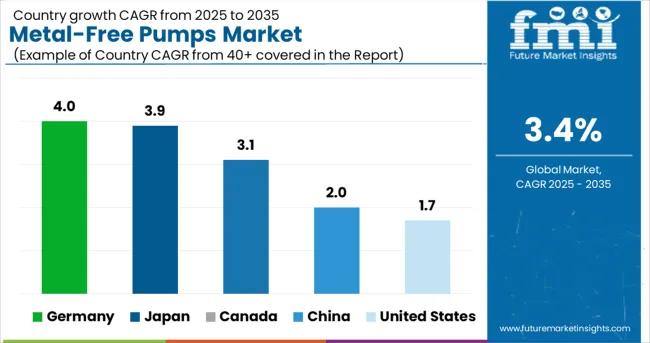
Countries CAGR (2025 to 2035)
Germany 4.0%
Japan 3.9%
Canada 3.1%
China 2.0%
United States 1.7%

The global industry is projected to expand at a CAGR of 3.4% between 2025 and 2035. Germany (OECD) leads among the profiled nations with a growth rate of 4.0%, surpassing the global average by 0.6 percentage points. Japan (OECD) closely follows at 3.9%, up 0.5% from the global baseline. Canada (OECD) stands at 3.1%, slightly under the global figure by 0.3%.

In contrast, China (BRICS) and the United States (OECD) register slower growth at 2.0% and 1.7% respectively, reflecting a divergence of 1.4% and 1.7% below the global CAGR. These differences reflect varying industrial upgrade cycles, environmental regulatory pressures, and regional preferences in pump material selection.

The report covers detailed analysis of 40+ countries, with the top five countries shared as a reference.

Growth Dynamics of Metal-Free Pumps Market in the United States

The United States is projected to grow at 1.7% CAGR through 2035, indicating a mature and moderately saturated demand landscape. From 2020 to 2024, uptake remained steady in pharmaceutical and industrial fluid-handling segments, though price-sensitive OEMs prioritized reconditioned units. High regulatory compliance costs have slowed procurement cycles, particularly in chemical and biotech applications. Demand has remained most consistent for air-operated diaphragm variants used in high-purity applications, where non-metal contact surfaces are mandated.

  • Over 58% of installed units in clean-in-place systems are now polymer-based
  • Replacement demand accounted for nearly 63% of total unit sales in 2024
  • Pharma-grade polypropylene pump sales rose by 5.2% year-over-year in 2024

Metal-Free Pumps Market Growth Outlook in Canada

Canada is expected to grow at 3.1% CAGR over the forecast period, outperforming the US by a notable margin. This growth is underpinned by environmental upgrades in wastewater treatment and food-grade chemical handling. From 2020 to 2024, federal subsidies encouraged clean plant retrofits using non-metal pump solutions. In agri-processing facilities across Ontario and British Columbia, fully plastic diaphragm pump systems have replaced traditional stainless steel units due to corrosion risks and higher maintenance costs.

  • Over 42% of new industrial pumps installed in 2024 were metal-free
  • Polyethylene pump adoption rose 19.6% from 2021 to 2024 in water applications
  • CleanTech upgrades in food-grade plants contributed to 27% of unit demand in 2024

Future Outlook for Metal-Free Pumps Market in Germany

The metal-free pumps industryis set to expand at 4.0% CAGR, the highest among developed economies. From 2020 to 2024, demand grew in semiconductor and chemical coating applications, particularly in Saxony and Baden-Württemberg. OEMs are favoring perfluoropolymer-lined pumps for high-purity and abrasive fluid handling.

  • Teflon-lined pump variants grew 32% from 2021 to 2024
  • 44% of demand in 2024 came from fluid-transfer systems in microelectronics
  • Over 36 million euros were invested in thermoplastic pump R&D during 2023-24

Demand Forecast for Metal-Free Pumps Market in China

China is projected to grow at 2.0% CAGR, driven by industrial diversification and local manufacturing scale. Between 2020 and 2024, demand remained strongest in textile chemical dosing and agricultural fluid handling.

Larger installations in Tier 2 cities are switching to plastic centrifugal and peristaltic pumps due to better cost-performance ratios. Local manufacturers are investing in polypropylene-based pump variants to meet export specifications, particularly for Southeast Asia and Africa.

  • Thermoplastic pump exports rose 21.7% between 2022 and 2024
  • Polypropylene units now account for 46% of domestic metal-free pump output
  • Dosing systems for dyeing applications led 18% of China’s pump installations in 2024

Analysis of Metal-Free Pumps Market in Japan

The metal-free pump industry in Japan is expected to grow at 3.9% CAGR, supported by long-term capital replacement cycles and process optimization in high-precision industries. From 2020 to 2024, cleanroom automation and semiconductor facilities increased demand for diaphragm and bellows pumps constructed entirely from fluoropolymers.

Quality compliance and energy efficiency goals continue to steer OEMs toward metal-free options. Compact plastic pump systems are also being introduced in laboratory automation and specialty chemical setups.
  • Over 71% of pumps used in Class 1000 cleanrooms were metal-free in 2024
  • Fluoropolymer pump usage in semiconductor fabs rose 22.3% over three years
  • Japanese OEMs introduced 14 new plastic pump SKUs for lab automation in 2023

Leading Metal-Free Pumps Manufacturers, Suppliers, Distributors

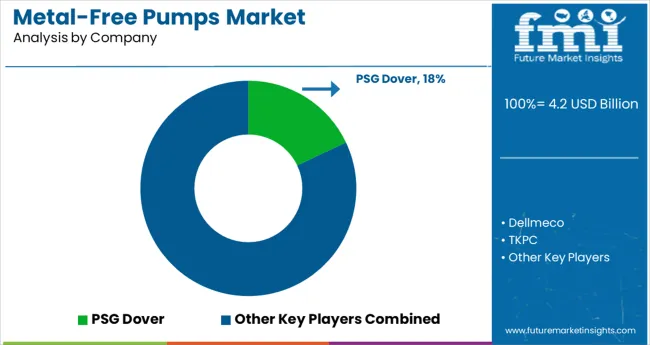
Leading Player - PSG Dover holding 18% industry share.

Metal Free Pumps Market Analysis By Company

The sector is led by PSG Dover, leveraging its broad product range and global supply chain to serve chemical and industrial clients. Almatec competes with specialized air-operated diaphragm pumps for corrosive fluid handling.

Mid-sized players like Aptar and CAPARDINI focus on precision pumps for pharmaceuticals and cosmetics, using reinforced polymers to replace traditional metals. New entrants such as Dellmeco and TKPC target cost-sensitive markets with simplified designs, though material certification hurdles limit their expansion.

Barriers include high R&D costs for chemical-resistant composites and stringent FDA/EPA approvals favoring incumbents. PlastoMatic and Maxis circumvent these challenges through regional partnerships and modular pump designs, while Fti Air and YTS compete via rapid prototyping for niche industrial applications. Customer loyalty to proven brands further restricts market entry.

Recent Industry News

  • In 2024, Iwaki America Inc. launched the world's first fully ceramic magnetic drive pump, eliminating all metal components to achieve superior chemical resistance for semiconductor and pharmaceutical fluid handling applications.
  • In 2025, Dover Corporation acquired Teflo Pumps, combining their expertise in non-metallic pump technologies to create an expanded product line of corrosion-resistant solutions for harsh chemical processing environments.

Leading Players

  • PSG Dover
  • Dellmeco
  • TKPC
  • Almatec
  • Aptar
  • CAPARDONI
  • PlastoMatic
  • Fti Air
  • Maxis
  • YTS

Report Scope

Report Attributes Details
Market Size (2025) USD 4.2 billion
Projected Market Size (2035) USD 5.9 billion
CAGR (2025 to 2035) 3.4%
Forecast Period 2025 to 2035
Quantitative Units USD billion (revenue)
Segmentation - Material Composition All-Plastic (PP, PE), Biopolymer-based, Silicone-based
Segmentation - Dispensing Volume Less than 0.3 ml, 0.3-0.6 ml, Greater than 0.6 ml
Segmentation - Pump Type Lotion Pump, Mist Sprayer, Airless Pump
Segmentation - Application Corrosive Formulations, Natural Cosmetics, Clean Label Products
Segmentation - End-Use Industry Skincare, Haircare, Pharmaceuticals, Food Products (e.g., sauces, gels)
Regional/Country Coverage North America (USA, Canada), Europe (Germany, UK, France, Italy, Spain), Asia-Pacific (China, Japan, South Korea, India, ASEAN), Latin America (Brazil, Mexico, Argentina), Middle East & Africa (GCC Countries, South Africa, Egypt)
Leading Companies Profiled PSG Dover, Dellmeco, TKPC, Almatec, Aptar, CAPARDONI, PlastoMatic, Fti Air, Maxis, YTS
Additional Attributes Dollar sales by pump type and end-use, increasing demand for airless and mist sprayers in premium cosmetics, growing interest in biopolymer pumps for sustainable branding, rise in clean-label and corrosion-sensitive formulations driving adoption across skincare and pharma sectors

Metal-Free Pumps Analyzed by Key Investment Segments 

By Material Composition:

  • All-Plastic (PP, PE)
  • Biopolymer-based
  • Silicone-based

By Dispensing Volume:

  • Less than 0.3 ml
  • 0.3-0.6 ml
  • Greater than 0.6 ml

By Pump Type:

  • Lotion Pump
  • Mist Sprayer
  • Airless Pump

By Application:

  • Corrosive Formulations
  • Natural Cosmetics
  • Clean Label Products

By End-Use Industry:

  • Skincare
  • Haircare
  • Pharmaceuticals
  • Food Products (e.g., sauces, gels)

By Region:

  • North America
  • Europe
  • Asia-Pacific
  • Latin America
  • Middle East & Africa

Table of Content

  1. Executive Summary
    • Global Market Outlook
    • Demand-side Trends
    • Supply-side Trends
    • Technology Roadmap Analysis
    • Analysis and Recommendations
  2. Market Overview
    • Market Coverage / Taxonomy
    • Market Definition / Scope / Limitations
  3. Market Background
    • Market Dynamics
      • Drivers
      • Restraints
      • Opportunity
      • Trends
    • Scenario Forecast
      • Demand in Optimistic Scenario
      • Demand in Likely Scenario
      • Demand in Conservative Scenario
    • Opportunity Map Analysis
    • Product Life Cycle Analysis
    • Supply Chain Analysis
      • Supply Side Participants and their Roles
        • Producers
        • Mid-Level Participants (Traders/ Agents/ Brokers)
        • Wholesalers and Distributors
      • Value Added and Value Created at Node in the Supply Chain
      • List of Raw Material Suppliers
      • List of Existing and Potential Buyer’s
    • Investment Feasibility Matrix
    • Value Chain Analysis
      • Profit Margin Analysis
      • Wholesalers and Distributors
      • Retailers
    • PESTLE and Porter’s Analysis
    • Regulatory Landscape
      • By Key Regions
      • By Key Countries
    • Regional Parent Market Outlook
    • Production and Consumption Statistics
    • Import and Export Statistics
  4. Global Market Analysis 2020 to 2024 and Forecast, 2025 to 2035
    • Historical Market Size Value (MT) & Volume (Million Units) Analysis, 2020 to 2024
    • Current and Future Market Size Value (MT) & Volume (Million Units) Projections, 2025 to 2035
      • Y-o-Y Growth Trend Analysis
      • Absolute $ Opportunity Analysis
  5. Global Market Pricing Analysis 2020 to 2024 and Forecast 2025 to 2035
  6. Global Market Analysis 2020 to 2024 and Forecast 2025 to 2035, By Material Composition
    • Introduction / Key Findings
    • Historical Market Size Value (MT) & Volume (Million Units) Analysis By Material Composition, 2020 to 2024
    • Current and Future Market Size Value (MT) & Volume (Million Units) Analysis and Forecast By Material Composition, 2025 to 2035
      • All-Plastic (PP, PE)
      • Biopolymer-based
      • Silicone-based
    • Y-o-Y Growth Trend Analysis By Material Composition, 2020 to 2024
    • Absolute $ Opportunity Analysis By Material Composition, 2025 to 2035
  7. Global Market Analysis 2020 to 2024 and Forecast 2025 to 2035, By Dispensing Volume
    • Introduction / Key Findings
    • Historical Market Size Value (MT) & Volume (Million Units) Analysis By Dispensing Volume, 2020 to 2024
    • Current and Future Market Size Value (MT) & Volume (Million Units) Analysis and Forecast By Dispensing Volume, 2025 to 2035
      • Less than 0.3 ml
      • 0.3-0.6 ml
      • Greater than 0.6 ml
    • Y-o-Y Growth Trend Analysis By Dispensing Volume, 2020 to 2024
    • Absolute $ Opportunity Analysis By Dispensing Volume, 2025 to 2035
  8. Global Market Analysis 2020 to 2024 and Forecast 2025 to 2035, By Pump Type
    • Introduction / Key Findings
    • Historical Market Size Value (MT) & Volume (Million Units) Analysis By Pump Type, 2020 to 2024
    • Current and Future Market Size Value (MT) & Volume (Million Units) Analysis and Forecast By Pump Type, 2025 to 2035
      • Lotion Pump
      • Mist Sprayer
      • Airless Pump
    • Y-o-Y Growth Trend Analysis By Pump Type, 2020 to 2024
    • Absolute $ Opportunity Analysis By Pump Type, 2025 to 2035
  9. Global Market Analysis 2020 to 2024 and Forecast 2025 to 2035, By Application
    • Introduction / Key Findings
    • Historical Market Size Value (MT) & Volume (Million Units) Analysis By Application, 2020 to 2024
    • Current and Future Market Size Value (MT) & Volume (Million Units) Analysis and Forecast By Application, 2025 to 2035
      • Corrosive Formulations
      • Natural Cosmetics
      • Clean Label Products
    • Y-o-Y Growth Trend Analysis By Application, 2020 to 2024
    • Absolute $ Opportunity Analysis By Application, 2025 to 2035
  10. Global Market Analysis 2020 to 2024 and Forecast 2025 to 2035, By End-Use Industry
    • Introduction / Key Findings
    • Historical Market Size Value (MT) & Volume (Million Units) Analysis By End-Use Industry, 2020 to 2024
    • Current and Future Market Size Value (MT) & Volume (Million Units) Analysis and Forecast By End-Use Industry, 2025 to 2035
      • Skincare
      • Haircare
      • Pharmaceuticals
      • Food Products (e.g., sauces, gels)
    • Y-o-Y Growth Trend Analysis By End-Use Industry, 2020 to 2024
    • Absolute $ Opportunity Analysis By End-Use Industry, 2025 to 2035
  11. Global Market Analysis 2020 to 2024 and Forecast 2025 to 2035, By Region
    • Introduction
    • Historical Market Size Value (MT) & Volume (Million Units) Analysis By Region, 2020 to 2024
    • Current Market Size Value (MT) & Volume (Million Units) Analysis and Forecast By Region, 2025 to 2035
      • North America
      • Latin America
      • Western Europe
      • Eastern Europe
      • East Asia
      • South Asia & Pacific
      • Middle East and Africa
    • Market Attractiveness Analysis By Region
  12. North America Market Analysis 2020 to 2024 and Forecast 2025 to 2035, By Country
    • Historical Market Size Value (MT) & Volume (Million Units) Trend Analysis By Market Taxonomy, 2020 to 2024
    • Market Size Value (MT) & Volume (Million Units) Forecast By Market Taxonomy, 2025 to 2035
      • By Country
        • USA
        • Canada
        • Mexico
      • By Material Composition
      • By Dispensing Volume
      • By Pump Type
      • By Application
      • By End-Use Industry
    • Market Attractiveness Analysis
      • By Country
      • By Material Composition
      • By Dispensing Volume
      • By Pump Type
      • By Application
      • By End-Use Industry
    • Key Takeaways
  13. Latin America Market Analysis 2020 to 2024 and Forecast 2025 to 2035, By Country
    • Historical Market Size Value (MT) & Volume (Million Units) Trend Analysis By Market Taxonomy, 2020 to 2024
    • Market Size Value (MT) & Volume (Million Units) Forecast By Market Taxonomy, 2025 to 2035
      • By Country
        • Brazil
        • Argentina
        • Rest of LATAM
      • By Material Composition
      • By Dispensing Volume
      • By Pump Type
      • By Application
      • By End-Use Industry
    • Market Attractiveness Analysis
      • By Country
      • By Material Composition
      • By Dispensing Volume
      • By Pump Type
      • By Application
      • By End-Use Industry
    • Key Takeaways
  14. Western Europe Market Analysis 2020 to 2024 and Forecast 2025 to 2035, By Country
    • Historical Market Size Value (MT) & Volume (Million Units) Trend Analysis By Market Taxonomy, 2020 to 2024
    • Market Size Value (MT) & Volume (Million Units) Forecast By Market Taxonomy, 2025 to 2035
      • By Country
        • Germany
        • Italy
        • France
        • UK
        • Spain
        • BENELUX
        • Nordic
        • Rest of W.Europe
      • By Material Composition
      • By Dispensing Volume
      • By Pump Type
      • By Application
      • By End-Use Industry
    • Market Attractiveness Analysis
      • By Country
      • By Material Composition
      • By Dispensing Volume
      • By Pump Type
      • By Application
      • By End-Use Industry
    • Key Takeaways
  15. Eastern Europe Market Analysis 2020 to 2024 and Forecast 2025 to 2035, By Country
    • Historical Market Size Value (MT) & Volume (Million Units) Trend Analysis By Market Taxonomy, 2020 to 2024
    • Market Size Value (MT) & Volume (Million Units) Forecast By Market Taxonomy, 2025 to 2035
      • By Country
        • Russia
        • Hungary
        • Poland
        • Balkan & Baltics
        • Rest of E. Europe
      • By Material Composition
      • By Dispensing Volume
      • By Pump Type
      • By Application
      • By End-Use Industry
    • Market Attractiveness Analysis
      • By Country
      • By Material Composition
      • By Dispensing Volume
      • By Pump Type
      • By Application
      • By End-Use Industry
    • Key Takeaways
  16. East Asia Market Analysis 2020 to 2024 and Forecast 2025 to 2035, By Country
    • Historical Market Size Value (MT) & Volume (Million Units) Trend Analysis By Market Taxonomy, 2020 to 2024
    • Market Size Value (MT) & Volume (Million Units) Forecast By Market Taxonomy, 2025 to 2035
      • By Country
        • China
        • Japan
        • South Korea
      • By Material Composition
      • By Dispensing Volume
      • By Pump Type
      • By Application
      • By End-Use Industry
    • Market Attractiveness Analysis
      • By Country
      • By Material Composition
      • By Dispensing Volume
      • By Pump Type
      • By Application
      • By End-Use Industry
    • Key Takeaways
  17. South Asia & Pacific Market Analysis 2020 to 2024 and Forecast 2025 to 2035, By Country
    • Historical Market Size Value (MT) & Volume (Million Units) Trend Analysis By Market Taxonomy, 2020 to 2024
    • Market Size Value (MT) & Volume (Million Units) Forecast By Market Taxonomy, 2025 to 2035
      • By Country
        • India
        • Australia & New Zealand
        • ASEAN
        • Rest of SAP
      • By Material Composition
      • By Dispensing Volume
      • By Pump Type
      • By Application
      • By End-Use Industry
    • Market Attractiveness Analysis
      • By Country
      • By Material Composition
      • By Dispensing Volume
      • By Pump Type
      • By Application
      • By End-Use Industry
    • Key Takeaways
  18. Middle East and Africa Market Analysis 2020 to 2024 and Forecast 2025 to 2035, By Country
    • Historical Market Size Value (MT) & Volume (Million Units) Trend Analysis By Market Taxonomy, 2020 to 2024
    • Market Size Value (MT) & Volume (Million Units) Forecast By Market Taxonomy, 2025 to 2035
      • By Country
        • GCC Countries
        • Northern Africa
        • South Africa
        • Turkiye
        • Rest of MEA
      • By Material Composition
      • By Dispensing Volume
      • By Pump Type
      • By Application
      • By End-Use Industry
    • Market Attractiveness Analysis
      • By Country
      • By Material Composition
      • By Dispensing Volume
      • By Pump Type
      • By Application
      • By End-Use Industry
    • Key Takeaways
  19. Key Countries Market Analysis
    • USA
      • Pricing Analysis
      • Market Share Analysis, 2024
        • By Material Composition
        • By Dispensing Volume
        • By Pump Type
        • By Application
        • By End-Use Industry
    • Canada
      • Pricing Analysis
      • Market Share Analysis, 2024
        • By Material Composition
        • By Dispensing Volume
        • By Pump Type
        • By Application
        • By End-Use Industry
    • Brazil
      • Pricing Analysis
      • Market Share Analysis, 2024
        • By Material Composition
        • By Dispensing Volume
        • By Pump Type
        • By Application
        • By End-Use Industry
    • Mexico
      • Pricing Analysis
      • Market Share Analysis, 2024
        • By Material Composition
        • By Dispensing Volume
        • By Pump Type
        • By Application
        • By End-Use Industry
    • Argentina
      • Pricing Analysis
      • Market Share Analysis, 2024
        • By Material Composition
        • By Dispensing Volume
        • By Pump Type
        • By Application
        • By End-Use Industry
  20. Market Structure Analysis
    • Competition Dashboard
    • Competition Benchmarking
    • Market Share Analysis of Top Players
      • By Regional
      • By Material Composition
      • By Dispensing Volume
      • By Pump Type
      • By Application
      • By End-Use Industry
  21. Competition Analysis
    • Competition Deep Dive
      • PSG Dover
        • Overview
        • Product Portfolio
        • Profitability by Market Segments (Product/Age /Sales Channel/Region)
        • Sales Footprint
        • Strategy Overview
          • Marketing Strategy
          • Product Strategy
          • Channel Strategy
      • Dellmeco
        • Overview
        • Product Portfolio
        • Profitability by Market Segments (Product/Age /Sales Channel/Region)
        • Sales Footprint
        • Strategy Overview
          • Marketing Strategy
          • Product Strategy
          • Channel Strategy
      • TKPC
        • Overview
        • Product Portfolio
        • Profitability by Market Segments (Product/Age /Sales Channel/Region)
        • Sales Footprint
        • Strategy Overview
          • Marketing Strategy
          • Product Strategy
          • Channel Strategy
      • Almatec
        • Overview
        • Product Portfolio
        • Profitability by Market Segments (Product/Age /Sales Channel/Region)
        • Sales Footprint
        • Strategy Overview
          • Marketing Strategy
          • Product Strategy
          • Channel Strategy
      • Aptar
        • Overview
        • Product Portfolio
        • Profitability by Market Segments (Product/Age /Sales Channel/Region)
        • Sales Footprint
        • Strategy Overview
          • Marketing Strategy
          • Product Strategy
          • Channel Strategy
      • CAPARDONI
        • Overview
        • Product Portfolio
        • Profitability by Market Segments (Product/Age /Sales Channel/Region)
        • Sales Footprint
        • Strategy Overview
          • Marketing Strategy
          • Product Strategy
          • Channel Strategy
      • PlastoMatic
        • Overview
        • Product Portfolio
        • Profitability by Market Segments (Product/Age /Sales Channel/Region)
        • Sales Footprint
        • Strategy Overview
          • Marketing Strategy
          • Product Strategy
          • Channel Strategy
      • Fti Air
        • Overview
        • Product Portfolio
        • Profitability by Market Segments (Product/Age /Sales Channel/Region)
        • Sales Footprint
        • Strategy Overview
          • Marketing Strategy
          • Product Strategy
          • Channel Strategy
      • Maxis
        • Overview
        • Product Portfolio
        • Profitability by Market Segments (Product/Age /Sales Channel/Region)
        • Sales Footprint
        • Strategy Overview
          • Marketing Strategy
          • Product Strategy
          • Channel Strategy
      • YTS
        • Overview
        • Product Portfolio
        • Profitability by Market Segments (Product/Age /Sales Channel/Region)
        • Sales Footprint
        • Strategy Overview
          • Marketing Strategy
          • Product Strategy
          • Channel Strategy
  22. Assumptions & Acronyms Used
  23. Research Methodology

List of Tables

  • Table 1: Global Market Value (MT) Forecast by Region, 2020-2035
  • Table 2: Global Market Volume (Million Units) Forecast by Region, 2020-2035
  • Table 3: Global Market Value (MT) Forecast by Material Composition, 2020-2035
  • Table 4: Global Market Volume (Million Units) Forecast by Material Composition, 2020-2035
  • Table 5: Global Market Value (MT) Forecast by Dispensing Volume, 2020-2035
  • Table 6: Global Market Volume (Million Units) Forecast by Dispensing Volume, 2020-2035
  • Table 7: Global Market Value (MT) Forecast by Pump Type, 2020-2035
  • Table 8: Global Market Volume (Million Units) Forecast by Pump Type, 2020-2035
  • Table 9: Global Market Value (MT) Forecast by Application, 2020-2035
  • Table 10: Global Market Volume (Million Units) Forecast by Application, 2020-2035
  • Table 11: Global Market Value (MT) Forecast by End-Use Industry, 2020-2035
  • Table 12: Global Market Volume (Million Units) Forecast by End-Use Industry, 2020-2035
  • Table 13: North America Market Value (MT) Forecast by Country, 2020-2035
  • Table 14: North America Market Volume (Million Units) Forecast by Country, 2020-2035
  • Table 15: North America Market Value (MT) Forecast by Material Composition, 2020-2035
  • Table 16: North America Market Volume (Million Units) Forecast by Material Composition, 2020-2035
  • Table 17: North America Market Value (MT) Forecast by Dispensing Volume, 2020-2035
  • Table 18: North America Market Volume (Million Units) Forecast by Dispensing Volume, 2020-2035
  • Table 19: North America Market Value (MT) Forecast by Pump Type, 2020-2035
  • Table 20: North America Market Volume (Million Units) Forecast by Pump Type, 2020-2035
  • Table 21: North America Market Value (MT) Forecast by Application, 2020-2035
  • Table 22: North America Market Volume (Million Units) Forecast by Application, 2020-2035
  • Table 23: North America Market Value (MT) Forecast by End-Use Industry, 2020-2035
  • Table 24: North America Market Volume (Million Units) Forecast by End-Use Industry, 2020-2035
  • Table 25: Latin America Market Value (MT) Forecast by Country, 2020-2035
  • Table 26: Latin America Market Volume (Million Units) Forecast by Country, 2020-2035
  • Table 27: Latin America Market Value (MT) Forecast by Material Composition, 2020-2035
  • Table 28: Latin America Market Volume (Million Units) Forecast by Material Composition, 2020-2035
  • Table 29: Latin America Market Value (MT) Forecast by Dispensing Volume, 2020-2035
  • Table 30: Latin America Market Volume (Million Units) Forecast by Dispensing Volume, 2020-2035
  • Table 31: Latin America Market Value (MT) Forecast by Pump Type, 2020-2035
  • Table 32: Latin America Market Volume (Million Units) Forecast by Pump Type, 2020-2035
  • Table 33: Latin America Market Value (MT) Forecast by Application, 2020-2035
  • Table 34: Latin America Market Volume (Million Units) Forecast by Application, 2020-2035
  • Table 35: Latin America Market Value (MT) Forecast by End-Use Industry, 2020-2035
  • Table 36: Latin America Market Volume (Million Units) Forecast by End-Use Industry, 2020-2035
  • Table 37: Western Europe Market Value (MT) Forecast by Country, 2020-2035
  • Table 38: Western Europe Market Volume (Million Units) Forecast by Country, 2020-2035
  • Table 39: Western Europe Market Value (MT) Forecast by Material Composition, 2020-2035
  • Table 40: Western Europe Market Volume (Million Units) Forecast by Material Composition, 2020-2035
  • Table 41: Western Europe Market Value (MT) Forecast by Dispensing Volume, 2020-2035
  • Table 42: Western Europe Market Volume (Million Units) Forecast by Dispensing Volume, 2020-2035
  • Table 43: Western Europe Market Value (MT) Forecast by Pump Type, 2020-2035
  • Table 44: Western Europe Market Volume (Million Units) Forecast by Pump Type, 2020-2035
  • Table 45: Western Europe Market Value (MT) Forecast by Application, 2020-2035
  • Table 46: Western Europe Market Volume (Million Units) Forecast by Application, 2020-2035
  • Table 47: Western Europe Market Value (MT) Forecast by End-Use Industry, 2020-2035
  • Table 48: Western Europe Market Volume (Million Units) Forecast by End-Use Industry, 2020-2035
  • Table 49: Eastern Europe Market Value (MT) Forecast by Country, 2020-2035
  • Table 50: Eastern Europe Market Volume (Million Units) Forecast by Country, 2020-2035
  • Table 51: Eastern Europe Market Value (MT) Forecast by Material Composition, 2020-2035
  • Table 52: Eastern Europe Market Volume (Million Units) Forecast by Material Composition, 2020-2035
  • Table 53: Eastern Europe Market Value (MT) Forecast by Dispensing Volume, 2020-2035
  • Table 54: Eastern Europe Market Volume (Million Units) Forecast by Dispensing Volume, 2020-2035
  • Table 55: Eastern Europe Market Value (MT) Forecast by Pump Type, 2020-2035
  • Table 56: Eastern Europe Market Volume (Million Units) Forecast by Pump Type, 2020-2035
  • Table 57: Eastern Europe Market Value (MT) Forecast by Application, 2020-2035
  • Table 58: Eastern Europe Market Volume (Million Units) Forecast by Application, 2020-2035
  • Table 59: Eastern Europe Market Value (MT) Forecast by End-Use Industry, 2020-2035
  • Table 60: Eastern Europe Market Volume (Million Units) Forecast by End-Use Industry, 2020-2035
  • Table 61: East Asia Market Value (MT) Forecast by Country, 2020-2035
  • Table 62: East Asia Market Volume (Million Units) Forecast by Country, 2020-2035
  • Table 63: East Asia Market Value (MT) Forecast by Material Composition, 2020-2035
  • Table 64: East Asia Market Volume (Million Units) Forecast by Material Composition, 2020-2035
  • Table 65: East Asia Market Value (MT) Forecast by Dispensing Volume, 2020-2035
  • Table 66: East Asia Market Volume (Million Units) Forecast by Dispensing Volume, 2020-2035
  • Table 67: East Asia Market Value (MT) Forecast by Pump Type, 2020-2035
  • Table 68: East Asia Market Volume (Million Units) Forecast by Pump Type, 2020-2035
  • Table 69: East Asia Market Value (MT) Forecast by Application, 2020-2035
  • Table 70: East Asia Market Volume (Million Units) Forecast by Application, 2020-2035
  • Table 71: East Asia Market Value (MT) Forecast by End-Use Industry, 2020-2035
  • Table 72: East Asia Market Volume (Million Units) Forecast by End-Use Industry, 2020-2035
  • Table 73: South Asia & Pacific Market Value (MT) Forecast by Country, 2020-2035
  • Table 74: South Asia & Pacific Market Volume (Million Units) Forecast by Country, 2020-2035
  • Table 75: South Asia & Pacific Market Value (MT) Forecast by Material Composition, 2020-2035
  • Table 76: South Asia & Pacific Market Volume (Million Units) Forecast by Material Composition, 2020-2035
  • Table 77: South Asia & Pacific Market Value (MT) Forecast by Dispensing Volume, 2020-2035
  • Table 78: South Asia & Pacific Market Volume (Million Units) Forecast by Dispensing Volume, 2020-2035
  • Table 79: South Asia & Pacific Market Value (MT) Forecast by Pump Type, 2020-2035
  • Table 80: South Asia & Pacific Market Volume (Million Units) Forecast by Pump Type, 2020-2035
  • Table 81: South Asia & Pacific Market Value (MT) Forecast by Application, 2020-2035
  • Table 82: South Asia & Pacific Market Volume (Million Units) Forecast by Application, 2020-2035
  • Table 83: South Asia & Pacific Market Value (MT) Forecast by End-Use Industry, 2020-2035
  • Table 84: South Asia & Pacific Market Volume (Million Units) Forecast by End-Use Industry, 2020-2035
  • Table 85: Middle East and Africa Market Value (MT) Forecast by Country, 2020-2035
  • Table 86: Middle East and Africa Market Volume (Million Units) Forecast by Country, 2020-2035
  • Table 87: Middle East and Africa Market Value (MT) Forecast by Material Composition, 2020-2035
  • Table 88: Middle East and Africa Market Volume (Million Units) Forecast by Material Composition, 2020-2035
  • Table 89: Middle East and Africa Market Value (MT) Forecast by Dispensing Volume, 2020-2035
  • Table 90: Middle East and Africa Market Volume (Million Units) Forecast by Dispensing Volume, 2020-2035
  • Table 91: Middle East and Africa Market Value (MT) Forecast by Pump Type, 2020-2035
  • Table 92: Middle East and Africa Market Volume (Million Units) Forecast by Pump Type, 2020-2035
  • Table 93: Middle East and Africa Market Value (MT) Forecast by Application, 2020-2035
  • Table 94: Middle East and Africa Market Volume (Million Units) Forecast by Application, 2020-2035
  • Table 95: Middle East and Africa Market Value (MT) Forecast by End-Use Industry, 2020-2035
  • Table 96: Middle East and Africa Market Volume (Million Units) Forecast by End-Use Industry, 2020-2035

List of Figures

  • Figure 1: Global Market Volume (Million Units) Forecast 2020-2035
  • Figure 2: Global Market Pricing Analysis
  • Figure 3: Global Market Value (MT) Forecast 2020-2035
  • Figure 4: Global Market Value Share and BPS Analysis by Material Composition, 2025 and 2035
  • Figure 5: Global Market Y-o-Y Growth Comparison by Material Composition, 2025-2035
  • Figure 6: Global Market Attractiveness Analysis by Material Composition
  • Figure 7: Global Market Value Share and BPS Analysis by Dispensing Volume, 2025 and 2035
  • Figure 8: Global Market Y-o-Y Growth Comparison by Dispensing Volume, 2025-2035
  • Figure 9: Global Market Attractiveness Analysis by Dispensing Volume
  • Figure 10: Global Market Value Share and BPS Analysis by Pump Type, 2025 and 2035
  • Figure 11: Global Market Y-o-Y Growth Comparison by Pump Type, 2025-2035
  • Figure 12: Global Market Attractiveness Analysis by Pump Type
  • Figure 13: Global Market Value Share and BPS Analysis by Application, 2025 and 2035
  • Figure 14: Global Market Y-o-Y Growth Comparison by Application, 2025-2035
  • Figure 15: Global Market Attractiveness Analysis by Application
  • Figure 16: Global Market Value Share and BPS Analysis by End-Use Industry, 2025 and 2035
  • Figure 17: Global Market Y-o-Y Growth Comparison by End-Use Industry, 2025-2035
  • Figure 18: Global Market Attractiveness Analysis by End-Use Industry
  • Figure 19: Global Market Value (MT) Share and BPS Analysis by Region, 2025 and 2035
  • Figure 20: Global Market Y-o-Y Growth Comparison by Region, 2025-2035
  • Figure 21: Global Market Attractiveness Analysis by Region
  • Figure 22: North America Market Incremental $ Opportunity, 2025-2035
  • Figure 23: Latin America Market Incremental $ Opportunity, 2025-2035
  • Figure 24: Western Europe Market Incremental $ Opportunity, 2025-2035
  • Figure 25: Eastern Europe Market Incremental $ Opportunity, 2025-2035
  • Figure 26: East Asia Market Incremental $ Opportunity, 2025-2035
  • Figure 27: South Asia & Pacific Market Incremental $ Opportunity, 2025-2035
  • Figure 28: Middle East and Africa Market Incremental $ Opportunity, 2025-2035
  • Figure 29: North America Market Value Share and BPS Analysis by Country, 2025 and 2035
  • Figure 30: North America Market Value Share and BPS Analysis by Material Composition, 2025 and 2035
  • Figure 31: North America Market Y-o-Y Growth Comparison by Material Composition, 2025-2035
  • Figure 32: North America Market Attractiveness Analysis by Material Composition
  • Figure 33: North America Market Value Share and BPS Analysis by Dispensing Volume, 2025 and 2035
  • Figure 34: North America Market Y-o-Y Growth Comparison by Dispensing Volume, 2025-2035
  • Figure 35: North America Market Attractiveness Analysis by Dispensing Volume
  • Figure 36: North America Market Value Share and BPS Analysis by Pump Type, 2025 and 2035
  • Figure 37: North America Market Y-o-Y Growth Comparison by Pump Type, 2025-2035
  • Figure 38: North America Market Attractiveness Analysis by Pump Type
  • Figure 39: North America Market Value Share and BPS Analysis by Application, 2025 and 2035
  • Figure 40: North America Market Y-o-Y Growth Comparison by Application, 2025-2035
  • Figure 41: North America Market Attractiveness Analysis by Application
  • Figure 42: North America Market Value Share and BPS Analysis by End-Use Industry, 2025 and 2035
  • Figure 43: North America Market Y-o-Y Growth Comparison by End-Use Industry, 2025-2035
  • Figure 44: North America Market Attractiveness Analysis by End-Use Industry
  • Figure 45: Latin America Market Value Share and BPS Analysis by Country, 2025 and 2035
  • Figure 46: Latin America Market Value Share and BPS Analysis by Material Composition, 2025 and 2035
  • Figure 47: Latin America Market Y-o-Y Growth Comparison by Material Composition, 2025-2035
  • Figure 48: Latin America Market Attractiveness Analysis by Material Composition
  • Figure 49: Latin America Market Value Share and BPS Analysis by Dispensing Volume, 2025 and 2035
  • Figure 50: Latin America Market Y-o-Y Growth Comparison by Dispensing Volume, 2025-2035
  • Figure 51: Latin America Market Attractiveness Analysis by Dispensing Volume
  • Figure 52: Latin America Market Value Share and BPS Analysis by Pump Type, 2025 and 2035
  • Figure 53: Latin America Market Y-o-Y Growth Comparison by Pump Type, 2025-2035
  • Figure 54: Latin America Market Attractiveness Analysis by Pump Type
  • Figure 55: Latin America Market Value Share and BPS Analysis by Application, 2025 and 2035
  • Figure 56: Latin America Market Y-o-Y Growth Comparison by Application, 2025-2035
  • Figure 57: Latin America Market Attractiveness Analysis by Application
  • Figure 58: Latin America Market Value Share and BPS Analysis by End-Use Industry, 2025 and 2035
  • Figure 59: Latin America Market Y-o-Y Growth Comparison by End-Use Industry, 2025-2035
  • Figure 60: Latin America Market Attractiveness Analysis by End-Use Industry
  • Figure 61: Western Europe Market Value Share and BPS Analysis by Country, 2025 and 2035
  • Figure 62: Western Europe Market Value Share and BPS Analysis by Material Composition, 2025 and 2035
  • Figure 63: Western Europe Market Y-o-Y Growth Comparison by Material Composition, 2025-2035
  • Figure 64: Western Europe Market Attractiveness Analysis by Material Composition
  • Figure 65: Western Europe Market Value Share and BPS Analysis by Dispensing Volume, 2025 and 2035
  • Figure 66: Western Europe Market Y-o-Y Growth Comparison by Dispensing Volume, 2025-2035
  • Figure 67: Western Europe Market Attractiveness Analysis by Dispensing Volume
  • Figure 68: Western Europe Market Value Share and BPS Analysis by Pump Type, 2025 and 2035
  • Figure 69: Western Europe Market Y-o-Y Growth Comparison by Pump Type, 2025-2035
  • Figure 70: Western Europe Market Attractiveness Analysis by Pump Type
  • Figure 71: Western Europe Market Value Share and BPS Analysis by Application, 2025 and 2035
  • Figure 72: Western Europe Market Y-o-Y Growth Comparison by Application, 2025-2035
  • Figure 73: Western Europe Market Attractiveness Analysis by Application
  • Figure 74: Western Europe Market Value Share and BPS Analysis by End-Use Industry, 2025 and 2035
  • Figure 75: Western Europe Market Y-o-Y Growth Comparison by End-Use Industry, 2025-2035
  • Figure 76: Western Europe Market Attractiveness Analysis by End-Use Industry
  • Figure 77: Eastern Europe Market Value Share and BPS Analysis by Country, 2025 and 2035
  • Figure 78: Eastern Europe Market Value Share and BPS Analysis by Material Composition, 2025 and 2035
  • Figure 79: Eastern Europe Market Y-o-Y Growth Comparison by Material Composition, 2025-2035
  • Figure 80: Eastern Europe Market Attractiveness Analysis by Material Composition
  • Figure 81: Eastern Europe Market Value Share and BPS Analysis by Dispensing Volume, 2025 and 2035
  • Figure 82: Eastern Europe Market Y-o-Y Growth Comparison by Dispensing Volume, 2025-2035
  • Figure 83: Eastern Europe Market Attractiveness Analysis by Dispensing Volume
  • Figure 84: Eastern Europe Market Value Share and BPS Analysis by Pump Type, 2025 and 2035
  • Figure 85: Eastern Europe Market Y-o-Y Growth Comparison by Pump Type, 2025-2035
  • Figure 86: Eastern Europe Market Attractiveness Analysis by Pump Type
  • Figure 87: Eastern Europe Market Value Share and BPS Analysis by Application, 2025 and 2035
  • Figure 88: Eastern Europe Market Y-o-Y Growth Comparison by Application, 2025-2035
  • Figure 89: Eastern Europe Market Attractiveness Analysis by Application
  • Figure 90: Eastern Europe Market Value Share and BPS Analysis by End-Use Industry, 2025 and 2035
  • Figure 91: Eastern Europe Market Y-o-Y Growth Comparison by End-Use Industry, 2025-2035
  • Figure 92: Eastern Europe Market Attractiveness Analysis by End-Use Industry
  • Figure 93: East Asia Market Value Share and BPS Analysis by Country, 2025 and 2035
  • Figure 94: East Asia Market Value Share and BPS Analysis by Material Composition, 2025 and 2035
  • Figure 95: East Asia Market Y-o-Y Growth Comparison by Material Composition, 2025-2035
  • Figure 96: East Asia Market Attractiveness Analysis by Material Composition
  • Figure 97: East Asia Market Value Share and BPS Analysis by Dispensing Volume, 2025 and 2035
  • Figure 98: East Asia Market Y-o-Y Growth Comparison by Dispensing Volume, 2025-2035
  • Figure 99: East Asia Market Attractiveness Analysis by Dispensing Volume
  • Figure 100: East Asia Market Value Share and BPS Analysis by Pump Type, 2025 and 2035
  • Figure 101: East Asia Market Y-o-Y Growth Comparison by Pump Type, 2025-2035
  • Figure 102: East Asia Market Attractiveness Analysis by Pump Type
  • Figure 103: East Asia Market Value Share and BPS Analysis by Application, 2025 and 2035
  • Figure 104: East Asia Market Y-o-Y Growth Comparison by Application, 2025-2035
  • Figure 105: East Asia Market Attractiveness Analysis by Application
  • Figure 106: East Asia Market Value Share and BPS Analysis by End-Use Industry, 2025 and 2035
  • Figure 107: East Asia Market Y-o-Y Growth Comparison by End-Use Industry, 2025-2035
  • Figure 108: East Asia Market Attractiveness Analysis by End-Use Industry
  • Figure 109: South Asia & Pacific Market Value Share and BPS Analysis by Country, 2025 and 2035
  • Figure 110: South Asia & Pacific Market Value Share and BPS Analysis by Material Composition, 2025 and 2035
  • Figure 111: South Asia & Pacific Market Y-o-Y Growth Comparison by Material Composition, 2025-2035
  • Figure 112: South Asia & Pacific Market Attractiveness Analysis by Material Composition
  • Figure 113: South Asia & Pacific Market Value Share and BPS Analysis by Dispensing Volume, 2025 and 2035
  • Figure 114: South Asia & Pacific Market Y-o-Y Growth Comparison by Dispensing Volume, 2025-2035
  • Figure 115: South Asia & Pacific Market Attractiveness Analysis by Dispensing Volume
  • Figure 116: South Asia & Pacific Market Value Share and BPS Analysis by Pump Type, 2025 and 2035
  • Figure 117: South Asia & Pacific Market Y-o-Y Growth Comparison by Pump Type, 2025-2035
  • Figure 118: South Asia & Pacific Market Attractiveness Analysis by Pump Type
  • Figure 119: South Asia & Pacific Market Value Share and BPS Analysis by Application, 2025 and 2035
  • Figure 120: South Asia & Pacific Market Y-o-Y Growth Comparison by Application, 2025-2035
  • Figure 121: South Asia & Pacific Market Attractiveness Analysis by Application
  • Figure 122: South Asia & Pacific Market Value Share and BPS Analysis by End-Use Industry, 2025 and 2035
  • Figure 123: South Asia & Pacific Market Y-o-Y Growth Comparison by End-Use Industry, 2025-2035
  • Figure 124: South Asia & Pacific Market Attractiveness Analysis by End-Use Industry
  • Figure 125: Middle East and Africa Market Value Share and BPS Analysis by Country, 2025 and 2035
  • Figure 126: Middle East and Africa Market Value Share and BPS Analysis by Material Composition, 2025 and 2035
  • Figure 127: Middle East and Africa Market Y-o-Y Growth Comparison by Material Composition, 2025-2035
  • Figure 128: Middle East and Africa Market Attractiveness Analysis by Material Composition
  • Figure 129: Middle East and Africa Market Value Share and BPS Analysis by Dispensing Volume, 2025 and 2035
  • Figure 130: Middle East and Africa Market Y-o-Y Growth Comparison by Dispensing Volume, 2025-2035
  • Figure 131: Middle East and Africa Market Attractiveness Analysis by Dispensing Volume
  • Figure 132: Middle East and Africa Market Value Share and BPS Analysis by Pump Type, 2025 and 2035
  • Figure 133: Middle East and Africa Market Y-o-Y Growth Comparison by Pump Type, 2025-2035
  • Figure 134: Middle East and Africa Market Attractiveness Analysis by Pump Type
  • Figure 135: Middle East and Africa Market Value Share and BPS Analysis by Application, 2025 and 2035
  • Figure 136: Middle East and Africa Market Y-o-Y Growth Comparison by Application, 2025-2035
  • Figure 137: Middle East and Africa Market Attractiveness Analysis by Application
  • Figure 138: Middle East and Africa Market Value Share and BPS Analysis by End-Use Industry, 2025 and 2035
  • Figure 139: Middle East and Africa Market Y-o-Y Growth Comparison by End-Use Industry, 2025-2035
  • Figure 140: Middle East and Africa Market Attractiveness Analysis by End-Use Industry
  • Figure 141: Global Market - Tier Structure Analysis
  • Figure 142: Global Market - Company Share Analysis

Frequently Asked Questions

What is the expected size of the global metal-free pumps market by 2035?

The industry is projected to reach USD 5.9 billion by 2035, growing at a 3.4% CAGR.

Which material is most widely used in metal-free pumps by 2025?

Polypropylene (PP) leads the material segment with a 63% market share in 2025.

What percentage of metal-free pump demand will come from cosmetic packaging in 2025?

41% of demand in 2025 is expected to come from cosmetic packaging applications.

Which dispensing volume range holds the largest market share?

0.3–0.6 ml pumps lead with a 48% share due to their use in skincare and nutraceuticals.

Who is the leading player in the metal-free pumps market and what is their share?

PSG Dover is the top player with an 18% global market share.

Explore Similar Insights

Future Market Insights

Metal-free Pumps Market