The global metal bellow market is projected to reach USD 4.8 billion by 2035, recording an absolute increase of USD 2.2 billion over the forecast period. The market is valued at USD 2.6 billion in 2025 and is set to rise at a CAGR of 6.3% during the assessment period. The overall market size is expected to grow by 1.8 times during the same period, supported by increasing aerospace engine production and turbomachinery modernization worldwide, driving demand for precision-engineered expansion joint systems and increasing investments in power generation infrastructure and industrial process equipment globally. However, raw material price volatility and manufacturing complexity may pose challenges to market expansion.
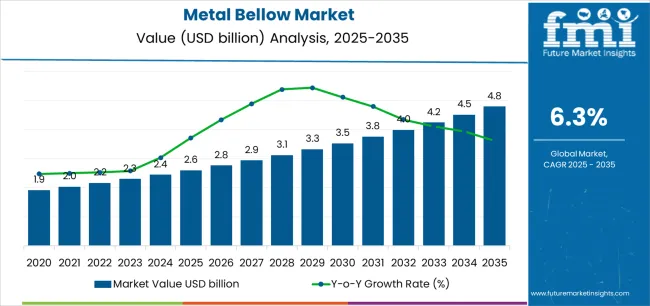
Between 2025 and 2030, the metal bellow market is projected to expand from USD 2.6 billion to USD 3.5 billion, resulting in a value increase of USD 0.9 billion, which represents 40.9% of the total forecast growth for the decade. This phase of development will be shaped by rising demand for aerospace engine components and industrial turbomachinery applications, product innovation in hydrogen-ready welded bellow designs and advanced fatigue-resistant alloys, as well as expanding integration with emission control systems and thermal management initiatives. Companies are establishing competitive positions through investment in advanced laser-welding technologies, precision forming capabilities, and strategic market expansion across aerospace, oil and gas refining, and automotive applications.
From 2030 to 2035, the market is forecast to grow from USD 3.5 billion to USD 4.8 billion, adding another USD 1.3 billion, which constitutes 59.1% of the overall ten-year expansion. This period is expected to be characterized by the expansion of specialized hydrogen infrastructure applications, including advanced nickel-alloy bellows and integrated high-temperature sealing solutions tailored for specific process requirements, strategic collaborations between bellow manufacturers and OEM equipment suppliers, and an enhanced focus on operational reliability and lifecycle performance. The growing emphasis on energy transition infrastructure and precision manufacturing will drive demand for advanced, high-performance metal bellow solutions across diverse industrial applications.
| Metric | Value |
|---|---|
| Market Value (2025) | USD 2.6 billion |
| Market Forecast Value (2035) | USD 4.8 billion |
| Forecast CAGR (2025-2035) | 6.3% |
The metal bellow market grows by enabling equipment manufacturers to achieve superior thermal expansion compensation and vibration isolation while meeting evolving industrial reliability demands. Equipment designers face mounting pressure to improve system durability and reduce maintenance requirements, with metal bellow solutions typically providing 10,000-plus cycle fatigue life over conventional expansion joints, making welded bellows essential for aerospace engines and critical process equipment. The industrial modernization movement's need for reliable, leak-free connections creates demand for advanced metal bellow solutions that can enhance equipment performance, accommodate thermal movement, and ensure consistent sealing across extreme operating conditions.
Government initiatives promoting energy efficiency and emissions reduction drive adoption in power generation, aerospace and defense, and industrial processing applications, where thermal expansion management has a direct impact on equipment reliability and operational safety. The global shift toward hydrogen infrastructure and alternative fuel systems accelerates metal bellow demand as engineers seek solutions for high-temperature, corrosion-resistant applications that conventional rubber expansion joints cannot withstand in hydrogen turbines and fuel cell systems. However, higher initial component costs and specialized manufacturing requirements compared to conventional flexible connections may limit adoption rates among cost-sensitive applications and standardized industrial equipment.
The market is segmented by product type, material, end-use industry, application, and region. By product type, the market is divided into welded bellows, formed bellows, and electroformed bellows. Based on material, the market is categorized into stainless steel alloys, nickel alloys, titanium alloys, and others. By end-use industry, the market includes aerospace and defense, oil and gas refining, heavy manufacturing, automotive, power generation, water treatment, light manufacturing, and others. Based on application, the market is segmented into engine exhaust systems, gas turbines, steam turbines, fuel-gas duct systems, conventional boilers, and others. Regionally, the market is divided into Asia Pacific, Europe, North America, Latin America, and Middle East & Africa.
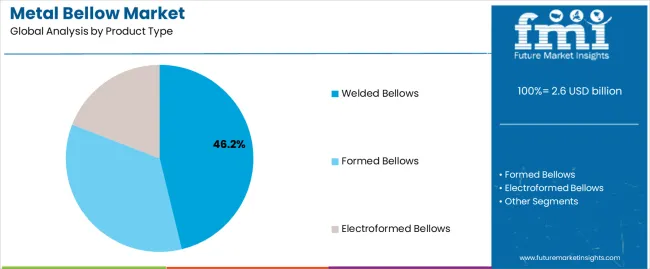
The welded bellows segment represents the dominant force in the metal bellow market, capturing approximately 46.2% of total market share in 2025. This advanced category encompasses edge-welded diaphragm assemblies featuring precision laser-welded construction, multi-ply configurations, and optimized convolution designs, delivering comprehensive performance capabilities with superior pressure resistance and extended fatigue life. The welded bellows segment's market leadership stems from its exceptional strength-to-weight characteristics in demanding applications, superior leak-tightness in critical sealing environments, and compatibility with high-temperature and high-pressure operating conditions requiring robust expansion joint solutions.
The formed bellows segment maintains a substantial 37.5% market share, serving applications requiring cost-effective thermal expansion compensation where single-ply hydroformed or roll-formed designs provide adequate performance for moderate pressure and temperature conditions. Electroformed bellows represent 16.3% of the market, providing ultra-thin wall construction and precise dimensional control for specialized applications including vacuum systems, instrumentation, and aerospace sensors where low spring rates and compact designs are essential.
Key advantages driving the welded bellows segment include:
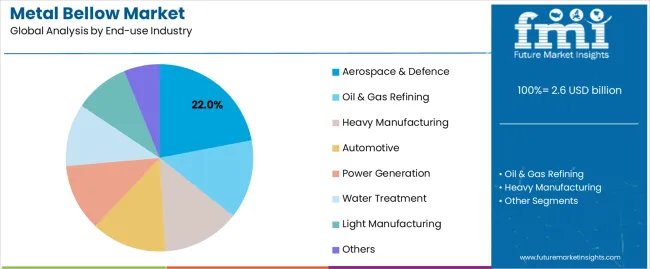
The aerospace and defense segment represents the leading end-use category in the metal bellow market, capturing approximately 22% of total market share in 2025. This critical application encompasses aircraft engine exhaust systems, auxiliary power units, environmental control systems, and missile propulsion components where metal bellows deliver essential thermal expansion compensation with lightweight, reliable performance in demanding flight environments. The aerospace and defense segment's dominance reflects the stringent reliability requirements of aviation applications, premium pricing for certified aerospace components, and continuous new aircraft production supporting sustained component demand across commercial and military platforms.
The oil and gas refining segment maintains a substantial 18.5% market share, serving process heaters, reformers, and flare systems requiring high-temperature expansion joints for thermal cycling service. Heavy manufacturing accounts for 16% market share, featuring steel mills, foundries, and industrial furnace applications. Automotive represents 15% of the market, supporting exhaust systems and turbocharger applications. Power generation holds 11.5% market share with gas turbines and steam systems, while water treatment accounts for 6.5%, light manufacturing 6%, and others 4.5% of the market.
Key factors driving aerospace and defense segment leadership include:
The engine exhaust systems segment represents the leading application category in the metal bellow market, capturing approximately 25% of total market share in 2025. This critical application encompasses aircraft turbine exhaust ducts, automotive turbocharger connections, and industrial engine systems where metal bellows accommodate thermal expansion, absorb vibration, and maintain gas-tight sealing in high-temperature exhaust environments. The engine exhaust systems segment's market leadership stems from the universal requirement for thermal expansion compensation in all combustion engine applications, high replacement frequency due to thermal cycling fatigue, and expanding emission control requirements driving aftermarket demand for leak-free exhaust connections.
The gas turbines segment maintains a substantial 20% market share, serving power generation and mechanical drive applications requiring expansion joints for turbine exhaust systems and hot-gas ducting. Steam turbines account for 16% market share, featuring bellows for steam piping and turbine inlet systems. Fuel-gas duct systems represent 14% of the market, supporting industrial furnaces and process heaters. Conventional boilers hold 13% market share with steam drum connections and flue gas applications, while other applications including HVAC systems, semiconductor equipment, and chemical processing represent 12% of the market.
Key advantages driving engine exhaust systems segment leadership include:
The market is driven by three concrete demand factors tied to industrial equipment reliability and thermal management outcomes. First, accelerating aerospace engine production and MRO activity create increasing requirements for precision expansion joints, with global commercial aircraft deliveries growing 5-8% annually across major OEM programs worldwide, requiring certified metal bellows for engine exhaust systems and auxiliary power unit installations in new and retrofit applications. Second, industrial modernization and power generation infrastructure upgrades drive equipment manufacturers toward reliable thermal expansion solutions, with metal bellows enabling 99-plus percent leak-tightness reliability while accommodating thermal movements exceeding 100mm in turbomachinery and process equipment where failure consequences include costly unplanned outages and safety incidents.
Market restraints include high initial component costs affecting project economics for standard industrial applications, with precision welded bellows priced 3-5 times higher than conventional rubber expansion joints, creating financial barriers for cost-sensitive equipment and competitive pressure in mature market segments operating with limited engineering budgets. Manufacturing complexity and specialized production requirements pose capacity constraints, as bellows fabrication requires specialized equipment including precision laser welders, hydroforming presses, and clean-room electroforming facilities where capital investments exceed USD 5-10 million for production lines and skilled workforce availability limits expansion in emerging markets. Raw material price volatility affecting nickel and titanium alloys creates additional challenges, particularly for long-term fixed-price contracts where 20-30% commodity price fluctuations erode profit margins and create supply chain uncertainty for manufacturers serving multi-year aerospace programs with locked component pricing.
Key trends indicate accelerated adoption of die-less forming technologies in emerging markets, particularly in India and Southeast Asia where hydraulic expansion processes eliminate expensive tooling enabling small and medium enterprises to produce custom bellows configurations with 60-70% lower setup costs compared to conventional hydroforming while maintaining adequate quality for industrial applications. Hydrogen-ready material qualification advancement trends toward comprehensive testing protocols, fatigue characterization, and compatibility validation for nickel-alloy and stainless-steel bellows in hydrogen service are enabling next-generation energy infrastructure deployment and supporting equipment certification for hydrogen turbines, storage systems, and transportation applications. However, the market thesis could face disruption if advanced ceramic matrix composites or flexible metallic alternatives emerge with equivalent high-temperature performance at lower costs, potentially reshaping material selection criteria and manufacturing approaches across the thermal expansion compensation sector.
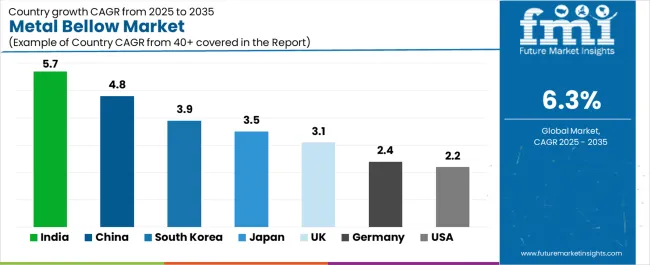
| Country | CAGR (2025-2035) |
|---|---|
| India | 5.7% |
| China | 4.8% |
| South Korea | 3.9% |
| Japan | 3.5% |
| United Kingdom | 3.1% |
| Germany | 2.4% |
| United States | 2.2% |
The metal bellow market is gaining momentum worldwide, with India taking the lead thanks to automotive production expansion and power generation capacity additions. Close behind, China benefits from semiconductor fabrication facility construction and process industry modernization, positioning itself as a strategic growth hub in the Asia-Pacific region. South Korea shows strong advancement, where foundry investments and LNG value chain projects strengthen its role in precision manufacturing supply chains. Japan demonstrates robust growth through aerospace component exports and hydrogen pilot project development, signaling continued investment in advanced materials infrastructure. Meanwhile, the United Kingdom stands out for its aerospace MRO activities combined with offshore energy upgrades, while Germany and the United States continue to record consistent progress driven by turbomachinery excellence and space launch supply chain development.
The report covers an in-depth analysis of 40+ countries, the top-performing countries are highlighted below.
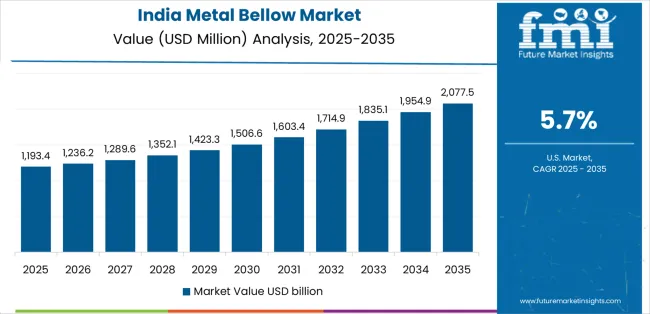
India demonstrates the strongest growth potential in the Metal Bellow Market with a CAGR of 5.7% through 2035. The country's leadership position stems from comprehensive automotive industry expansion, intensive power generation infrastructure programs, and aggressive industrial equipment localization targets driving adoption of domestically-manufactured metal bellow systems. Growth is concentrated in major industrial regions, including Maharashtra automotive clusters, Gujarat petrochemical complexes, Tamil Nadu manufacturing zones, and Karnataka aerospace hubs, where equipment manufacturers, power plants, and refineries are implementing precision expansion joint solutions for equipment optimization. Distribution channels through industrial distributors, OEM partnerships, and engineering procurement contractors expand deployment across manufacturing clusters and infrastructure development sites. The country's Make in India programs and capital goods manufacturing initiatives provide policy support for component localization, including technology transfer agreements and domestic production incentives.
Key market factors:
In major industrial centers, semiconductor fabrication facilities, and process industry complexes, the adoption of metal bellow systems is accelerating across chip manufacturing equipment, chemical processing expansions, and infrastructure pipeline projects, driven by domestic technology advancement and industrial modernization programs. The market demonstrates strong growth momentum with a CAGR of 4.8% through 2035, linked to comprehensive semiconductor industry expansion and increasing focus on process equipment reliability enhancement solutions. Chinese manufacturers are implementing advanced bellow technology and precision manufacturing platforms to serve domestic equipment demand while meeting international quality standards in key industrial regions including Yangtze River Delta, Pearl River Delta, Beijing-Tianjin-Hebei, and Western China industrial parks. The country's integrated circuit development programs and Made in China 2025 initiatives create sustained demand for precision component solutions.
South Korea's expanding electronics and energy sector demonstrates sophisticated implementation of metal bellow systems, with documented case studies showing 98-plus percent reliability achievement in semiconductor process equipment and LNG regasification facilities through precision welded bellow adoption. The country's industrial infrastructure in major manufacturing regions, including Gyeonggi semiconductor clusters, Ulsan petrochemical complexes, South Coast shipbuilding zones, and Incheon industrial parks, showcases integration of advanced bellow technologies with existing equipment manufacturing practices, leveraging expertise in precision fabrication and quality control systems. Korean manufacturers emphasize dimensional accuracy and material certification, creating demand for premium bellow solutions that support export-oriented equipment and stringent performance requirements. The market maintains strong growth through focus on foundry equipment and LNG infrastructure, with a CAGR of 3.9% through 2035.
Key development areas:
The Japanese market leads in aerospace component excellence based on integration with commercial aircraft supply chains and sophisticated precision manufacturing systems for enhanced export competitiveness. The country shows solid potential with a CAGR of 3.5% through 2035, driven by aerospace subassembly production and hydrogen technology development across major industrial regions, including Tokyo metropolitan manufacturing, Nagoya aerospace clusters, Osaka industrial zones, and Kyushu technology parks. Japanese manufacturers are adopting technology-enhanced bellow systems for compliance with international aerospace standards and performance specifications, particularly in aircraft engine components requiring stringent certification and in hydrogen infrastructure applications with demanding material compatibility requirements. Technology deployment channels through trading companies, tier-1 aerospace suppliers, and precision component manufacturers expand coverage across diverse industrial applications.
Leading market segments:
The United Kingdom's metal bellow market demonstrates sophisticated implementation focused on aerospace maintenance and offshore energy applications, with documented integration of certified bellows achieving extended service life in aircraft engine overhaul and oil and gas platform upgrades. The country maintains steady growth momentum with a CAGR of 3.1% through 2035, driven by aerospace MRO activity and operators' emphasis on component reliability principles aligned with safety-critical applications. Major industrial regions, including Southeast England aerospace clusters, Scottish offshore energy zones, Midlands manufacturing centers, and Northern England process industries, showcase advanced deployment of precision bellows that integrate seamlessly with existing equipment infrastructure and stringent quality requirements.
Key market characteristics:
In major industrial regions, automotive manufacturing centers, and chemical processing complexes, equipment manufacturers are implementing bellow programs to enhance powertrain efficiency and meet emissions standards, with documented case studies showing improved turbocharger durability and reduced leak rates through precision welded bellow adoption. The market shows solid growth potential with a CAGR of 2.4% through 2035, linked to ongoing automotive technology advancement, chemical industry debottlenecking requirements, and increasing focus on high-efficiency turbomachinery solutions. German manufacturers are adopting precision bellow systems and advanced material specifications to maintain product leadership while complying with environmental regulations in sensitive applications including Rhine Valley chemical parks, Southern Germany automotive clusters, and Northern industrial regions.
Market development factors:
The United States metal bellow market demonstrates mature implementation focused on space launch vehicle systems and refinery turnaround applications, with documented integration achieving mission-critical reliability in rocket propulsion systems and extended run lengths in petrochemical processing equipment. The country maintains steady growth through aerospace supply chain re-shoring and semiconductor equipment manufacturing expansion, with a CAGR of 2.2% through 2035, driven by comprehensive space industry development and policy support for domestic manufacturing capability. Major industrial regions, including Gulf Coast petrochemical corridor, California aerospace clusters, Texas space industry, and Midwest manufacturing centers, showcase advanced bellow deployment where manufacturers integrate premium components with existing industrial infrastructure for enhanced reliability.
Key market characteristics:
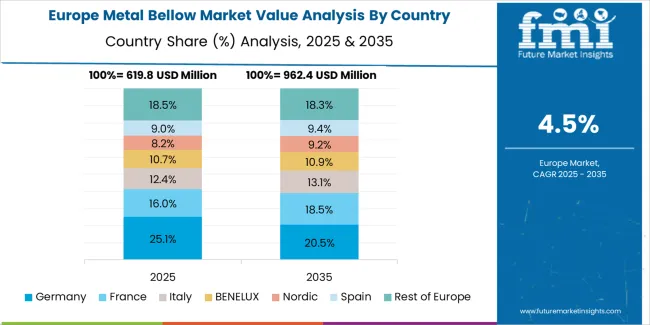
The metal bellow market in Europe is projected to grow from USD 0.8 billion in 2025 to USD 1.5 billion by 2035, registering a CAGR of 6.5% over the forecast period. Germany is expected to maintain its leadership position with a 22% market share in 2025, declining slightly to 21.5% by 2035, supported by its advanced turbomachinery industry and major automotive manufacturing programs, including Southern Germany engineering clusters, Rhine Valley chemical complexes, and Northern industrial regions.
France follows with a 14% share in 2025, projected to reach 14.3% by 2035, driven by comprehensive aerospace manufacturing programs and nuclear power plant maintenance implementing precision bellow systems. The United Kingdom holds a 13% share in 2025, expected to rise to 13.4% by 2035 through aerospace MRO expansion and offshore energy infrastructure upgrades. Italy commands an 11% share in 2025, reaching 11.2% by 2035, backed by power generation equipment manufacturing and industrial machinery production. The Nordic region accounts for 8% in 2025, rising to 8.3% by 2035 on district energy systems and process industry modernization. Rest of Western Europe holds 20% in 2025, expanding to 20.5% by 2035 through distributed industrial manufacturing and equipment upgrades. Eastern Europe is anticipated to hold 12% in 2025, adjusting to 10.8% by 2035, attributed to steady industrial modernization across automotive and process industries. Growth is underpinned by aerospace engines and MRO, turbomachinery applications, chemical processing upgrades, and emissions-driven retrofits in power and district-energy networks across the European industrial base.
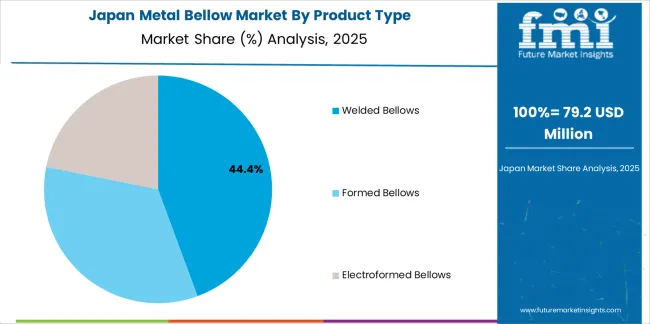
The Japanese metal bellow market demonstrates a mature and quality-focused landscape, characterized by sophisticated integration of precision welded bellows and advanced material certification systems with existing aerospace component manufacturing infrastructure across tier-1 supplier operations, export-oriented production facilities, and precision engineering communities. Japan's emphasis on manufacturing excellence and stringent quality control drives demand for certified metal bellows that support aerospace reliability commitments and performance expectations in premium international supply chain standards. The market benefits from strong partnerships between international aerospace OEMs and domestic component manufacturers including precision fabrication cooperatives, creating comprehensive quality ecosystems that prioritize dimensional accuracy and material traceability programs. Aerospace clusters in Nagoya, Tokyo metropolitan area, and other major manufacturing centers showcase advanced bellow implementations where component programs achieve 99.9% acceptance rates through precision laser-welding systems and integrated inspection platforms.
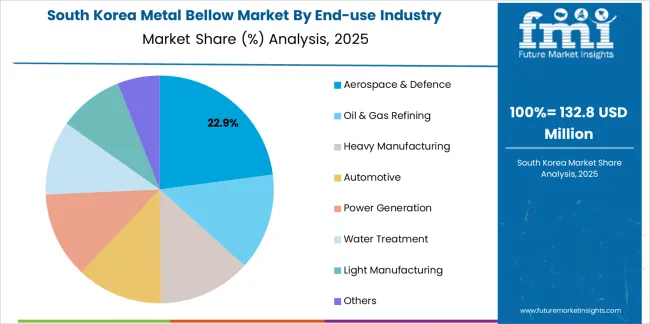
The South Korean metal bellow market is characterized by growing international technology provider presence, with companies maintaining significant positions through comprehensive technical support and manufacturing process capabilities for semiconductor equipment and high-specification industrial applications. The market demonstrates increasing emphasis on ultra-high-purity materials and precision fabrication, as Korean equipment manufacturers increasingly demand certified bellow components that integrate with domestic semiconductor process tools and sophisticated manufacturing equipment platforms deployed across major fabrication facilities. Regional precision manufacturers are gaining market share through strategic partnerships with international bellow specialists, offering specialized services including application-specific design support and customized material programs for intensive semiconductor and electronics manufacturing operations. The competitive landscape shows increasing collaboration between multinational component companies and Korean precision engineering specialists, creating hybrid business models that combine international material expertise with local manufacturing capabilities and advanced quality control systems.
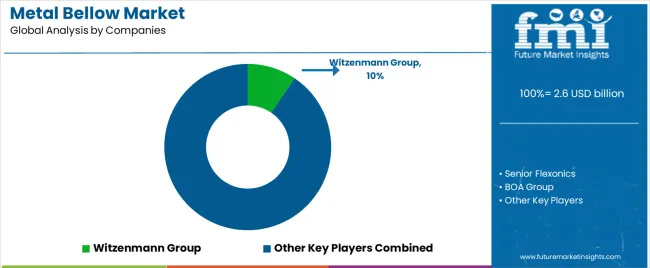
The metal bellow market features approximately 12-15 meaningful players with moderate concentration, where the top three companies control roughly 25-30% of global market share through established manufacturing capabilities and comprehensive product portfolios. Competition centers on manufacturing precision, material expertise, and application engineering capabilities rather than price competition alone. Witzenmann Group leads with approximately 9.5% market share through its comprehensive flexible metal components and expansion joint portfolio.
Market leaders include Witzenmann Group, Senior Flexonics, and BOA Group, which maintain competitive advantages through global manufacturing infrastructure, extensive application engineering networks, and deep expertise in precision welding and forming technologies across multiple industrial segments, creating trust and reliability advantages with aerospace OEMs and industrial equipment manufacturers. These companies leverage research and development capabilities in hydrogen-compatible materials and ongoing technical support relationships to defend market positions while expanding into alternative fuel infrastructure solutions and advanced aerospace applications.
Challengers encompass EagleBurgmann and Servometer, which compete through specialized mechanical seal applications and precision bellows for instrumentation markets. Product specialists, including Hyspan Precision Products, MW Industries, and KSM Corporation, focus on specific manufacturing processes or application segments, offering differentiated capabilities in electroforming, automotive exhaust, and custom-engineered solutions. Regional players and emerging manufacturers create competitive pressure through localized production advantages and responsive engineering support capabilities, particularly in high-growth markets including India and China, where proximity to end-users provides advantages in lead times and application development relationships.
Metal bellows represent essential expansion joint solutions that enable equipment designers to achieve 10,000-plus cycle fatigue life compared to conventional flexible connections, delivering superior reliability and leak-tightness with precise thermal expansion compensation in demanding industrial applications. With the market projected to grow from USD 2.6 billion in 2025 to USD 4.8 billion by 2035 at a 6.3% CAGR, these precision-engineered components offer compelling advantages - leak-free performance, extended service life, and operational reliability opportunities - making them essential for aerospace and defense operations (22% market share), oil and gas refining (18.5% share), and industrial equipment seeking alternatives to conventional expansion joints that cannot provide the combination of flexibility, pressure containment, and leak-tightness required for critical process and propulsion systems.
How Governments Could Spur Local Production and Adoption?
How Industry Bodies Could Support Market Development?
How OEMs and Technology Players Could Strengthen the Ecosystem?
How Suppliers Could Navigate the Shift?
How Investors and Financial Enablers Could Unlock Value?
| Item | Value |
|---|---|
| Quantitative Units | USD 2.6 billion |
| Product Type | Welded Bellows, Formed Bellows, Electroformed Bellows |
| Material | Stainless Steel Alloys, Nickel Alloys, Titanium Alloys, Others |
| End-use Industry | Aerospace & Defence, Oil & Gas Refining, Heavy Manufacturing, Automotive, Power Generation, Water Treatment, Light Manufacturing, Others |
| Application | Engine Exhaust Systems, Gas Turbines, Steam Turbines, Fuel-gas Duct Systems, Conventional Boilers, Others |
| Regions Covered | Asia Pacific, Europe, North America, Latin America, Middle East & Africa |
| Country Covered | India, China, South Korea, Japan, United Kingdom, Germany, United States, and 40+ countries |
| Key Companies Profiled | Witzenmann Group, Senior Flexonics, BOA Group, EagleBurgmann, Servometer, Hyspan Precision Products, MW Industries, KSM Corporation, Technoflex Corporation, Duraflex Inc. |
| Additional Attributes | Dollar sales by product type, material, end-use industry, and application categories, regional adoption trends across Asia Pacific, North America, and Europe, competitive landscape with metal bellow manufacturers and precision fabrication networks, technology requirements and specifications, integration with equipment design platforms and thermal management systems, innovations in hydrogen-compatible materials and laser-welding technology, and development of specialized metal bellow solutions with enhanced fatigue life and operational reliability capabilities. |
The global metal bellow market is estimated to be valued at USD 2.6 billion in 2025.
The market size for the metal bellow market is projected to reach USD 4.8 billion by 2035.
The metal bellow market is expected to grow at a 6.3% CAGR between 2025 and 2035.
The key product types in metal bellow market are welded bellows, formed bellows and electroformed bellows.
In terms of end-use industry, aerospace & defence segment to command 22.0% share in the metal bellow market in 2025.


Full Research Suite comprises of:
Market outlook & trends analysis
Interviews & case studies
Strategic recommendations
Vendor profiles & capabilities analysis
5-year forecasts
8 regions and 60+ country-level data splits
Market segment data splits
12 months of continuous data updates
DELIVERED AS:
PDF EXCEL ONLINE
Metal Straw Market Size and Share Forecast Outlook 2025 to 2035
Metal Can Market Size and Share Forecast Outlook 2025 to 2035
Metal IBC Market Forecast and Outlook 2025 to 2035
Metalized Barrier Film Market Forecast and Outlook 2025 to 2035
Metal Packaging Market Size and Share Forecast Outlook 2025 to 2035
Metal based Safety Gratings Market Size and Share Forecast Outlook 2025 to 2035
Metal Modifiers Market Size and Share Forecast Outlook 2025 to 2035
Metallic Stearate Market Size and Share Forecast Outlook 2025 to 2035
Metallic Labels Market Size and Share Forecast Outlook 2025 to 2035
Metal Recycling Market Size and Share Forecast Outlook 2025 to 2035
Metal Forming Fluids Market Size and Share Forecast Outlook 2025 to 2035
Metal Removal Fluids Market Size and Share Forecast Outlook 2025 to 2035
Metal Deactivators Market Size and Share Forecast Outlook 2025 to 2035
Metal Film Analog Potentiometers Market Size and Share Forecast Outlook 2025 to 2035
Metal Oxide Film Fixed Resistor Market Size and Share Forecast Outlook 2025 to 2035
Metal Membrane Ammonia Cracker Market Size and Share Forecast Outlook 2025 to 2035
Metal Testing Equipment Market Size and Share Forecast Outlook 2025 to 2035
Metal Analyzers Market Size and Share Forecast Outlook 2025 to 2035
Metal Fiber Felt Market Size and Share Forecast Outlook 2025 to 2035
Metal Wheel Chock Market Size and Share Forecast Outlook 2025 to 2035

Thank you!
You will receive an email from our Business Development Manager. Please be sure to check your SPAM/JUNK folder too.
Chat With
MaRIA