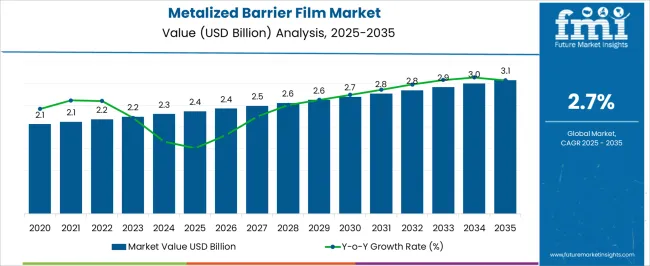
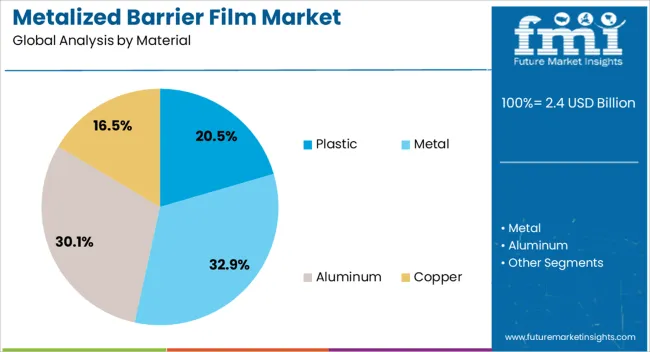
The Metalized Barrier Film Market size was valued at USD 2.3 billion in 2024 and is anticipated to reach USD 2.9 billion by 2034. The market is estimated to witness a CAGR of 2.7% from 2024 to 2034. The globalization of the food and beverage industry and emergent health concerns among consumers have led to a shift in the market.
Consumption Analysis of the Metalized Barrier Film Market
Attributes | Details |
---|---|
Metalized Barrier Films Market Value for 2024 | USD 2.3 billion |
Forecast Market Value for 2034 | USD 2.9 billion |
Value-based CAGR from 2024 to 2034 | 2.7% |
The market for metalized barrier films grew at a CAGR of 1.90% from 2019 to 2023. However, sales have increased at a prompter pace, showcasing a CAGR of 2.70% from 2024 to 2034.
Attributes | Details |
---|---|
Historical CAGR for 2019 to 2023 | 1.9% |
Metalized barrier films are expensive, non-microwavable, and susceptible to degradation due to moisture absorption, limiting their market development and requiring controlled storage conditions.
Acute aspects that are anticipated to influence the demand for metalized barrier films through 2034.
Market players are going to desire to be prudent and flexible over the anticipated period since these challenging attributes position the industry for accomplishment in subsequent decades.
Ready-to-eat Food Packaging Generating the Demand for Metalized Barrier Films
Development of Retail Supply Stores in Emerging Nations Fuels the Demand for Metalized Barrier Films
Demand for Specialized Metallic Barrier Packaging Is On the Rise in Chemical Packaging
An in-depth segmental analysis of the metalized barrier films market indicates that packaging applications are in significant demand. Similarly, the food and beverage sector develops an emergent demand based on the end-use industry.
Attributes | Details |
---|---|
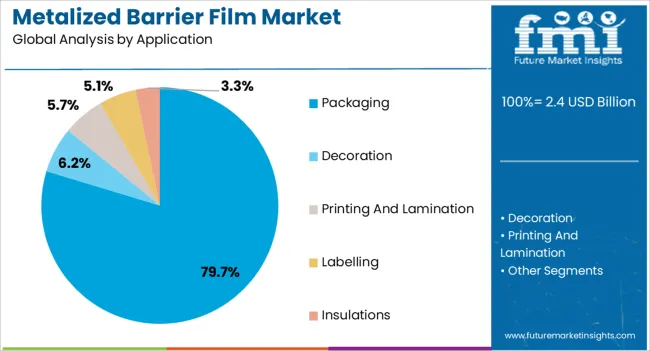
Top Application | Packaging |
Market share in 2024 | 79.7% |
The demand for metalized barrier film packaging is significant in 2024, with a market share of 79.7%. The following aspects display the demand for metalized barrier film packaging:
Attributes | Details |
---|---|
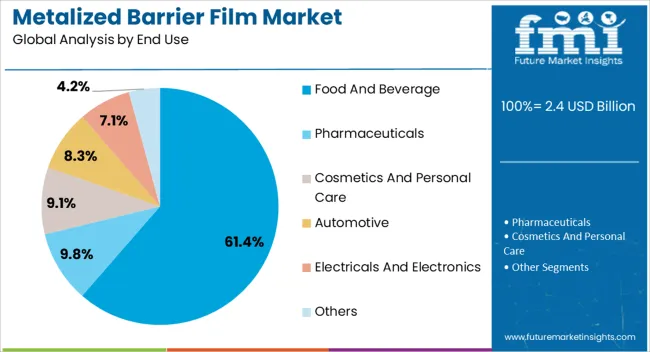
Top End User | Food and Beverage |
Market share in 2024 | 61.4% |
The food and beverage sector utilizes metalized barrier films ominously, which is anticipated to acquire almost 61.4% market share in 2024. The development of the food and beverage sector demands the following aspects:
The following section explains the demand for metalized barrier films in various countries. Chinese and Indian industries are experiencing intermediate growth in the upcoming decade, while Thailand and South Korea are progressing in metalized barrier films, with Spain having a lower CAGR than other nations.
Countries | CAGR from 2024 to 2034 |
---|---|
Spain | 2.1% |
Thailand | 4.1% |
China | 5.1% |
India | 6.5% |
South Korea | 2.4% |
The metalized barrier film industry in India is projected to experience a CAGR of 6.5% through 2034. Here are a few of the major aspects:
Demand for metalized barrier films in China is estimated to develop at a CAGR of 5.1% through 2034. The following factors are propelling the demand for metalized barrier films in China:
The demand for metalized barrier films in Thailand is anticipated to showcase a CAGR of 4.1% from 2024 to 2034. Some of the primary trends in the industry are:
The demand for metalized barrier films in South Korea is projected to report a CAGR of 2.4% from 2024 to 2034. Some of the primary trends are:
The metalized barrier films industry in Spain is supposed to display a CAGR of 2.1% through 2034. Among the primary drivers of the market are:
The metalized barrier film market is competitive and has evolved significantly in recent years. Metalized barrier films are in high demand, especially in emerging countries. Manufacturers invest heavily in research and development, employ pristine machinery, and construct manufacturing facilities to keep up with the market demand and competition.
Such methodologies are anticipated to improve production capabilities and stay ahead of the competition.
The major companies in the metalized barrier films market are working to improve their distribution networks to make their products more accessible to customers.
They want to meet the changing needs of consumers and maintain their market share in an industry that is growing quickly. Companies leveraging new technologies to meet consumer demands are expected to propel the metalized barrier films market growth in the forthcoming decade.
Recent Developments in the Metalized Barrier Film Market
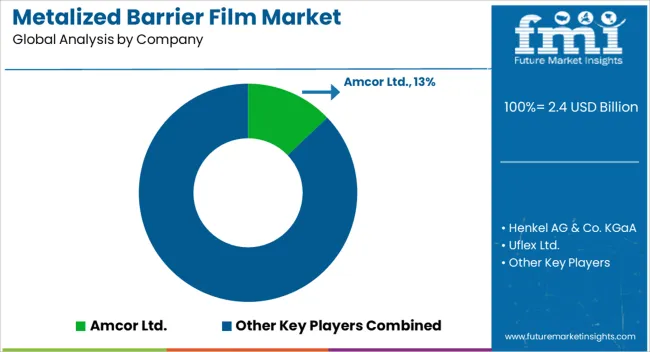
Table 1: Global Market Value (US$ Million) Forecast by Region, 2019 to 2034
Table 2: Global Market Volume (Tons) Forecast by Region, 2019 to 2034
Table 3: Global Market Value (US$ Million) Forecast by Material, 2019 to 2034
Table 4: Global Market Volume (Tons) Forecast by Material, 2019 to 2034
Table 5: Global Market Value (US$ Million) Forecast by Barrier, 2019 to 2034
Table 6: Global Market Volume (Tons) Forecast by Barrier, 2019 to 2034
Table 7: Global Market Value (US$ Million) Forecast by End Use, 2019 to 2034
Table 8: Global Market Volume (Tons) Forecast by End Use, 2019 to 2034
Table 9: Global Market Value (US$ Million) Forecast by Application, 2019 to 2034
Table 10: Global Market Volume (Tons) Forecast by Application, 2019 to 2034
Table 11: North America Market Value (US$ Million) Forecast by Country, 2019 to 2034
Table 12: North America Market Volume (Tons) Forecast by Country, 2019 to 2034
Table 13: North America Market Value (US$ Million) Forecast by Material, 2019 to 2034
Table 14: North America Market Volume (Tons) Forecast by Material, 2019 to 2034
Table 15: North America Market Value (US$ Million) Forecast by Barrier, 2019 to 2034
Table 16: North America Market Volume (Tons) Forecast by Barrier, 2019 to 2034
Table 17: North America Market Value (US$ Million) Forecast by End Use, 2019 to 2034
Table 18: North America Market Volume (Tons) Forecast by End Use, 2019 to 2034
Table 19: North America Market Value (US$ Million) Forecast by Application, 2019 to 2034
Table 20: North America Market Volume (Tons) Forecast by Application, 2019 to 2034
Table 21: Latin America Market Value (US$ Million) Forecast by Country, 2019 to 2034
Table 22: Latin America Market Volume (Tons) Forecast by Country, 2019 to 2034
Table 23: Latin America Market Value (US$ Million) Forecast by Material, 2019 to 2034
Table 24: Latin America Market Volume (Tons) Forecast by Material, 2019 to 2034
Table 25: Latin America Market Value (US$ Million) Forecast by Barrier, 2019 to 2034
Table 26: Latin America Market Volume (Tons) Forecast by Barrier, 2019 to 2034
Table 27: Latin America Market Value (US$ Million) Forecast by End Use, 2019 to 2034
Table 28: Latin America Market Volume (Tons) Forecast by End Use, 2019 to 2034
Table 29: Latin America Market Value (US$ Million) Forecast by Application, 2019 to 2034
Table 30: Latin America Market Volume (Tons) Forecast by Application, 2019 to 2034
Table 31: Western Europe Market Value (US$ Million) Forecast by Country, 2019 to 2034
Table 32: Western Europe Market Volume (Tons) Forecast by Country, 2019 to 2034
Table 33: Western Europe Market Value (US$ Million) Forecast by Material, 2019 to 2034
Table 34: Western Europe Market Volume (Tons) Forecast by Material, 2019 to 2034
Table 35: Western Europe Market Value (US$ Million) Forecast by Barrier, 2019 to 2034
Table 36: Western Europe Market Volume (Tons) Forecast by Barrier, 2019 to 2034
Table 37: Western Europe Market Value (US$ Million) Forecast by End Use, 2019 to 2034
Table 38: Western Europe Market Volume (Tons) Forecast by End Use, 2019 to 2034
Table 39: Western Europe Market Value (US$ Million) Forecast by Application, 2019 to 2034
Table 40: Western Europe Market Volume (Tons) Forecast by Application, 2019 to 2034
Table 41: Eastern Europe Market Value (US$ Million) Forecast by Country, 2019 to 2034
Table 42: Eastern Europe Market Volume (Tons) Forecast by Country, 2019 to 2034
Table 43: Eastern Europe Market Value (US$ Million) Forecast by Material, 2019 to 2034
Table 44: Eastern Europe Market Volume (Tons) Forecast by Material, 2019 to 2034
Table 45: Eastern Europe Market Value (US$ Million) Forecast by Barrier, 2019 to 2034
Table 46: Eastern Europe Market Volume (Tons) Forecast by Barrier, 2019 to 2034
Table 47: Eastern Europe Market Value (US$ Million) Forecast by End Use, 2019 to 2034
Table 48: Eastern Europe Market Volume (Tons) Forecast by End Use, 2019 to 2034
Table 49: Eastern Europe Market Value (US$ Million) Forecast by Application, 2019 to 2034
Table 50: Eastern Europe Market Volume (Tons) Forecast by Application, 2019 to 2034
Table 51: South Asia and Pacific Market Value (US$ Million) Forecast by Country, 2019 to 2034
Table 52: South Asia and Pacific Market Volume (Tons) Forecast by Country, 2019 to 2034
Table 53: South Asia and Pacific Market Value (US$ Million) Forecast by Material, 2019 to 2034
Table 54: South Asia and Pacific Market Volume (Tons) Forecast by Material, 2019 to 2034
Table 55: South Asia and Pacific Market Value (US$ Million) Forecast by Barrier, 2019 to 2034
Table 56: South Asia and Pacific Market Volume (Tons) Forecast by Barrier, 2019 to 2034
Table 57: South Asia and Pacific Market Value (US$ Million) Forecast by End Use, 2019 to 2034
Table 58: South Asia and Pacific Market Volume (Tons) Forecast by End Use, 2019 to 2034
Table 59: South Asia and Pacific Market Value (US$ Million) Forecast by Application, 2019 to 2034
Table 60: South Asia and Pacific Market Volume (Tons) Forecast by Application, 2019 to 2034
Table 61: East Asia Market Value (US$ Million) Forecast by Country, 2019 to 2034
Table 62: East Asia Market Volume (Tons) Forecast by Country, 2019 to 2034
Table 63: East Asia Market Value (US$ Million) Forecast by Material, 2019 to 2034
Table 64: East Asia Market Volume (Tons) Forecast by Material, 2019 to 2034
Table 65: East Asia Market Value (US$ Million) Forecast by Barrier, 2019 to 2034
Table 66: East Asia Market Volume (Tons) Forecast by Barrier, 2019 to 2034
Table 67: East Asia Market Value (US$ Million) Forecast by End Use, 2019 to 2034
Table 68: East Asia Market Volume (Tons) Forecast by End Use, 2019 to 2034
Table 69: East Asia Market Value (US$ Million) Forecast by Application, 2019 to 2034
Table 70: East Asia Market Volume (Tons) Forecast by Application, 2019 to 2034
Table 71: Middle East and Africa Market Value (US$ Million) Forecast by Country, 2019 to 2034
Table 72: Middle East and Africa Market Volume (Tons) Forecast by Country, 2019 to 2034
Table 73: Middle East and Africa Market Value (US$ Million) Forecast by Material, 2019 to 2034
Table 74: Middle East and Africa Market Volume (Tons) Forecast by Material, 2019 to 2034
Table 75: Middle East and Africa Market Value (US$ Million) Forecast by Barrier, 2019 to 2034
Table 76: Middle East and Africa Market Volume (Tons) Forecast by Barrier, 2019 to 2034
Table 77: Middle East and Africa Market Value (US$ Million) Forecast by End Use, 2019 to 2034
Table 78: Middle East and Africa Market Volume (Tons) Forecast by End Use, 2019 to 2034
Table 79: Middle East and Africa Market Value (US$ Million) Forecast by Application, 2019 to 2034
Table 80: Middle East and Africa Market Volume (Tons) Forecast by Application, 2019 to 2034
Figure 1: Global Market Value (US$ Million) by Material, 2024 to 2034
Figure 2: Global Market Value (US$ Million) by Barrier, 2024 to 2034
Figure 3: Global Market Value (US$ Million) by End Use, 2024 to 2034
Figure 4: Global Market Value (US$ Million) by Application, 2024 to 2034
Figure 5: Global Market Value (US$ Million) by Region, 2024 to 2034
Figure 6: Global Market Value (US$ Million) Analysis by Region, 2019 to 2034
Figure 7: Global Market Volume (Tons) Analysis by Region, 2019 to 2034
Figure 8: Global Market Value Share (%) and BPS Analysis by Region, 2024 to 2034
Figure 9: Global Market Y-o-Y Growth (%) Projections by Region, 2024 to 2034
Figure 10: Global Market Value (US$ Million) Analysis by Material, 2019 to 2034
Figure 11: Global Market Volume (Tons) Analysis by Material, 2019 to 2034
Figure 12: Global Market Value Share (%) and BPS Analysis by Material, 2024 to 2034
Figure 13: Global Market Y-o-Y Growth (%) Projections by Material, 2024 to 2034
Figure 14: Global Market Value (US$ Million) Analysis by Barrier, 2019 to 2034
Figure 15: Global Market Volume (Tons) Analysis by Barrier, 2019 to 2034
Figure 16: Global Market Value Share (%) and BPS Analysis by Barrier, 2024 to 2034
Figure 17: Global Market Y-o-Y Growth (%) Projections by Barrier, 2024 to 2034
Figure 18: Global Market Value (US$ Million) Analysis by End Use, 2019 to 2034
Figure 19: Global Market Volume (Tons) Analysis by End Use, 2019 to 2034
Figure 20: Global Market Value Share (%) and BPS Analysis by End Use, 2024 to 2034
Figure 21: Global Market Y-o-Y Growth (%) Projections by End Use, 2024 to 2034
Figure 22: Global Market Value (US$ Million) Analysis by Application, 2019 to 2034
Figure 23: Global Market Volume (Tons) Analysis by Application, 2019 to 2034
Figure 24: Global Market Value Share (%) and BPS Analysis by Application, 2024 to 2034
Figure 25: Global Market Y-o-Y Growth (%) Projections by Application, 2024 to 2034
Figure 26: Global Market Attractiveness by Material, 2024 to 2034
Figure 27: Global Market Attractiveness by Barrier, 2024 to 2034
Figure 28: Global Market Attractiveness by End Use, 2024 to 2034
Figure 29: Global Market Attractiveness by Application, 2024 to 2034
Figure 30: Global Market Attractiveness by Region, 2024 to 2034
Figure 31: North America Market Value (US$ Million) by Material, 2024 to 2034
Figure 32: North America Market Value (US$ Million) by Barrier, 2024 to 2034
Figure 33: North America Market Value (US$ Million) by End Use, 2024 to 2034
Figure 34: North America Market Value (US$ Million) by Application, 2024 to 2034
Figure 35: North America Market Value (US$ Million) by Country, 2024 to 2034
Figure 36: North America Market Value (US$ Million) Analysis by Country, 2019 to 2034
Figure 37: North America Market Volume (Tons) Analysis by Country, 2019 to 2034
Figure 38: North America Market Value Share (%) and BPS Analysis by Country, 2024 to 2034
Figure 39: North America Market Y-o-Y Growth (%) Projections by Country, 2024 to 2034
Figure 40: North America Market Value (US$ Million) Analysis by Material, 2019 to 2034
Figure 41: North America Market Volume (Tons) Analysis by Material, 2019 to 2034
Figure 42: North America Market Value Share (%) and BPS Analysis by Material, 2024 to 2034
Figure 43: North America Market Y-o-Y Growth (%) Projections by Material, 2024 to 2034
Figure 44: North America Market Value (US$ Million) Analysis by Barrier, 2019 to 2034
Figure 45: North America Market Volume (Tons) Analysis by Barrier, 2019 to 2034
Figure 46: North America Market Value Share (%) and BPS Analysis by Barrier, 2024 to 2034
Figure 47: North America Market Y-o-Y Growth (%) Projections by Barrier, 2024 to 2034
Figure 48: North America Market Value (US$ Million) Analysis by End Use, 2019 to 2034
Figure 49: North America Market Volume (Tons) Analysis by End Use, 2019 to 2034
Figure 50: North America Market Value Share (%) and BPS Analysis by End Use, 2024 to 2034
Figure 51: North America Market Y-o-Y Growth (%) Projections by End Use, 2024 to 2034
Figure 52: North America Market Value (US$ Million) Analysis by Application, 2019 to 2034
Figure 53: North America Market Volume (Tons) Analysis by Application, 2019 to 2034
Figure 54: North America Market Value Share (%) and BPS Analysis by Application, 2024 to 2034
Figure 55: North America Market Y-o-Y Growth (%) Projections by Application, 2024 to 2034
Figure 56: North America Market Attractiveness by Material, 2024 to 2034
Figure 57: North America Market Attractiveness by Barrier, 2024 to 2034
Figure 58: North America Market Attractiveness by End Use, 2024 to 2034
Figure 59: North America Market Attractiveness by Application, 2024 to 2034
Figure 60: North America Market Attractiveness by Country, 2024 to 2034
Figure 61: Latin America Market Value (US$ Million) by Material, 2024 to 2034
Figure 62: Latin America Market Value (US$ Million) by Barrier, 2024 to 2034
Figure 63: Latin America Market Value (US$ Million) by End Use, 2024 to 2034
Figure 64: Latin America Market Value (US$ Million) by Application, 2024 to 2034
Figure 65: Latin America Market Value (US$ Million) by Country, 2024 to 2034
Figure 66: Latin America Market Value (US$ Million) Analysis by Country, 2019 to 2034
Figure 67: Latin America Market Volume (Tons) Analysis by Country, 2019 to 2034
Figure 68: Latin America Market Value Share (%) and BPS Analysis by Country, 2024 to 2034
Figure 69: Latin America Market Y-o-Y Growth (%) Projections by Country, 2024 to 2034
Figure 70: Latin America Market Value (US$ Million) Analysis by Material, 2019 to 2034
Figure 71: Latin America Market Volume (Tons) Analysis by Material, 2019 to 2034
Figure 72: Latin America Market Value Share (%) and BPS Analysis by Material, 2024 to 2034
Figure 73: Latin America Market Y-o-Y Growth (%) Projections by Material, 2024 to 2034
Figure 74: Latin America Market Value (US$ Million) Analysis by Barrier, 2019 to 2034
Figure 75: Latin America Market Volume (Tons) Analysis by Barrier, 2019 to 2034
Figure 76: Latin America Market Value Share (%) and BPS Analysis by Barrier, 2024 to 2034
Figure 77: Latin America Market Y-o-Y Growth (%) Projections by Barrier, 2024 to 2034
Figure 78: Latin America Market Value (US$ Million) Analysis by End Use, 2019 to 2034
Figure 79: Latin America Market Volume (Tons) Analysis by End Use, 2019 to 2034
Figure 80: Latin America Market Value Share (%) and BPS Analysis by End Use, 2024 to 2034
Figure 81: Latin America Market Y-o-Y Growth (%) Projections by End Use, 2024 to 2034
Figure 82: Latin America Market Value (US$ Million) Analysis by Application, 2019 to 2034
Figure 83: Latin America Market Volume (Tons) Analysis by Application, 2019 to 2034
Figure 84: Latin America Market Value Share (%) and BPS Analysis by Application, 2024 to 2034
Figure 85: Latin America Market Y-o-Y Growth (%) Projections by Application, 2024 to 2034
Figure 86: Latin America Market Attractiveness by Material, 2024 to 2034
Figure 87: Latin America Market Attractiveness by Barrier, 2024 to 2034
Figure 88: Latin America Market Attractiveness by End Use, 2024 to 2034
Figure 89: Latin America Market Attractiveness by Application, 2024 to 2034
Figure 90: Latin America Market Attractiveness by Country, 2024 to 2034
Figure 91: Western Europe Market Value (US$ Million) by Material, 2024 to 2034
Figure 92: Western Europe Market Value (US$ Million) by Barrier, 2024 to 2034
Figure 93: Western Europe Market Value (US$ Million) by End Use, 2024 to 2034
Figure 94: Western Europe Market Value (US$ Million) by Application, 2024 to 2034
Figure 95: Western Europe Market Value (US$ Million) by Country, 2024 to 2034
Figure 96: Western Europe Market Value (US$ Million) Analysis by Country, 2019 to 2034
Figure 97: Western Europe Market Volume (Tons) Analysis by Country, 2019 to 2034
Figure 98: Western Europe Market Value Share (%) and BPS Analysis by Country, 2024 to 2034
Figure 99: Western Europe Market Y-o-Y Growth (%) Projections by Country, 2024 to 2034
Figure 100: Western Europe Market Value (US$ Million) Analysis by Material, 2019 to 2034
Figure 101: Western Europe Market Volume (Tons) Analysis by Material, 2019 to 2034
Figure 102: Western Europe Market Value Share (%) and BPS Analysis by Material, 2024 to 2034
Figure 103: Western Europe Market Y-o-Y Growth (%) Projections by Material, 2024 to 2034
Figure 104: Western Europe Market Value (US$ Million) Analysis by Barrier, 2019 to 2034
Figure 105: Western Europe Market Volume (Tons) Analysis by Barrier, 2019 to 2034
Figure 106: Western Europe Market Value Share (%) and BPS Analysis by Barrier, 2024 to 2034
Figure 107: Western Europe Market Y-o-Y Growth (%) Projections by Barrier, 2024 to 2034
Figure 108: Western Europe Market Value (US$ Million) Analysis by End Use, 2019 to 2034
Figure 109: Western Europe Market Volume (Tons) Analysis by End Use, 2019 to 2034
Figure 110: Western Europe Market Value Share (%) and BPS Analysis by End Use, 2024 to 2034
Figure 111: Western Europe Market Y-o-Y Growth (%) Projections by End Use, 2024 to 2034
Figure 112: Western Europe Market Value (US$ Million) Analysis by Application, 2019 to 2034
Figure 113: Western Europe Market Volume (Tons) Analysis by Application, 2019 to 2034
Figure 114: Western Europe Market Value Share (%) and BPS Analysis by Application, 2024 to 2034
Figure 115: Western Europe Market Y-o-Y Growth (%) Projections by Application, 2024 to 2034
Figure 116: Western Europe Market Attractiveness by Material, 2024 to 2034
Figure 117: Western Europe Market Attractiveness by Barrier, 2024 to 2034
Figure 118: Western Europe Market Attractiveness by End Use, 2024 to 2034
Figure 119: Western Europe Market Attractiveness by Application, 2024 to 2034
Figure 120: Western Europe Market Attractiveness by Country, 2024 to 2034
Figure 121: Eastern Europe Market Value (US$ Million) by Material, 2024 to 2034
Figure 122: Eastern Europe Market Value (US$ Million) by Barrier, 2024 to 2034
Figure 123: Eastern Europe Market Value (US$ Million) by End Use, 2024 to 2034
Figure 124: Eastern Europe Market Value (US$ Million) by Application, 2024 to 2034
Figure 125: Eastern Europe Market Value (US$ Million) by Country, 2024 to 2034
Figure 126: Eastern Europe Market Value (US$ Million) Analysis by Country, 2019 to 2034
Figure 127: Eastern Europe Market Volume (Tons) Analysis by Country, 2019 to 2034
Figure 128: Eastern Europe Market Value Share (%) and BPS Analysis by Country, 2024 to 2034
Figure 129: Eastern Europe Market Y-o-Y Growth (%) Projections by Country, 2024 to 2034
Figure 130: Eastern Europe Market Value (US$ Million) Analysis by Material, 2019 to 2034
Figure 131: Eastern Europe Market Volume (Tons) Analysis by Material, 2019 to 2034
Figure 132: Eastern Europe Market Value Share (%) and BPS Analysis by Material, 2024 to 2034
Figure 133: Eastern Europe Market Y-o-Y Growth (%) Projections by Material, 2024 to 2034
Figure 134: Eastern Europe Market Value (US$ Million) Analysis by Barrier, 2019 to 2034
Figure 135: Eastern Europe Market Volume (Tons) Analysis by Barrier, 2019 to 2034
Figure 136: Eastern Europe Market Value Share (%) and BPS Analysis by Barrier, 2024 to 2034
Figure 137: Eastern Europe Market Y-o-Y Growth (%) Projections by Barrier, 2024 to 2034
Figure 138: Eastern Europe Market Value (US$ Million) Analysis by End Use, 2019 to 2034
Figure 139: Eastern Europe Market Volume (Tons) Analysis by End Use, 2019 to 2034
Figure 140: Eastern Europe Market Value Share (%) and BPS Analysis by End Use, 2024 to 2034
Figure 141: Eastern Europe Market Y-o-Y Growth (%) Projections by End Use, 2024 to 2034
Figure 142: Eastern Europe Market Value (US$ Million) Analysis by Application, 2019 to 2034
Figure 143: Eastern Europe Market Volume (Tons) Analysis by Application, 2019 to 2034
Figure 144: Eastern Europe Market Value Share (%) and BPS Analysis by Application, 2024 to 2034
Figure 145: Eastern Europe Market Y-o-Y Growth (%) Projections by Application, 2024 to 2034
Figure 146: Eastern Europe Market Attractiveness by Material, 2024 to 2034
Figure 147: Eastern Europe Market Attractiveness by Barrier, 2024 to 2034
Figure 148: Eastern Europe Market Attractiveness by End Use, 2024 to 2034
Figure 149: Eastern Europe Market Attractiveness by Application, 2024 to 2034
Figure 150: Eastern Europe Market Attractiveness by Country, 2024 to 2034
Figure 151: South Asia and Pacific Market Value (US$ Million) by Material, 2024 to 2034
Figure 152: South Asia and Pacific Market Value (US$ Million) by Barrier, 2024 to 2034
Figure 153: South Asia and Pacific Market Value (US$ Million) by End Use, 2024 to 2034
Figure 154: South Asia and Pacific Market Value (US$ Million) by Application, 2024 to 2034
Figure 155: South Asia and Pacific Market Value (US$ Million) by Country, 2024 to 2034
Figure 156: South Asia and Pacific Market Value (US$ Million) Analysis by Country, 2019 to 2034
Figure 157: South Asia and Pacific Market Volume (Tons) Analysis by Country, 2019 to 2034
Figure 158: South Asia and Pacific Market Value Share (%) and BPS Analysis by Country, 2024 to 2034
Figure 159: South Asia and Pacific Market Y-o-Y Growth (%) Projections by Country, 2024 to 2034
Figure 160: South Asia and Pacific Market Value (US$ Million) Analysis by Material, 2019 to 2034
Figure 161: South Asia and Pacific Market Volume (Tons) Analysis by Material, 2019 to 2034
Figure 162: South Asia and Pacific Market Value Share (%) and BPS Analysis by Material, 2024 to 2034
Figure 163: South Asia and Pacific Market Y-o-Y Growth (%) Projections by Material, 2024 to 2034
Figure 164: South Asia and Pacific Market Value (US$ Million) Analysis by Barrier, 2019 to 2034
Figure 165: South Asia and Pacific Market Volume (Tons) Analysis by Barrier, 2019 to 2034
Figure 166: South Asia and Pacific Market Value Share (%) and BPS Analysis by Barrier, 2024 to 2034
Figure 167: South Asia and Pacific Market Y-o-Y Growth (%) Projections by Barrier, 2024 to 2034
Figure 168: South Asia and Pacific Market Value (US$ Million) Analysis by End Use, 2019 to 2034
Figure 169: South Asia and Pacific Market Volume (Tons) Analysis by End Use, 2019 to 2034
Figure 170: South Asia and Pacific Market Value Share (%) and BPS Analysis by End Use, 2024 to 2034
Figure 171: South Asia and Pacific Market Y-o-Y Growth (%) Projections by End Use, 2024 to 2034
Figure 172: South Asia and Pacific Market Value (US$ Million) Analysis by Application, 2019 to 2034
Figure 173: South Asia and Pacific Market Volume (Tons) Analysis by Application, 2019 to 2034
Figure 174: South Asia and Pacific Market Value Share (%) and BPS Analysis by Application, 2024 to 2034
Figure 175: South Asia and Pacific Market Y-o-Y Growth (%) Projections by Application, 2024 to 2034
Figure 176: South Asia and Pacific Market Attractiveness by Material, 2024 to 2034
Figure 177: South Asia and Pacific Market Attractiveness by Barrier, 2024 to 2034
Figure 178: South Asia and Pacific Market Attractiveness by End Use, 2024 to 2034
Figure 179: South Asia and Pacific Market Attractiveness by Application, 2024 to 2034
Figure 180: South Asia and Pacific Market Attractiveness by Country, 2024 to 2034
Figure 181: East Asia Market Value (US$ Million) by Material, 2024 to 2034
Figure 182: East Asia Market Value (US$ Million) by Barrier, 2024 to 2034
Figure 183: East Asia Market Value (US$ Million) by End Use, 2024 to 2034
Figure 184: East Asia Market Value (US$ Million) by Application, 2024 to 2034
Figure 185: East Asia Market Value (US$ Million) by Country, 2024 to 2034
Figure 186: East Asia Market Value (US$ Million) Analysis by Country, 2019 to 2034
Figure 187: East Asia Market Volume (Tons) Analysis by Country, 2019 to 2034
Figure 188: East Asia Market Value Share (%) and BPS Analysis by Country, 2024 to 2034
Figure 189: East Asia Market Y-o-Y Growth (%) Projections by Country, 2024 to 2034
Figure 190: East Asia Market Value (US$ Million) Analysis by Material, 2019 to 2034
Figure 191: East Asia Market Volume (Tons) Analysis by Material, 2019 to 2034
Figure 192: East Asia Market Value Share (%) and BPS Analysis by Material, 2024 to 2034
Figure 193: East Asia Market Y-o-Y Growth (%) Projections by Material, 2024 to 2034
Figure 194: East Asia Market Value (US$ Million) Analysis by Barrier, 2019 to 2034
Figure 195: East Asia Market Volume (Tons) Analysis by Barrier, 2019 to 2034
Figure 196: East Asia Market Value Share (%) and BPS Analysis by Barrier, 2024 to 2034
Figure 197: East Asia Market Y-o-Y Growth (%) Projections by Barrier, 2024 to 2034
Figure 198: East Asia Market Value (US$ Million) Analysis by End Use, 2019 to 2034
Figure 199: East Asia Market Volume (Tons) Analysis by End Use, 2019 to 2034
Figure 200: East Asia Market Value Share (%) and BPS Analysis by End Use, 2024 to 2034
Figure 201: East Asia Market Y-o-Y Growth (%) Projections by End Use, 2024 to 2034
Figure 202: East Asia Market Value (US$ Million) Analysis by Application, 2019 to 2034
Figure 203: East Asia Market Volume (Tons) Analysis by Application, 2019 to 2034
Figure 204: East Asia Market Value Share (%) and BPS Analysis by Application, 2024 to 2034
Figure 205: East Asia Market Y-o-Y Growth (%) Projections by Application, 2024 to 2034
Figure 206: East Asia Market Attractiveness by Material, 2024 to 2034
Figure 207: East Asia Market Attractiveness by Barrier, 2024 to 2034
Figure 208: East Asia Market Attractiveness by End Use, 2024 to 2034
Figure 209: East Asia Market Attractiveness by Application, 2024 to 2034
Figure 210: East Asia Market Attractiveness by Country, 2024 to 2034
Figure 211: Middle East and Africa Market Value (US$ Million) by Material, 2024 to 2034
Figure 212: Middle East and Africa Market Value (US$ Million) by Barrier, 2024 to 2034
Figure 213: Middle East and Africa Market Value (US$ Million) by End Use, 2024 to 2034
Figure 214: Middle East and Africa Market Value (US$ Million) by Application, 2024 to 2034
Figure 215: Middle East and Africa Market Value (US$ Million) by Country, 2024 to 2034
Figure 216: Middle East and Africa Market Value (US$ Million) Analysis by Country, 2019 to 2034
Figure 217: Middle East and Africa Market Volume (Tons) Analysis by Country, 2019 to 2034
Figure 218: Middle East and Africa Market Value Share (%) and BPS Analysis by Country, 2024 to 2034
Figure 219: Middle East and Africa Market Y-o-Y Growth (%) Projections by Country, 2024 to 2034
Figure 220: Middle East and Africa Market Value (US$ Million) Analysis by Material, 2019 to 2034
Figure 221: Middle East and Africa Market Volume (Tons) Analysis by Material, 2019 to 2034
Figure 222: Middle East and Africa Market Value Share (%) and BPS Analysis by Material, 2024 to 2034
Figure 223: Middle East and Africa Market Y-o-Y Growth (%) Projections by Material, 2024 to 2034
Figure 224: Middle East and Africa Market Value (US$ Million) Analysis by Barrier, 2019 to 2034
Figure 225: Middle East and Africa Market Volume (Tons) Analysis by Barrier, 2019 to 2034
Figure 226: Middle East and Africa Market Value Share (%) and BPS Analysis by Barrier, 2024 to 2034
Figure 227: Middle East and Africa Market Y-o-Y Growth (%) Projections by Barrier, 2024 to 2034
Figure 228: Middle East and Africa Market Value (US$ Million) Analysis by End Use, 2019 to 2034
Figure 229: Middle East and Africa Market Volume (Tons) Analysis by End Use, 2019 to 2034
Figure 230: Middle East and Africa Market Value Share (%) and BPS Analysis by End Use, 2024 to 2034
Figure 231: Middle East and Africa Market Y-o-Y Growth (%) Projections by End Use, 2024 to 2034
Figure 232: Middle East and Africa Market Value (US$ Million) Analysis by Application, 2019 to 2034
Figure 233: Middle East and Africa Market Volume (Tons) Analysis by Application, 2019 to 2034
Figure 234: Middle East and Africa Market Value Share (%) and BPS Analysis by Application, 2024 to 2034
Figure 235: Middle East and Africa Market Y-o-Y Growth (%) Projections by Application, 2024 to 2034
Figure 236: Middle East and Africa Market Attractiveness by Material, 2024 to 2034
Figure 237: Middle East and Africa Market Attractiveness by Barrier, 2024 to 2034
Figure 238: Middle East and Africa Market Attractiveness by End Use, 2024 to 2034
Figure 239: Middle East and Africa Market Attractiveness by Application, 2024 to 2034
Figure 240: Middle East and Africa Market Attractiveness by Country, 2024 to 2034
The metalized barrier film market was valued at USD 2.3 billion in 2024.
The market will be valued at USD 2.9 billion by 2034.
The market is to register a CAGR of 2.7% from 2024 to 2034.
The food and beverage sector are anticipated to acquire a 61.4% market share in 2024.
Explore Similar Insights
Thank you!
You will receive an email from our Business Development Manager. Please be sure to check your SPAM/JUNK folder too.