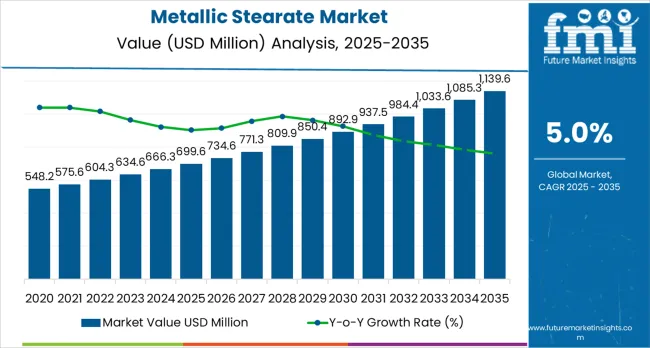
The global metallic stearate market is valued at USD 699.6 million in 2025. It is slated to reach USD 1,139.6 million by 2035, recording an absolute increase of USD 440.0 million over the forecast period. This translates into a total growth of 62.9%, with the market forecast to expand at a compound annual growth rate (CAGR) of 5.0% between 2025 and 2035. As per Future Market Insights, delivering insights for Fortune 1000 firms globally, the overall market size is expected to grow by nearly 1.63X during the same period, supported by increasing demand for PVC stabilizers and polymer processing aids, growing adoption of pharmaceutical-grade lubricants in solid dosage manufacturing, and rising emphasis on low-dust and high-purity metallic stearate formulations across diverse polymer processing, rubber compounding, pharmaceutical, and specialty chemical applications.
| Metric | Value |
|---|---|
| Estimated Value in (2025E) | USD 699.6 million |
| Forecast Value in (2035F) | USD 1,139.6 million |
| Forecast CAGR (2025 to 2035) | 5.0% |
From 2030 to 2035, the market is forecast to grow from USD 899.3 million to USD 1,139.6 million, adding another USD 240.3 million, which constitutes 54.6% of the overall ten-year expansion. This period is expected to be characterized by the expansion of electric vehicle polymer components requiring advanced processing aids, the development of ultra-pure pharmaceutical-grade metallic stearates for specialty applications, and the growth of sustainable construction chemicals and high-performance cosmetic formulations. The growing adoption of environmental health and safety compliance and premium dust-free product forms will drive demand for metallic stearates with enhanced handling characteristics and superior performance features.
Between 2020 and 2025, the metallic stearate market experienced steady growth, driven by increasing polymer processing capacity and growing recognition of metallic stearates as essential processing aids for enhancing product quality and manufacturing efficiency in diverse plastic compounding, rubber processing, pharmaceutical, and specialty chemical applications. The market developed as polymer engineers and pharmaceutical formulators recognized the potential for metallic stearate technology to improve mold release, enhance flow properties, and support quality manufacturing while meeting stringent purity and safety requirements. Technological advancement in micronization and dust-free formulation began emphasizing the critical importance of maintaining workplace safety and consistent product performance in demanding industrial applications.
Market expansion is being supported by the increasing global demand for PVC processing and polyolefin compounding driven by construction activity and packaging growth, alongside the corresponding need for effective processing aids and stabilizers that can improve production efficiency, enhance product quality, and maintain regulatory compliance across various polymer extrusion, rubber processing, pharmaceutical manufacturing, and specialty formulation applications. Modern polymer processors and pharmaceutical manufacturers are increasingly focused on implementing metallic stearate solutions that can deliver superior lubrication properties, provide consistent performance, and meet stringent environmental health and safety standards in critical manufacturing operations.
The growing emphasis on workplace safety and dust-free processing is driving demand for metallic stearates in pastille, granule, and dispersion forms that minimize airborne exposure, improve handling characteristics, and ensure comprehensive occupational health compliance. Polymer industry preference for processing aids that combine excellent technical performance with favorable safety profiles and superior handling properties is creating opportunities for innovative metallic stearate implementations. The rising influence of pharmaceutical quality standards and cosmetic formulation sophistication is also contributing to increased adoption of ultra-pure and micronized metallic stearate grades that provide exceptional performance characteristics without compromising product quality or regulatory compliance.
The market is segmented by product type, application, form, and region. By product type, the market is divided into zinc stearate, calcium stearate, magnesium stearate, aluminum stearate, and others. Based on application, the market is categorized into polymers &plastics, rubber, pharmaceuticals, personal care &cosmetics, construction, and others. By form, the market is classified into powders, pastilles/granules, and dispersions &liquids. Regionally, the market is divided into Asia Pacific, Europe, North America, Latin America, and Middle East &Africa.
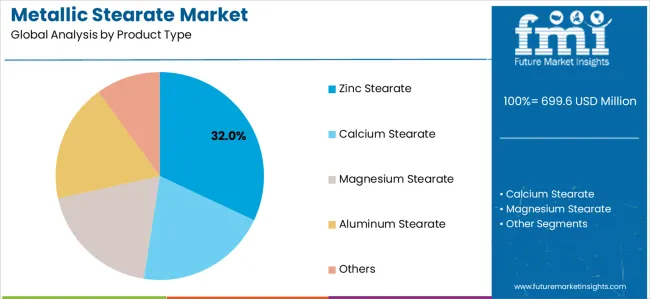
The zinc stearate segment is projected to maintain its leading position in the metallic stearate market in 2025 with a 32.0% market share, reaffirming its role as the preferred product category for polymer processing, rubber compounding, and industrial coating applications. Polymer processors and rubber manufacturers increasingly utilize zinc stearate for its exceptional release properties, effective lubrication characteristics, and proven versatility across diverse processing operations including PVC extrusion, polyolefin compounding, and technical rubber goods manufacturing. Zinc stearate technology's proven effectiveness and broad application versatility directly address the industry requirements for efficient mold release and processing aid functionality across diverse manufacturing platforms and material systems.
This product segment forms the foundation of modern polymer processing operations, as it represents the grade with the greatest application diversity and established performance record across multiple polymer and rubber processing applications. Polymer industry investments in processing efficiency and product quality continue to strengthen adoption among compounders and manufacturers. With increasing demand for improved production throughput and consistent product quality, zinc stearate aligns with both operational objectives and performance requirements, making it the central component of comprehensive polymer processing strategies.
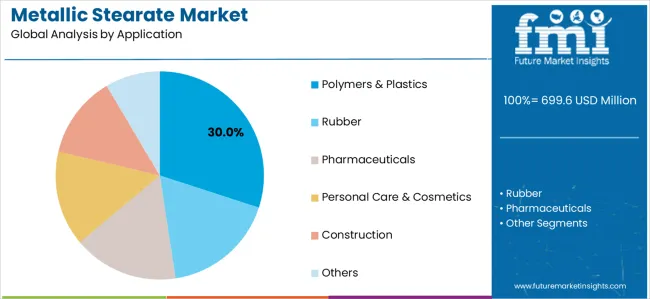
The polymers &plastics application segment is projected to represent the largest share of metallic stearate demand in 2025 with a 30.0% market share, underscoring its critical role as the primary driver for metallic stearate adoption across PVC processing, polyolefin compounding, and engineering resin applications. Polymer processors prefer metallic stearates for production operations due to their superior lubrication properties, excellent mold release characteristics, and ability to enhance processing efficiency while supporting product quality and surface finish requirements. Positioned as essential processing aids for modern polymer manufacturing, metallic stearates offer both operational advantages and product quality benefits.
The segment is supported by continuous innovation in polymer processing technologies and the growing availability of specialized metallic stearate grades that enable superior production efficiency with enhanced product properties and reduced equipment fouling. Additionally, polymer manufacturers are investing in comprehensive processing aid programs to support increasingly complex formulations and demanding application requirements. As polymer production capacity expands and quality standards increase, the polymers &plastics application will continue to dominate the market while supporting advanced metallic stearate utilization and processing optimization strategies.
The powders segment is projected to maintain its leading position in the metallic stearate market in 2025 with a 58.0% market share, reaffirming its role as the preferred form category for cost-effective bulk processing and established manufacturing operations. Metallic stearate users increasingly specify powder forms for their favorable economics, established handling procedures, and proven effectiveness in traditional mixing and blending operations across polymer, rubber, and specialty chemical applications. Powder technology's economic advantages and processing familiarity directly address the industry requirements for cost-effective processing aids that deliver reliable performance in conventional manufacturing systems.
This form segment represents the traditional supply format with the greatest market acceptance and established handling infrastructure across multiple manufacturing operations and application segments. However, growing workplace safety emphasis and dust exposure regulations are driving gradual migration toward dust-free pastilles and granules, particularly in regulated pharmaceutical and cosmetic applications. With occupational health standards requiring reduced airborne particulate exposure, the market is witnessing increasing adoption of alternative forms while powders maintain dominant position due to established usage patterns and economic considerations.
The metallic stearate market is advancing steadily due to increasing demand for polymer processing capacity driven by construction, packaging, and automotive applications, alongside growing adoption of pharmaceutical-grade lubricants in solid dosage manufacturing that provide enhanced tablet production efficiency and quality assurance across diverse PVC processing, polyolefin compounding, rubber manufacturing, and pharmaceutical formulation applications. However, the market faces challenges, including volatility in fatty acid and metal salt raw material prices affecting production economics, increasing regulatory scrutiny of workplace dust exposure requiring product reformulation, and competition from alternative processing aids and synthetic lubricants in specialized applications. Innovation in dust-free formulation technologies and ultra-pure pharmaceutical-grade production continues to influence product development and market expansion patterns.
The growing emphasis on workplace safety and occupational health compliance is driving significant market transformation toward low-dust pastilles, compacted granules, and liquid dispersions that minimize airborne exposure and improve handling safety throughout manufacturing operations. European REACH regulations and strengthening occupational exposure limits are compelling manufacturers to reformulate metallic stearate products into dust-suppressed forms that protect worker health while maintaining technical performance. Leading suppliers are investing heavily in pastillation equipment, pelletizing technologies, and dispersion formulation capabilities to serve this evolving market requirement. The pharmaceutical and cosmetics industries are particularly aggressive in adopting dust-free forms to ensure compliance with stringent workplace exposure standards and Good Manufacturing Practice requirements, creating premium market segments with differentiated pricing and technical service requirements.
Modern metallic stearate manufacturers are establishing specialized production capabilities for ultra-high-purity pharmaceutical-grade magnesium stearate and other metallic stearates meeting stringent USP, EP, and JP pharmacopeial specifications. The expanding global pharmaceutical manufacturing capacity, particularly in generic drug production and contract manufacturing, is driving substantial demand for validated pharmaceutical excipients with comprehensive quality documentation, controlled particle size distributions, and minimal heavy metal contamination. Manufacturers are implementing advanced purification technologies, validated cleaning procedures, and comprehensive quality management systems to serve regulated pharmaceutical markets. These pharmaceutical-grade products command significant price premiums over industrial grades while requiring substantial investments in quality infrastructure, regulatory compliance, and technical documentation capabilities that create competitive barriers favoring established specialty suppliers.
The expansion of electric vehicle polymer components, high-performance engineering resins, and specialty cosmetic formulations is driving innovation in customized metallic stearate grades with tailored particle size distributions, enhanced purity levels, and optimized performance characteristics. Advanced automotive applications require metallic stearates compatible with engineering polymers operating under elevated temperatures and demanding mechanical stress conditions. Electronics applications demand ultra-pure grades with minimal ionic contamination that could compromise component reliability. Cosmetic manufacturers seek micronized grades with specific particle morphologies that optimize sensory properties and application characteristics. These specialty segments are creating opportunities for technical innovation and premium pricing while requiring substantial application development investments and close customer collaboration throughout product commercialization.
| Country | CAGR (2025-2035) |
|---|---|
| China | 6.0% |
| India | 5.8% |
| Brazil | 4.6% |
| United States | 4.5% |
| Germany | 4.2% |
| Japan | 4.0% |
| South Korea | 3.8% |
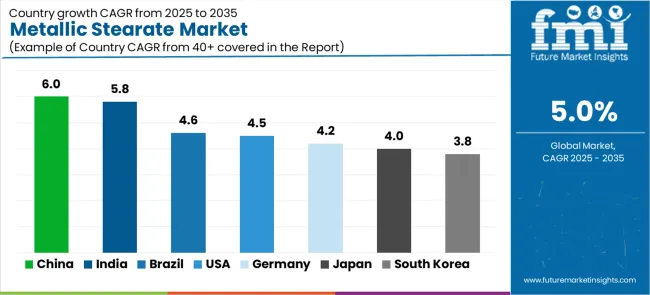
The metallic stearate market is experiencing solid growth globally, with China leading at a 6.0% CAGR through 2035, driven by scale-up in PVC and engineering plastics production, expanding rubber goods exports, and accelerating movement to dust-free grades for environmental health and safety compliance. India follows at 5.8%, supported by rapid growth in pharmaceutical solid-dose manufacturing, polyolefin capacity additions, and cosmetics private-label expansion. Brazil shows growth at 4.6%, emphasizing automotive and packaging recovery, construction chemicals uptake, and local compounding growth. The United States demonstrates 4.5% growth, supported by specialty and high-purity demand in pharmaceutical and aerospace polymer applications and shift toward low-dust pastilles. Germany records 4.2%, focusing on engineering plastics and coatings, pharmaceutical excipient quality standards, and automotive lightweighting compounds. Japan exhibits 4.0% growth, emphasizing electric vehicle and high-performance plastics, electronics-grade purity needs, and mature but innovation-led rubber applications. South Korea shows 3.8% growth, supported by advanced polymers and displays, cosmetics exports, and strong environmental health and safety requirements driving premium grades.
The report covers an in-depth analysis of 40+ countries top-performing countries are highlighted below.
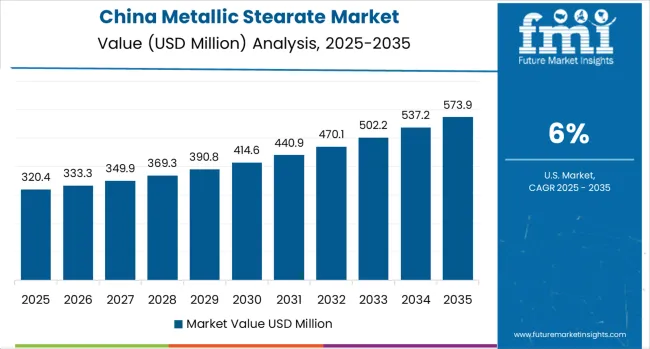
Revenue from metallic stearates in China is projected to exhibit exceptional growth with a CAGR of 6.0% through 2035, driven by massive scale-up in PVC processing and engineering plastics capacity and expanding rubber goods exports supported by government industrial development initiatives and manufacturing excellence programs. The country's enormous polymer processing infrastructure and increasing workplace safety standards are creating substantial demand for both traditional and dust-free metallic stearate solutions. Major chemical manufacturers and polymer processors are establishing comprehensive metallic stearate sourcing capabilities to serve rapidly growing domestic manufacturing operations and export markets.
Revenue from metallic stearates in India is expanding at a CAGR of 5.8%, supported by the country's explosive growth in pharmaceutical solid-dose manufacturing, expanding polyolefin processing capacity, and rapid development of cosmetics private-label manufacturing driven by domestic consumption growth and export opportunities. India's pharmaceutical industry expansion and polymer processing development are driving sophisticated metallic stearate capabilities throughout industrial sectors. Leading pharmaceutical companies and polymer manufacturers are establishing extensive quality-assured sourcing programs to address growing demand.
Revenue from metallic stearates in Brazil is growing at a CAGR of 4.6%, driven by automotive sector recovery, expanding packaging industry, growing construction chemicals uptake, and developing local polymer compounding capabilities. The country's industrial sector recovery and construction activity growth are supporting demand for metallic stearates across manufacturing applications. Chemical distributors and polymer processors are establishing comprehensive capabilities to serve domestic markets and regional opportunities.
Revenue from metallic stearates in the United States is expanding at a CAGR of 4.5%, supported by the country's focus on specialty and high-purity products for pharmaceutical and aerospace polymer applications, comprehensive shift toward low-dust pastille forms, and stable demand from automotive and packaging sectors. The nation's pharmaceutical excellence and advanced polymer processing capabilities are driving demand for premium metallic stearate solutions. Pharmaceutical manufacturers and specialty compounders are investing in quality-assured supply chains serving regulated applications.
Revenue from metallic stearates in Germany is expanding at a CAGR of 4.2%, driven by the country's leadership in engineering plastics and specialty coatings, stringent pharmaceutical excipient quality standards, and automotive lightweighting compound development. Germany's polymer processing excellence and pharmaceutical quality leadership are driving sophisticated metallic stearate capabilities throughout industrial sectors. Leading chemical manufacturers and automotive suppliers are establishing comprehensive quality programs for specialty processing aids.
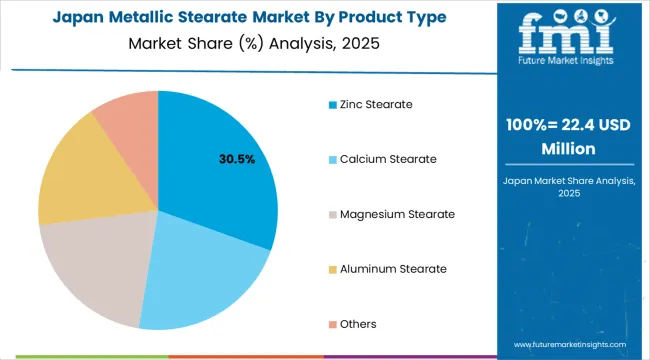
Revenue from metallic stearates in Japan is expanding at a CAGR of 4.0%, supported by the country's emphasis on electric vehicle polymer components, high-performance plastics for electronics applications, electronics-grade purity requirements, and innovation-driven rubber applications despite mature market conditions. Japan's technological sophistication and quality standards are driving demand for ultra-pure metallic stearate products. Leading electronics manufacturers and automotive suppliers are investing in specialized sourcing capabilities.
Revenue from metallic stearates in South Korea is growing at a CAGR of 3.8%, driven by the country's advanced polymer processing for display applications, expanding cosmetics exports requiring premium ingredients, and strong environmental health and safety requirements driving adoption of premium dust-free grades. Korea's technology leadership and cosmetics industry strength are supporting investment in specialized metallic stearate solutions. Electronics manufacturers and cosmetics companies are establishing quality-focused sourcing programs.
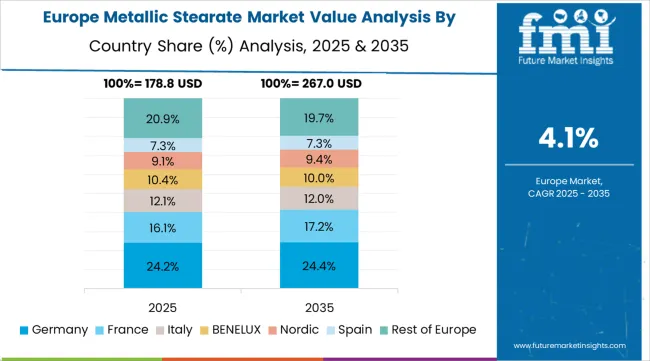
The metallic stearate market in Europe is projected to grow from USD 196.0 million in 2025 to USD 296.2 million by 2035, registering a CAGR of 4.2% over the forecast period. Germany leads with a 20.0% market share in 2025, maintaining its position at 20.0% by 2035, supported by engineering plastics processing, pharmaceutical excipient quality standards, and automotive compound development.
Italy follows with 15.5% in 2025, moderating to 15.2% by 2035, driven by PVC processing, specialty rubber applications, and cosmetics manufacturing. France holds 14.0% in 2025, easing to 13.8% by 2035 with polymer processing and pharmaceutical applications. The United Kingdom accounts for 13.0% in 2025, maintaining 13.1% by 2035 with pharmaceutical manufacturing and specialty compounding. Spain holds 9.0% in 2025, rising to 9.1% by 2035 on construction chemicals and polymer processing growth. Poland maintains 6.0% in 2025, increasing to 6.2% by 2035 due to expanding polymer processing capacity and automotive supplier development. Benelux region holds 7.0% in 2025, moderating to 6.9% by 2035 with specialty chemicals and pharmaceutical applications. Nordics maintain 5.5% in 2025, easing to 5.3% by 2035 with specialty polymer and pharmaceutical applications. The Rest of Europe region, including Austria, Switzerland, and Central &Eastern Europe excluding Poland, holds 10.0% in 2025 and 10.3% by 2035, reflecting industrial development and polymer processing expansion.
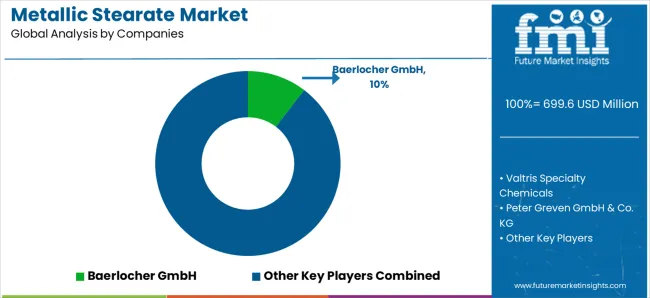
The metallic stearate market is characterized by competition among established specialty chemical manufacturers, integrated polymer additive suppliers, and regional metallic stearate producers. Companies are investing in dust-free formulation technology development, pharmaceutical-grade production capabilities, micronization equipment, and comprehensive technical support services to deliver high-purity, safe-handling, and performance-optimized metallic stearate solutions. Innovation in pastillation technologies, ultra-pure production methods, and specialized grade development is central to strengthening market position and competitive advantage.
Baerlocher GmbH leads the market with a 10.5% share, offering comprehensive metallic stearate solutions with a focus on PVC stabilizer systems, low-dust pastille formulations, and technical service excellence across diverse polymer processing and specialty applications. The company expanded low-dust pastilles capacity in Asia and EMEA in 2024 to support PVC and polyolefin customers, introducing additional pelletized calcium and zinc stearate systems targeting improved handling and reduced workplace dust. Valtris Specialty Chemicals commissioned a high-purity, dust-free metallic stearate production line in Europe in 2025 for polymer and pharmaceutical applications, aligning with tightened occupational exposure and emissions norms.
Peter Greven GmbH &Co. KG completed capacity and debottlenecking upgrades for zinc and calcium stearates in Germany and the Netherlands in 2024/2025, rolling out micronized pharmaceutical-grade magnesium stearate line extensions. Faci S.p.A. provides specialized metallic stearate products with emphasis on European market service. Dover Chemical Corporation offers comprehensive metallic stearate solutions for diverse industrial applications. PMC Biogenix Inc. specializes in pharmaceutical-grade metallic stearates with stringent quality standards. Sun Ace Kakoh (Pte.) Ltd. focuses on Asian market supply with competitive positioning. Norac Additives emphasizes specialty formulations and technical innovation. James M. Brown Ltd. provides established metallic stearate solutions for industrial markets. Nimbasia Stabilizers LLP offers regional production capabilities serving emerging markets.
Metallic stearates represent a specialized metal soap segment within polymer processing, pharmaceutical manufacturing, and specialty chemical applications, projected to grow from USD 699.6 million in 2025 to USD 1,139.6 million by 2035 at a 5.0% CAGR. These metal salts of stearic acid—primarily zinc, calcium, and magnesium stearates available in powder, pastille, and dispersion forms—serve as critical processing aids, lubricants, and stabilizers in PVC processing, polyolefin compounding, rubber manufacturing, pharmaceutical tablet production, and cosmetic formulations where lubrication, release properties, and flow enhancement are essential. Market expansion is driven by increasing polymer processing capacity, growing pharmaceutical manufacturing, expanding adoption of dust-free product forms for workplace safety, and rising demand for ultra-pure pharmaceutical-grade metallic stearates across diverse industrial and regulated applications.
| Items | Values |
|---|---|
| Quantitative Units (2025) | USD 699.6 million |
| Product Type | Zinc Stearate, Calcium Stearate, Magnesium Stearate, Aluminum Stearate, Others |
| Application | Polymers &Plastics, Rubber, Pharmaceuticals, Personal Care &Cosmetics, Construction, Others |
| Form | Powders, Pastilles/Granules, Dispersions &Liquids |
| Regions Covered | Asia Pacific, Europe, North America, Latin America, Middle East &Africa |
| Countries Covered | China, India, Brazil, United States, Germany, Japan, South Korea, and 40+ countries |
| Key Companies Profiled | Baerlocher GmbH, Valtris Specialty Chemicals, Peter Greven GmbH &Co. KG, Faci S.p.A., Dover Chemical Corporation, PMC Biogenix Inc. |
| Additional Attributes | Dollar sales by product type, application, and form category, regional demand trends, competitive landscape, technological advancements in dust-free formulation, pharmaceutical-grade production innovation, and workplace safety optimization |
The global metallic stearate market is estimated to be valued at USD 699.6 million in 2025.
The market size for the metallic stearate market is projected to reach USD 1,139.6 million by 2035.
The metallic stearate market is expected to grow at a 5.0% CAGR between 2025 and 2035.
The key product types in metallic stearate market are zinc stearate, calcium stearate, magnesium stearate, aluminum stearate and others.
In terms of application, polymers & plastics segment to command 30.0% share in the metallic stearate market in 2025.


Our Research Products

The "Full Research Suite" delivers actionable market intel, deep dives on markets or technologies, so clients act faster, cut risk, and unlock growth.

The Leaderboard benchmarks and ranks top vendors, classifying them as Established Leaders, Leading Challengers, or Disruptors & Challengers.

Locates where complements amplify value and substitutes erode it, forecasting net impact by horizon

We deliver granular, decision-grade intel: market sizing, 5-year forecasts, pricing, adoption, usage, revenue, and operational KPIs—plus competitor tracking, regulation, and value chains—across 60 countries broadly.

Spot the shifts before they hit your P&L. We track inflection points, adoption curves, pricing moves, and ecosystem plays to show where demand is heading, why it is changing, and what to do next across high-growth markets and disruptive tech

Real-time reads of user behavior. We track shifting priorities, perceptions of today’s and next-gen services, and provider experience, then pace how fast tech moves from trial to adoption, blending buyer, consumer, and channel inputs with social signals (#WhySwitch, #UX).

Partner with our analyst team to build a custom report designed around your business priorities. From analysing market trends to assessing competitors or crafting bespoke datasets, we tailor insights to your needs.
Supplier Intelligence
Discovery & Profiling
Capacity & Footprint
Performance & Risk
Compliance & Governance
Commercial Readiness
Who Supplies Whom
Scorecards & Shortlists
Playbooks & Docs
Category Intelligence
Definition & Scope
Demand & Use Cases
Cost Drivers
Market Structure
Supply Chain Map
Trade & Policy
Operating Norms
Deliverables
Buyer Intelligence
Account Basics
Spend & Scope
Procurement Model
Vendor Requirements
Terms & Policies
Entry Strategy
Pain Points & Triggers
Outputs
Pricing Analysis
Benchmarks
Trends
Should-Cost
Indexation
Landed Cost
Commercial Terms
Deliverables
Brand Analysis
Positioning & Value Prop
Share & Presence
Customer Evidence
Go-to-Market
Digital & Reputation
Compliance & Trust
KPIs & Gaps
Outputs
Full Research Suite comprises of:
Market outlook & trends analysis
Interviews & case studies
Strategic recommendations
Vendor profiles & capabilities analysis
5-year forecasts
8 regions and 60+ country-level data splits
Market segment data splits
12 months of continuous data updates
DELIVERED AS:
PDF EXCEL ONLINE
Metallic Labels Market Size and Share Forecast Outlook 2025 to 2035
Metallic Pigments Market Size and Share Forecast Outlook 2025 to 2035
Metallic Glasses Market Size and Share Forecast Outlook 2025 to 2035
Metallic Rope Cords Market
Metallic Static Shielding Bags Market
Metallic Hot Stamping Foils Market
Bimetallic Thermometer Market
Nonmetallic Mineral Product Market Size and Share Forecast Outlook 2025 to 2035
Organometallics Market Size and Share Forecast Outlook 2025 to 2035
Flexible Metallic Conduit Market Size and Share Forecast Outlook 2025 to 2035
Flexible Metallic Tubing Market Size and Share Forecast Outlook 2025 to 2035
Liquid-Tight Flexible Non-Metallic Conduit Market Size and Share Forecast Outlook 2025 to 2035
Commercial Liquid-Tight Flexible Non-Metallic Conduit Market Size and Share Forecast Outlook 2025 to 2035
Lead Stearate Market
Butyl Stearate Market Size and Share Forecast Outlook 2025 to 2035
Magnesium Stearate Market Size and Share Forecast Outlook 2025 to 2035
Glycol Monostearate Market Insights – Growth & Industrial Applications 2025 to 2035
Sorbitan Tristearate Market Size and Share Forecast Outlook 2025 to 2035
Glycerol Monostearate Market
Cholesteryl Isostearate Market Size and Share Forecast Outlook 2025 to 2035

Thank you!
You will receive an email from our Business Development Manager. Please be sure to check your SPAM/JUNK folder too.
Chat With
MaRIA