Reports

- Global Locations -

Headquarters

Future Market Insights, Inc.

Christiana Corporate, 200
Continental Drive, Suite 401,
Newark, Delaware - 19713,
United States

T: +1-845-579-5705

Americas

Future Market Insights, Inc.

616 Corporate Way, Suite 2-9018,
Valley Cottage, NY 10989, United States

T: +1-347-918-3531

MEA

Future Market Insights

1602-6 Jumeirah Bay X2 Tower, Plot No: JLT-PH2-X2A,
Jumeirah Lakes Towers, Dubai,
United Arab Emirates

Europe

Future Market Insights

3rd Floor, 207 Regent Street,
W1B 3HH London
United Kingdom

T: + 44 (0) 20 8123 9659
D: +44 (0) 20 3287 4268

Asia Pacific

Future Market Insights

IndiaLand Global Tech Park, Unit UG-1, Behind Grand HighStreet, Phase 1, Hinjawadi, MH, Pune – 411057, India

Sorbitan Tristearate Market Outlook (2022-2032)

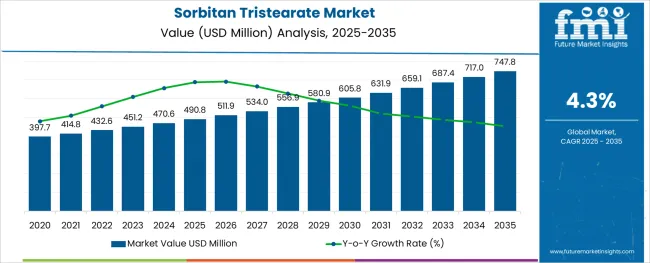
[300 Pages Report] The sorbitan tristearate market is expected to reach an anticipated value of US$ 657.7 Million by 2032, while it is likely to expand its roots in the global market at a lower CAGR of 4.3% (2022 to 2032). The demand for sorbitan tristearate is likely to be valued at US$ 432.6 Million by the end of 2022.

The sorbitan tristearate market report states that the need for a huge end-user base in the market is gaining traction for the market. Almost every industry holds some application of sorbitan tristearate. From adding value to the food items to the production of different medical drugs that help end-user patients, the market’s steady growth is attributed to its end users.

The pharmaceutical industry is one of the major end-users industry for the sorbitan tristearate market. That’s why the market has accelerated since the time of covid-19 with the growing demand for various drugs.

Report Attribute Details
Sorbitan Tristearate Market Value (2022) US$ 432.6 Million
Sorbitan Tristearate Market Anticipated Value (2032) US$ 657.7 Million
Sorbitan Tristearate Market Projected Growth Rate (2022 to 2032) 4.3%

Sorbitan, which comes out when sorbitol is dehydrated and acts as an emulsifying agent for different chemical reactions, is used as an ingredient in food and cosmetic products. Sorbitan is a generic name for anhydrides that are derived from sorbitol, a crystalline hex hydric alcohol that occurs naturally from seaweed, algae and fruits. Sorbitan is made by the esterification of sorbitol and commercial stearic acid that is derived from food fats and oil.

Sorbitan, tristearate market outlook, explains the diversified nature of the market as it holds the revenue in each small industry. Be it food or skincare, the market’s supply chain and distribution channels have been spread in all directions. Furthermore, the market’s growth gets hampered only through its alternatives that perform better for some limited end-user industries. Expanding sorbitan tristearate market size is owned by its food additive nature and is added to food items like dietary food supplements, sugar confectionary, chocolate, beverages and cream.

Don't pay for what you don't need

Customize your report by selecting specific countries or regions and save 30%!

Sorbitan Tristearate

Increasing demand for sorbitan tristearate in the food and beverages industry due to increasing demand for emulsifiers is driving the growth of global sorbitan tristearate market. Demand for sorbitan tristearate is increasing in personal care industry as it works as an emulsifier and stabilizer in cosmetic products.

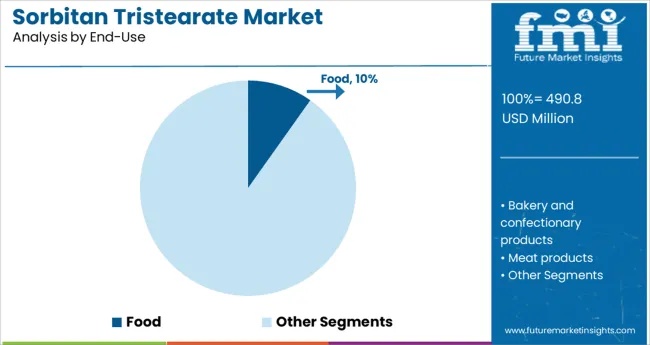
Furthermore, the increasing applications of sorbitan tristearate in various end user industries due to extensive research and developments by companies is further fueling the growth of global sorbitan tristearate market. The sorbitan tristearate market survey explains that the wide applications of sorbitan tristearate in bakery and confectionary are dominating the global sorbitan tristearate market with more than half of the market share in terms of volume as well as value.

In some of the cosmetics product uses of sorbitan tristearate has approved with some concentration limits, which is a limiting factor in the growth of the global sorbitan tristearate market.

Regional Analysis

What is the North America Growth Outlook for the Sorbitan Tristearate Market?

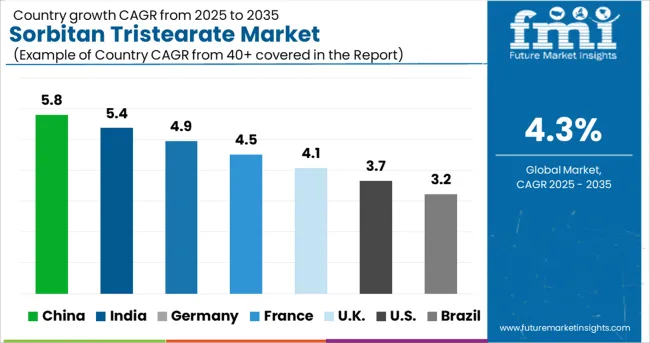
Emerging trends in the sorbitan tristearate market explain that the North American market holds the biggest share in the sorbitan tristearate market with 27.8% of the global market share by the end of 2022.

The growth prospects are attributed to factors such as the increasing FMCG industry along with the rising cosmetics and skin/hair care industry. The application of sorbitan tristearate in the distillation and process of drug manufacturing is flourishing the market and thrives the demand for Sorbitan tristearate in the region.
How is the Europe Sorbitan Tristearate Market Shaping Up?

With a global market share of 24.5% in 2022, the European Sorbitan tristearate market grows at an impressive CAGR for the sorbitan tristearate market. Increasing penetration of bakery and confectionary products in Western Europe and other regions is expected to grow the global sorbitan tristearate market during the forecast period. Asia Pacific and Latin America are among the emerging clusters of the globe, which are anticipated to witness an above average CAGR over the forecast period.

Expanding European Sorbitan Tristearate Market

  • The growing cosmetic industry in Eastern Europe that accounts for the biggest share of the whole European cosmetic market that consumes a significant share of sorbitan tristearate products.
  • Higher consumption of sorbitan tristearate in Europe is also attributed to the use of these products: washing & cleaning products, plant protection products, lubricants and greases, adhesives and sealants, polishes and waxes, fertilizers, and coating products.
Nandini Roy Choudhury

Principal Consultant

Talk to Analyst

Find your sweet spots for generating winning opportunities in this market.

How are Start-ups Pacing Up in the Sorbitan Tristearate Market?

Future market insights report finds that the higher number of pharmaceuticals, FMCG’s research & testing labs, and new consumable items are pushing young market players to invest capital into the market space.

The young companies entering the start-up scene are making faster developments and launching exciting kits that help the end user understand how sorbitan tristearate works for different industries in its different forms. Loans and subsidies through progressive government policies are slowly fuelling the start-up dynamics of the sorbitan tristearate market, ultimately thriving the sales of sorbitan tristearate. The start-up structure of this market is anticipated to grow steady after 2027.

How Key Players are Contributing to the Sorbitan Tristearate Market?

Key competitors focus on making the components concentrated, effective and in accurate proportion for the specific industries like pharmaceuticals and cosmetic care, making sure the limited doctor. As the market rises and thrives on its growth prospects, the competition amongst the major players keeps on rising, structuring a competitive market space.

Recent Mergers and Product Launches
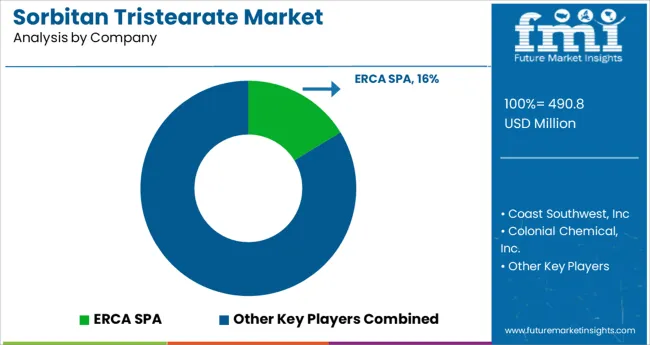
  • Colonial Chemical has revised its latest chemical agent involving catalyst and emulsifying agents. The company claims the efficency and accurate concentration, ensuring the right reaction time.
  • Colonial Chemical, Inc. is a winner in the 2021 EPA Green Chemistry Challenge Awards Program in the focus area of The Design of Greener Chemicals. Colonial Chemical is recognized for developing Suga®Boost surfactant blends, gaining respect in the market and fueling the sales of sorbitan tristearate in new regions.

Get the data you need at a Fraction of the cost

Personalize your report by choosing insights you need
and save 40%!

Key Players

  • ERCA SPA
  • Coast Southwest, Inc.
  • Colonial Chemical, Inc.
  • Kawaken Fine Chemicals Co., Ltd.
  • Burlington Chemical Company
  • Flowers Song Fine Chemical Co., Ltd
  • Fitz Chem Corporation
  • Kao Chemicals
  • ERCA Group
  • Dow chemical company
  • Estelle chemicals pvt., ltd.
  • Guangzhou Ruhana Food Additive Co., Ltd.
  • Hangzhou Funchan Food Additive Co., Ltd.
  • Triveni chemicals
  • Jeevika Yugchem Private Limited
  • Croda India company pvt. Ltd.
  • Kawaken Fine Chemicals Co., Ltd.
  • Coast Southwest, Inc.

Report Scope

Report Attribute Details
Growth Rate CAGR of 5.2% from 2022 to 2032
Base Year for Estimation 2022
Historical Data 2016 to 2021
Forecast Period 2022 to 2032
Quantitative Units Revenue in US$ Million and CAGR from 2022 to 2032
Report Coverage Revenue Forecast, Volume Forecast, Company Ranking, Competitive Landscape, Growth Factors, Trends and Pricing Analysis
Segments Covered
  • End User
  • Region
Regions Covered
  • North America
  • Latin America
  • Western Europe
  • Eastern Europe
  • The Asia Pacific excluding Japan
  • Japan
  • The Middle East and Africa
Key Countries Profiled
  • The USA
  • Canada
  • Brazil
  • Argentina
  • Germany
  • The UK
  • France
  • Spain
  • Italy
  • Nordics
  • BENELUX
  • Australia & New Zealand
  • China
  • India
  • GCC
  • South Africa
Key Companies Profiled
  • ERCA SPA
  • Coast Southwest, Inc.
  • Colonial Chemical, Inc.
  • Kawaken Fine Chemicals Co., Ltd.
  • Burlington Chemical Company
  • Flowers Song Fine Chemical Co., Ltd
  • Fitz Chem Corporation
  • Kao Chemicals
  • ERCA Group
  • Dow chemical company
  • Estelle chemicals pvt., ltd.
  • Guangzhou Ruhana Food Additive Co., Ltd.
  • Hangzhou Funchan Food Additive Co., Ltd.
  • Triveni chemicals
  • Jeevika Yugchem Private Limited
  • Croda India company pvt. Ltd.
  • Kawaken Fine Chemicals Co., Ltd.
  • Coast Southwest, Inc.
Customization Available Upon Request

Key segments

By End User:

  • Food
  • Bakery and confectionary products
  • Meat products
  • Milk and cream analogues
  • Beverage whiteners
  • Emulsified sauces
  • Dietary food supplements
  • Edible ices
  • Personal care industry
  • Skin care products
  • Hair care products
  • Makeup bases and foundations
  • Powders
  • Deodorants
  • Other cosmetics
  • Pharmaceuticals

By Region:

  • North America
  • Latin America
  • Asia Pacific
  • MEA
  • Europe

Frequently Asked Questions

What is the Projected CAGR for the Sorbitan Tristearate Market?

The sorbitan tristearate market is projected to have a lower CAGR of 4.3% through 2032.

Which is the Leading Region in the Sorbitan Tristearate Market?

Europe dominates the sorbitan tristearate market with a share of 27.8% in 2022.

What is the Future Outlook of the Sorbitan Tristearate Market?

The sorbitan tristearate market is expected to reach US$ 657.7 Million by 2032

Table of Content

1. Executive Summary

    1.1. Global Market Outlook

    1.2. Demand-side Trends

    1.3. Supply-side Trends

    1.4. Technology Roadmap Analysis

    1.5. Analysis and Recommendations

2. Market Overview

    2.1. Market Coverage / Taxonomy

    2.2. Market Definition / Scope / Limitations

3. Market Background

    3.1. Market Dynamics

        3.1.1. Drivers

        3.1.2. Restraints

        3.1.3. Opportunity

        3.1.4. Trends

    3.2. Scenario Forecast

        3.2.1. Demand in Optimistic Scenario

        3.2.2. Demand in Likely Scenario

        3.2.3. Demand in Conservative Scenario

    3.3. Opportunity Map Analysis

    3.4. Product Life Cycle Analysis

    3.5. Supply Chain Analysis

        3.5.1. Supply Side Participants and their Roles

            3.5.1.1. Producers

            3.5.1.2. Mid-Level Participants (Traders/ Agents/ Brokers)

            3.5.1.3. Wholesalers and Distributors

        3.5.2. Value Added and Value Created at Node in the Supply Chain

        3.5.3. List of Raw Material Suppliers

        3.5.4. List of Existing and Potential Buyer’s

    3.6. Investment Feasibility Matrix

    3.7. Value Chain Analysis

        3.7.1. Profit Margin Analysis

        3.7.2. Wholesalers and Distributors

        3.7.3. Retailers

    3.8. PESTLE and Porter’s Analysis

    3.9. Regulatory Landscape

        3.9.1. By Key Regions

        3.9.2. By Key Countries

    3.10. Regional Parent Market Outlook

    3.11. Production and Consumption Statistics

    3.12. Import and Export Statistics

4. Global Sorbitan Tristearate Market Analysis 2017-2021 and Forecast, 2022-2032

    4.1. Historical Market Size Value (US$ Bn) & Volume (Tonnes) Analysis, 2017-2021

    4.2. Current and Future Market Size Value (US$ Bn) & Volume (Tonnes) Projections, 2022-2032

        4.2.1. Y-o-Y Growth Trend Analysis

        4.2.2. Absolute $ Opportunity Analysis

5. Global Sorbitan Tristearate Market Analysis 2017-2021 and Forecast 2022-2032, By End-use

    5.1. Introduction / Key Findings

    5.2. Historical Market Size Value (US$ Bn) & Volume (Tonnes) Analysis By End-use, 2017-2021

    5.3. Current and Future Market Size Value (US$ Bn) & Volume (Tonnes) Analysis and Forecast By End-use, 2022-2032

        5.3.1. Food

        5.3.2. Bakery and confectionary products

        5.3.3. Meat products

        5.3.4. Milk and cream analogues

        5.3.5. Beverage whiteners

        5.3.6. Emulsified sauces

        5.3.7. Dietary food supplements

        5.3.8. Edible ices

        5.3.9. Personal care industry

        5.3.10. Skin care products

        5.3.11. Hair care products

        5.3.12. Makeup bases and foundations

        5.3.13. Powders

        5.3.14. Deodorants

        5.3.15. Other cosmetics

        5.3.16. Pharmaceuticals

    5.4. Y-o-Y Growth Trend Analysis By End-use, 2017-2021

    5.5. Absolute $ Opportunity Analysis By End-use, 2022-2032

6. Global Sorbitan Tristearate Market Analysis 2017-2021 and Forecast 2022-2032, By Region

    6.1. Introduction

    6.2. Historical Market Size Value (US$ Bn) & Volume (Tonnes) Analysis By Region, 2017-2021

    6.3. Current Market Size Value (US$ Bn) & Volume (Tonnes) Analysis and Forecast By Region, 2022-2032

        6.3.1. North America

        6.3.2. Latin America

        6.3.3. Europe

        6.3.4. Asia Pacific

        6.3.5. MEA

    6.4. Market Attractiveness Analysis By Region

7. North America Sorbitan Tristearate Market Analysis 2017-2021 and Forecast 2022-2032, By Country

    7.1. Historical Market Size Value (US$ Bn) & Volume (Tonnes) Trend Analysis By Market Taxonomy, 2017-2021

    7.2. Market Size Value (US$ Bn) & Volume (Tonnes) Forecast By Market Taxonomy, 2022-2032

        7.2.1. By Country

            7.2.1.1. U.S.

            7.2.1.2. Canada

        7.2.2. By End-use

    7.3. Market Attractiveness Analysis

        7.3.1. By Country

        7.3.2. By End-use

    7.4. Key Takeaways

8. Latin America Sorbitan Tristearate Market Analysis 2017-2021 and Forecast 2022-2032, By Country

    8.1. Historical Market Size Value (US$ Bn) & Volume (Tonnes) Trend Analysis By Market Taxonomy, 2017-2021

    8.2. Market Size Value (US$ Bn) & Volume (Tonnes) Forecast By Market Taxonomy, 2022-2032

        8.2.1. By Country

            8.2.1.1. Brazil

            8.2.1.2. Mexico

            8.2.1.3. Rest of Latin America

        8.2.2. By End-use

    8.3. Market Attractiveness Analysis

        8.3.1. By Country

        8.3.2. By End-use

    8.4. Key Takeaways

9. Europe Sorbitan Tristearate Market Analysis 2017-2021 and Forecast 2022-2032, By Country

    9.1. Historical Market Size Value (US$ Bn) & Volume (Tonnes) Trend Analysis By Market Taxonomy, 2017-2021

    9.2. Market Size Value (US$ Bn) & Volume (Tonnes) Forecast By Market Taxonomy, 2022-2032

        9.2.1. By Country

            9.2.1.1. Germany

            9.2.1.2. U.K.

            9.2.1.3. France

            9.2.1.4. Spain

            9.2.1.5. Italy

            9.2.1.6. Russia

            9.2.1.7. Rest of Europe

        9.2.2. By End-use

    9.3. Market Attractiveness Analysis

        9.3.1. By Country

        9.3.2. By End-use

    9.4. Key Takeaways

10. Asia Pacific Sorbitan Tristearate Market Analysis 2017-2021 and Forecast 2022-2032, By Country

    10.1. Historical Market Size Value (US$ Bn) & Volume (Tonnes) Trend Analysis By Market Taxonomy, 2017-2021

    10.2. Market Size Value (US$ Bn) & Volume (Tonnes) Forecast By Market Taxonomy, 2022-2032

        10.2.1. By Country

            10.2.1.1. China

            10.2.1.2. Japan

            10.2.1.3. India

            10.2.1.4. South Korea

            10.2.1.5. Australia

            10.2.1.6. Rest of APAC

        10.2.2. By End-use

    10.3. Market Attractiveness Analysis

        10.3.1. By Country

        10.3.2. By End-use

    10.4. Key Takeaways

11. MEA Sorbitan Tristearate Market Analysis 2017-2021 and Forecast 2022-2032, By Country

    11.1. Historical Market Size Value (US$ Bn) & Volume (Tonnes) Trend Analysis By Market Taxonomy, 2017-2021

    11.2. Market Size Value (US$ Bn) & Volume (Tonnes) Forecast By Market Taxonomy, 2022-2032

        11.2.1. By Country

            11.2.1.1. South Africa

            11.2.1.2. Saudi Arabia

            11.2.1.3. UAE

            11.2.1.4. Israel

            11.2.1.5. Rest of MEA

        11.2.2. By End-use

    11.3. Market Attractiveness Analysis

        11.3.1. By Country

        11.3.2. By End-use

    11.4. Key Takeaways

12. Key Countries Sorbitan Tristearate Market Analysis

    12.1. Value (US$ Bn) & Volume (Tonnes)ed States

        12.1.1. Pricing Analysis

        12.1.2. Market Share Analysis, 2021

            12.1.2.1. By End-use

    12.2. Canada

        12.2.1. Pricing Analysis

        12.2.2. Market Share Analysis, 2021

            12.2.2.1. By End-use

    12.3. Brazil

        12.3.1. Pricing Analysis

        12.3.2. Market Share Analysis, 2021

            12.3.2.1. By End-use

    12.4. Mexico

        12.4.1. Pricing Analysis

        12.4.2. Market Share Analysis, 2021

            12.4.2.1. By End-use

    12.5. Germany

        12.5.1. Pricing Analysis

        12.5.2. Market Share Analysis, 2021

            12.5.2.1. By End-use

    12.6. U.K.

        12.6.1. Pricing Analysis

        12.6.2. Market Share Analysis, 2021

            12.6.2.1. By End-use

    12.7. France

        12.7.1. Pricing Analysis

        12.7.2. Market Share Analysis, 2021

            12.7.2.1. By End-use

    12.8. Spain

        12.8.1. Pricing Analysis

        12.8.2. Market Share Analysis, 2021

            12.8.2.1. By End-use

    12.9. Italy

        12.9.1. Pricing Analysis

        12.9.2. Market Share Analysis, 2021

            12.9.2.1. By End-use

    12.10. Russia

        12.10.1. Pricing Analysis

        12.10.2. Market Share Analysis, 2021

            12.10.2.1. By End-use

    12.11. China

        12.11.1. Pricing Analysis

        12.11.2. Market Share Analysis, 2021

            12.11.2.1. By End-use

    12.12. Japan

        12.12.1. Pricing Analysis

        12.12.2. Market Share Analysis, 2021

            12.12.2.1. By End-use

    12.13. India

        12.13.1. Pricing Analysis

        12.13.2. Market Share Analysis, 2021

            12.13.2.1. By End-use

    12.14. South Korea

        12.14.1. Pricing Analysis

        12.14.2. Market Share Analysis, 2021

            12.14.2.1. By End-use

    12.15. Australia

        12.15.1. Pricing Analysis

        12.15.2. Market Share Analysis, 2021

            12.15.2.1. By End-use

    12.16. South Africa

        12.16.1. Pricing Analysis

        12.16.2. Market Share Analysis, 2021

            12.16.2.1. By End-use

    12.17. Saudi Arabia

        12.17.1. Pricing Analysis

        12.17.2. Market Share Analysis, 2021

            12.17.2.1. By End-use

    12.18. UAE

        12.18.1. Pricing Analysis

        12.18.2. Market Share Analysis, 2021

            12.18.2.1. By End-use

    12.19. Israel

        12.19.1. Pricing Analysis

        12.19.2. Market Share Analysis, 2021

            12.19.2.1. By End-use

13. Market Structure Analysis

    13.1. Competition Dashboard

    13.2. Competition Benchmarking

    13.3. Market Share Analysis of Top Players

        13.3.1. By Regional

        13.3.2. By End-use

14. Competition Analysis

    14.1. Competition Deep Dive

        14.1.1. ERCA SPA

            14.1.1.1. Overview

            14.1.1.2. Product Portfolio

            14.1.1.3. Profitability by Market Segments

            14.1.1.4. Sales Footprint

            14.1.1.5. Strategy Overview

                14.1.1.5.1. Marketing Strategy

                14.1.1.5.2. Product Strategy

                14.1.1.5.3. Channel Strategy

        14.1.2. Coast Southwest, Inc

            14.1.2.1. Overview

            14.1.2.2. Product Portfolio

            14.1.2.3. Profitability by Market Segments

            14.1.2.4. Sales Footprint

            14.1.2.5. Strategy Overview

                14.1.2.5.1. Marketing Strategy

                14.1.2.5.2. Product Strategy

                14.1.2.5.3. Channel Strategy

        14.1.3. Colonial Chemical, Inc.

            14.1.3.1. Overview

            14.1.3.2. Product Portfolio

            14.1.3.3. Profitability by Market Segments

            14.1.3.4. Sales Footprint

            14.1.3.5. Strategy Overview

                14.1.3.5.1. Marketing Strategy

                14.1.3.5.2. Product Strategy

                14.1.3.5.3. Channel Strategy

        14.1.4. Kawaken Fine Chemicals Co., Ltd.

            14.1.4.1. Overview

            14.1.4.2. Product Portfolio

            14.1.4.3. Profitability by Market Segments

            14.1.4.4. Sales Footprint

            14.1.4.5. Strategy Overview

                14.1.4.5.1. Marketing Strategy

                14.1.4.5.2. Product Strategy

                14.1.4.5.3. Channel Strategy

        14.1.5. Burlington Chemical Company

            14.1.5.1. Overview

            14.1.5.2. Product Portfolio

            14.1.5.3. Profitability by Market Segments

            14.1.5.4. Sales Footprint

            14.1.5.5. Strategy Overview

                14.1.5.5.1. Marketing Strategy

                14.1.5.5.2. Product Strategy

                14.1.5.5.3. Channel Strategy

        14.1.6. Flowers Song Fine Chemical Co., Ltd

            14.1.6.1. Overview

            14.1.6.2. Product Portfolio

            14.1.6.3. Profitability by Market Segments

            14.1.6.4. Sales Footprint

            14.1.6.5. Strategy Overview

                14.1.6.5.1. Marketing Strategy

                14.1.6.5.2. Product Strategy

                14.1.6.5.3. Channel Strategy

        14.1.7. Fitz Chem Corporation

            14.1.7.1. Overview

            14.1.7.2. Product Portfolio

            14.1.7.3. Profitability by Market Segments

            14.1.7.4. Sales Footprint

            14.1.7.5. Strategy Overview

                14.1.7.5.1. Marketing Strategy

                14.1.7.5.2. Product Strategy

                14.1.7.5.3. Channel Strategy

        14.1.8. Kao Chemicals

            14.1.8.1. Overview

            14.1.8.2. Product Portfolio

            14.1.8.3. Profitability by Market Segments

            14.1.8.4. Sales Footprint

            14.1.8.5. Strategy Overview

                14.1.8.5.1. Marketing Strategy

                14.1.8.5.2. Product Strategy

                14.1.8.5.3. Channel Strategy

        14.1.9. Dow chemical company

            14.1.9.1. Overview

            14.1.9.2. Product Portfolio

            14.1.9.3. Profitability by Market Segments

            14.1.9.4. Sales Footprint

            14.1.9.5. Strategy Overview

                14.1.9.5.1. Marketing Strategy

                14.1.9.5.2. Product Strategy

                14.1.9.5.3. Channel Strategy

        14.1.10. Estelle chemicals pvt., ltd.

            14.1.10.1. Overview

            14.1.10.2. Product Portfolio

            14.1.10.3. Profitability by Market Segments

            14.1.10.4. Sales Footprint

            14.1.10.5. Strategy Overview

                14.1.10.5.1. Marketing Strategy

                14.1.10.5.2. Product Strategy

                14.1.10.5.3. Channel Strategy

        14.1.11. Guangzhou Ruhana Food Additive Co., Ltd.

            14.1.11.1. Overview

            14.1.11.2. Product Portfolio

            14.1.11.3. Profitability by Market Segments

            14.1.11.4. Sales Footprint

            14.1.11.5. Strategy Overview

                14.1.11.5.1. Marketing Strategy

                14.1.11.5.2. Product Strategy

                14.1.11.5.3. Channel Strategy

        14.1.12. Hangzhou Funchan Food Additive Co., Ltd.

            14.1.12.1. Overview

            14.1.12.2. Product Portfolio

            14.1.12.3. Profitability by Market Segments

            14.1.12.4. Sales Footprint

            14.1.12.5. Strategy Overview

                14.1.12.5.1. Marketing Strategy

                14.1.12.5.2. Product Strategy

                14.1.12.5.3. Channel Strategy

        14.1.13. Triveni chemicals

            14.1.13.1. Overview

            14.1.13.2. Product Portfolio

            14.1.13.3. Profitability by Market Segments

            14.1.13.4. Sales Footprint

            14.1.13.5. Strategy Overview

                14.1.13.5.1. Marketing Strategy

                14.1.13.5.2. Product Strategy

                14.1.13.5.3. Channel Strategy

        14.1.14. Jeevika Yugchem Private Limited

            14.1.14.1. Overview

            14.1.14.2. Product Portfolio

            14.1.14.3. Profitability by Market Segments

            14.1.14.4. Sales Footprint

            14.1.14.5. Strategy Overview

                14.1.14.5.1. Marketing Strategy

                14.1.14.5.2. Product Strategy

                14.1.14.5.3. Channel Strategy

        14.1.15. Croda India company pvt. Ltd.

            14.1.15.1. Overview

            14.1.15.2. Product Portfolio

            14.1.15.3. Profitability by Market Segments

            14.1.15.4. Sales Footprint

            14.1.15.5. Strategy Overview

                14.1.15.5.1. Marketing Strategy

                14.1.15.5.2. Product Strategy

                14.1.15.5.3. Channel Strategy

15. Research Methodology

List of Tables

Table 1: Global Sorbitan Tristearate Market Value (US$ Bn) Forecast by Region, 2017-2032

Table 2: Global Sorbitan Tristearate Market Volume (Tonnes) Forecast by Region, 2017-2032

Table 3: Global Sorbitan Tristearate Market Value (US$ Bn) Forecast by End-use, 2017-2032

Table 4: Global Sorbitan Tristearate Market Volume (Tonnes) Forecast by End-use, 2017-2032

Table 5: North America Sorbitan Tristearate Market Value (US$ Bn) Forecast by Country, 2017-2032

Table 6: North America Sorbitan Tristearate Market Volume (Tonnes) Forecast by Country, 2017-2032

Table 7: North America Sorbitan Tristearate Market Value (US$ Bn) Forecast by End-use, 2017-2032

Table 8: North America Sorbitan Tristearate Market Volume (Tonnes) Forecast by End-use, 2017-2032

Table 9: Latin America Sorbitan Tristearate Market Value (US$ Bn) Forecast by Country, 2017-2032

Table 10: Latin America Sorbitan Tristearate Market Volume (Tonnes) Forecast by Country, 2017-2032

Table 11: Latin America Sorbitan Tristearate Market Value (US$ Bn) Forecast by End-use, 2017-2032

Table 12: Latin America Sorbitan Tristearate Market Volume (Tonnes) Forecast by End-use, 2017-2032

Table 13: Europe Sorbitan Tristearate Market Value (US$ Bn) Forecast by Country, 2017-2032

Table 14: Europe Sorbitan Tristearate Market Volume (Tonnes) Forecast by Country, 2017-2032

Table 15: Europe Sorbitan Tristearate Market Value (US$ Bn) Forecast by End-use, 2017-2032

Table 16: Europe Sorbitan Tristearate Market Volume (Tonnes) Forecast by End-use, 2017-2032

Table 17: Asia Pacific Sorbitan Tristearate Market Value (US$ Bn) Forecast by Country, 2017-2032

Table 18: Asia Pacific Sorbitan Tristearate Market Volume (Tonnes) Forecast by Country, 2017-2032

Table 19: Asia Pacific Sorbitan Tristearate Market Value (US$ Bn) Forecast by End-use, 2017-2032

Table 20: Asia Pacific Sorbitan Tristearate Market Volume (Tonnes) Forecast by End-use, 2017-2032

Table 21: MEA Sorbitan Tristearate Market Value (US$ Bn) Forecast by Country, 2017-2032

Table 22: MEA Sorbitan Tristearate Market Volume (Tonnes) Forecast by Country, 2017-2032

Table 23: MEA Sorbitan Tristearate Market Value (US$ Bn) Forecast by End-use, 2017-2032

Table 24: MEA Sorbitan Tristearate Market Volume (Tonnes) Forecast by End-use, 2017-2032

List of Charts

Figure 1: Global Sorbitan Tristearate Market Value (US$ Bn) by End-use, 2022-2032

Figure 2: Global Sorbitan Tristearate Market Value (US$ Bn) by Region, 2022-2032

Figure 3: Global Sorbitan Tristearate Market Value (US$ Bn) Analysis by Region, 2017-2032

Figure 4: Global Sorbitan Tristearate Market Volume (Tonnes) Analysis by Region, 2017-2032

Figure 5: Global Sorbitan Tristearate Market Value Share (%) and BPS Analysis by Region, 2022-2032

Figure 6: Global Sorbitan Tristearate Market Y-o-Y Growth (%) Projections by Region, 2022-2032

Figure 7: Global Sorbitan Tristearate Market Value (US$ Bn) Analysis by End-use, 2017-2032

Figure 8: Global Sorbitan Tristearate Market Volume (Tonnes) Analysis by End-use, 2017-2032

Figure 9: Global Sorbitan Tristearate Market Value Share (%) and BPS Analysis by End-use, 2022-2032

Figure 10: Global Sorbitan Tristearate Market Y-o-Y Growth (%) Projections by End-use, 2022-2032

Figure 11: Global Sorbitan Tristearate Market Attractiveness by End-use, 2022-2032

Figure 12: Global Sorbitan Tristearate Market Attractiveness by Region, 2022-2032

Figure 13: North America Sorbitan Tristearate Market Value (US$ Bn) by End-use, 2022-2032

Figure 14: North America Sorbitan Tristearate Market Value (US$ Bn) by Country, 2022-2032

Figure 15: North America Sorbitan Tristearate Market Value (US$ Bn) Analysis by Country, 2017-2032

Figure 16: North America Sorbitan Tristearate Market Volume (Tonnes) Analysis by Country, 2017-2032

Figure 17: North America Sorbitan Tristearate Market Value Share (%) and BPS Analysis by Country, 2022-2032

Figure 18: North America Sorbitan Tristearate Market Y-o-Y Growth (%) Projections by Country, 2022-2032

Figure 19: North America Sorbitan Tristearate Market Value (US$ Bn) Analysis by End-use, 2017-2032

Figure 20: North America Sorbitan Tristearate Market Volume (Tonnes) Analysis by End-use, 2017-2032

Figure 21: North America Sorbitan Tristearate Market Value Share (%) and BPS Analysis by End-use, 2022-2032

Figure 22: North America Sorbitan Tristearate Market Y-o-Y Growth (%) Projections by End-use, 2022-2032

Figure 23: North America Sorbitan Tristearate Market Attractiveness by End-use, 2022-2032

Figure 24: North America Sorbitan Tristearate Market Attractiveness by Country, 2022-2032

Figure 25: Latin America Sorbitan Tristearate Market Value (US$ Bn) by End-use, 2022-2032

Figure 26: Latin America Sorbitan Tristearate Market Value (US$ Bn) by Country, 2022-2032

Figure 27: Latin America Sorbitan Tristearate Market Value (US$ Bn) Analysis by Country, 2017-2032

Figure 28: Latin America Sorbitan Tristearate Market Volume (Tonnes) Analysis by Country, 2017-2032

Figure 29: Latin America Sorbitan Tristearate Market Value Share (%) and BPS Analysis by Country, 2022-2032

Figure 30: Latin America Sorbitan Tristearate Market Y-o-Y Growth (%) Projections by Country, 2022-2032

Figure 31: Latin America Sorbitan Tristearate Market Value (US$ Bn) Analysis by End-use, 2017-2032

Figure 32: Latin America Sorbitan Tristearate Market Volume (Tonnes) Analysis by End-use, 2017-2032

Figure 33: Latin America Sorbitan Tristearate Market Value Share (%) and BPS Analysis by End-use, 2022-2032

Figure 34: Latin America Sorbitan Tristearate Market Y-o-Y Growth (%) Projections by End-use, 2022-2032

Figure 35: Latin America Sorbitan Tristearate Market Attractiveness by End-use, 2022-2032

Figure 36: Latin America Sorbitan Tristearate Market Attractiveness by Country, 2022-2032

Figure 37: Europe Sorbitan Tristearate Market Value (US$ Bn) by End-use, 2022-2032

Figure 38: Europe Sorbitan Tristearate Market Value (US$ Bn) by Country, 2022-2032

Figure 39: Europe Sorbitan Tristearate Market Value (US$ Bn) Analysis by Country, 2017-2032

Figure 40: Europe Sorbitan Tristearate Market Volume (Tonnes) Analysis by Country, 2017-2032

Figure 41: Europe Sorbitan Tristearate Market Value Share (%) and BPS Analysis by Country, 2022-2032

Figure 42: Europe Sorbitan Tristearate Market Y-o-Y Growth (%) Projections by Country, 2022-2032

Figure 43: Europe Sorbitan Tristearate Market Value (US$ Bn) Analysis by End-use, 2017-2032

Figure 44: Europe Sorbitan Tristearate Market Volume (Tonnes) Analysis by End-use, 2017-2032

Figure 45: Europe Sorbitan Tristearate Market Value Share (%) and BPS Analysis by End-use, 2022-2032

Figure 46: Europe Sorbitan Tristearate Market Y-o-Y Growth (%) Projections by End-use, 2022-2032

Figure 47: Europe Sorbitan Tristearate Market Attractiveness by End-use, 2022-2032

Figure 48: Europe Sorbitan Tristearate Market Attractiveness by Country, 2022-2032

Figure 49: Asia Pacific Sorbitan Tristearate Market Value (US$ Bn) by End-use, 2022-2032

Figure 50: Asia Pacific Sorbitan Tristearate Market Value (US$ Bn) by Country, 2022-2032

Figure 51: Asia Pacific Sorbitan Tristearate Market Value (US$ Bn) Analysis by Country, 2017-2032

Figure 52: Asia Pacific Sorbitan Tristearate Market Volume (Tonnes) Analysis by Country, 2017-2032

Figure 53: Asia Pacific Sorbitan Tristearate Market Value Share (%) and BPS Analysis by Country, 2022-2032

Figure 54: Asia Pacific Sorbitan Tristearate Market Y-o-Y Growth (%) Projections by Country, 2022-2032

Figure 55: Asia Pacific Sorbitan Tristearate Market Value (US$ Bn) Analysis by End-use, 2017-2032

Figure 56: Asia Pacific Sorbitan Tristearate Market Volume (Tonnes) Analysis by End-use, 2017-2032

Figure 57: Asia Pacific Sorbitan Tristearate Market Value Share (%) and BPS Analysis by End-use, 2022-2032

Figure 58: Asia Pacific Sorbitan Tristearate Market Y-o-Y Growth (%) Projections by End-use, 2022-2032

Figure 59: Asia Pacific Sorbitan Tristearate Market Attractiveness by End-use, 2022-2032

Figure 60: Asia Pacific Sorbitan Tristearate Market Attractiveness by Country, 2022-2032

Figure 61: MEA Sorbitan Tristearate Market Value (US$ Bn) by End-use, 2022-2032

Figure 62: MEA Sorbitan Tristearate Market Value (US$ Bn) by Country, 2022-2032

Figure 63: MEA Sorbitan Tristearate Market Value (US$ Bn) Analysis by Country, 2017-2032

Figure 64: MEA Sorbitan Tristearate Market Volume (Tonnes) Analysis by Country, 2017-2032

Figure 65: MEA Sorbitan Tristearate Market Value Share (%) and BPS Analysis by Country, 2022-2032

Figure 66: MEA Sorbitan Tristearate Market Y-o-Y Growth (%) Projections by Country, 2022-2032

Figure 67: MEA Sorbitan Tristearate Market Value (US$ Bn) Analysis by End-use, 2017-2032

Figure 68: MEA Sorbitan Tristearate Market Volume (Tonnes) Analysis by End-use, 2017-2032

Figure 69: MEA Sorbitan Tristearate Market Value Share (%) and BPS Analysis by End-use, 2022-2032

Figure 70: MEA Sorbitan Tristearate Market Y-o-Y Growth (%) Projections by End-use, 2022-2032

Figure 71: MEA Sorbitan Tristearate Market Attractiveness by End-use, 2022-2032

Figure 72: MEA Sorbitan Tristearate Market Attractiveness by Country, 2022-2032

Recommendations

Food and Beverage

Sorbitan Esters Market

Published : March 2023

Food and Beverage

Sorbitan Oleate Market

Published : February 2023

Food and Beverage

Polyoxyethylene Sorbitan Monostearate Market

Published : December 2022

Explore Food and Beverage Insights

View Reports

Sorbitan Tristearate Market