Sorbitan Esters Market Size and Share Forecast Outlook 2025 to 2035

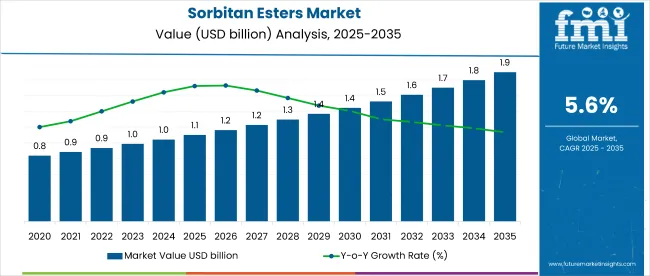
The global sorbitan esters market is projected to grow from USD 1.1 billion in 2025 to USD 1.9 billion by 2035, registering a CAGR of 5.6%. The market expansion is being driven by rising demand for emulsifiers and solubilizers across food, cosmetics, and pharmaceutical industries.
Quick Stats for Sorbitan Esters Market

  • Market Value (2025): USD 1.1 billion
  • Forecast Value (2035): USD 1.9 billion
  • Forecast CAGR: 5.6%
  • Form Leader in 2025: Liquid (47% market share)
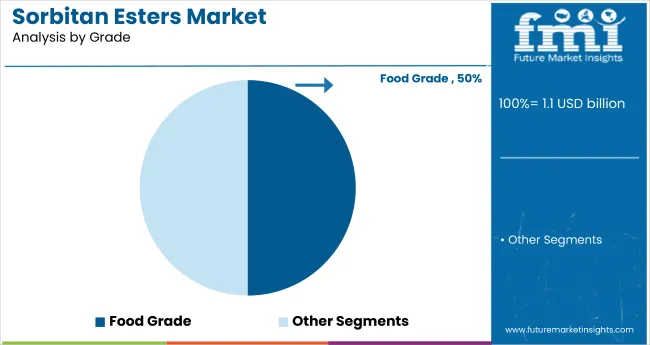
  • Top Grade Segment: Food Grade (over 50% share)
  • Key Growth Region: East Asia (Japan is the fastest-growing market with a 6.6% CAGR)

Sorbitan Esters Market

Metric Value
Industry Size (2025E) USD 1.1 billion
Industry Value (2035F) USD 1.9 billion
CAGR (2025 to 2035) 5.6%

The growing preference for plant-based and bio-derived ingredients is fueling interest in sorbitan esters, particularly in clean-label and organic product formulations. Product innovations, expanding application scope, and increased R&D investments by manufacturers are contributing to the widespread adoption of sorbitan esters in diverse industrial and consumer sectors.

The market holds a niche but impactful share across its parent markets. It accounts for 4.8% of the global emulsifiers market and around 6% within the food emulsifiers segment. In the pharmaceutical excipients market, its share is estimated at 3%, while it contributes nearly 2% to the cosmetic ingredients sector.

Within the functional food ingredients market, sorbitan esters hold a modest 1.5% share, reflecting selective applications. Its contribution to the broader specialty chemicals and surfactants markets is relatively minor, estimated at under 0.5%, due to the vastness of those sectors and wider competition.

Government regulations impacting the market focus on food safety, pharmaceutical quality, and cosmetic formulation standards. Agencies such as the USA Food and Drug Administration (FDA), the European Food Safety Authority (EFSA), and regulatory bodies in India and China have approved various sorbitan esters for use in food and personal care products.

These regulations mandate the use of safe, non-toxic, and biodegradable compounds, encouraging the shift toward naturally sourced sorbitan esters. Growing compliance needs are driving the adoption of high-purity food grade and pharmaceutical grade esters across global markets.

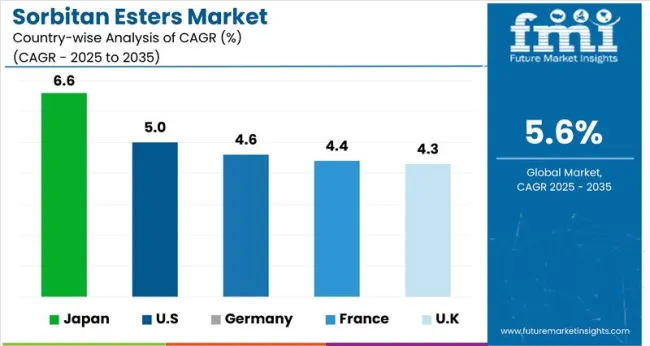
Japan is projected to be the fastest-growing market, expected to expand at a CAGR of 6.6% from 2025 to 2035. Liquid sorbitan esters will lead the form segment with a 47% share, while food grade sorbitan esters will dominate the grade segment with over 50% share. The USA and Germany markets are also expected to grow steadily at CAGRs of 5% and 4.6%, respectively. The UK and France will grow at CAGRs of 4.3% and 4.4%, respectively.

Analyzing Sorbitan Esters Market by Top Investment Segments

The global market is segmented by product type, application, form, grade, and region. By product type, the market includes sorbitantristearate, sorbitanmonostearate, sorbitan monooleate, sorbitantrioleate, sorbitanmonopalmitate, sorbitanmonolaurate, and sorbitansesquioleate.

In terms of application, the market covers cosmetics and personal care products (facial care, body care, and others), food and beverage processing (confectionery, bakery, oil and fats, non-alcoholic beverages, alcoholic beverages, soups, sauces and gravies), pharmaceuticals, lubricants and waxes, animal nutrition and pet food, industrial, and textiles.

By form, the market is categorized into liquid, solid/powder, and semisolid/paste. By grade, the market includes food grade, industrial grade, and pharmaceutical grade. Regionally, the market is segmented into North America, Latin America, Europe, East Asia, South Asia, Oceania, and the Middle East & Africa.
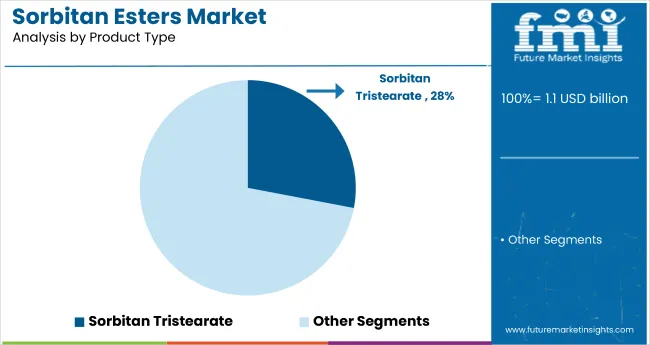
Sorbitan Tristearate to Lead the Product Type Segment with 28% Market Share

Sorbitan Esters Market Analysis By Product Type

Sorbitan tristearate is projected to dominate the product type segment, accounting for 28% of the global market share by 2025. This ester is extensively used as an emulsifier and stabilizer in chocolate, confectionery, and bakery applications. It plays a key role in improving the texture, consistency, and shelf life of food products by enhancing fat dispersion and reducing stickiness.

In chocolate production, it helps control sugar crystallization and improves gloss and melt resistance. Its excellent compatibility with fats and oils also makes it ideal for use in spreads, coatings, and dessert fillings. Demand is driven by the growth of the processed food sector.
  • The ester acts as a surface-active agent that improves texture and stability in processed sweets and baked goods.
  • It reduces stickiness and enhances sugar crystallization, especially in chocolate coatings.

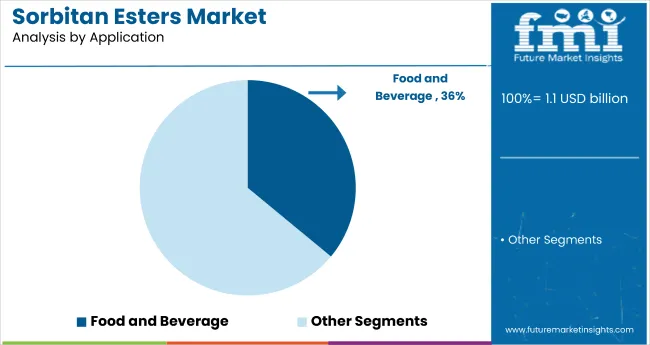
Food and Beverage Processing to Dominate the Application Segment with 36% Market Share in 2025

Sorbitan Esters Market Analysis By Application

The food and beverage processing is anticipated to account for 36% of the global market share in 2025, emerging as the leading application area for sorbitan esters. These esters are widely used as emulsifiers, stabilizers, and dispersing agents in a range of food products, including bakery goods, confectionery, margarine, dairy products, and non-alcoholic beverages.

Their ability to maintain texture, extend shelf life, and enhance the appearance of processed foods makes them essential in large-scale manufacturing. Growing demand for packaged and ready-to-eat products, along with increasing preference for plant-based ingredients, continues to drive usage across the food sector.
  • Sorbitan esters are extensively used in bakery, confectionery, oil and fats, and non-alcoholic beverage formulations.
  • Their emulsifying and stabilizing properties support clean-label trends and help maintain texture in processed foods.

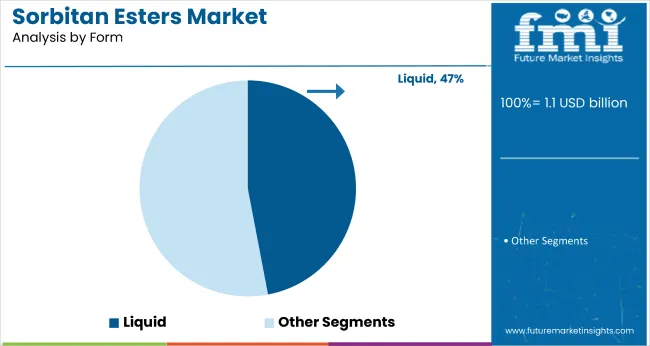
Liquid to Lead the Form Segment with 47% Market Share

Sorbitan Esters Market Analysis By Form

Liquid is projected to dominate the form segment, holding a 47% share of the market by 2025. Its popularity stems from ease of handling, superior solubility, and compatibility with various processing systems. Liquid forms are widely used in food processing, pharmaceuticals, and personal care applications due to their ability to blend uniformly with other ingredients.

They help improve the consistency and stability of emulsions in creams, sauces, and lotions. Manufacturers also prefer liquid esters for their reduced processing time and efficient incorporation into automated production lines. This versatility continues to drive strong demand across multiple industrial sectors.
  • Liquid forms offer ease of blending and processing in food, personal care, and pharmaceutical manufacturing.
  • Their superior solubility and handling properties support broader use across multiple industries.

Food Grade to Lead the Grade Segment with Over 50% Market Share in 2025

Sorbitan Esters Market Analysis By Grade

Food grade is expected to hold over 50% of the market share by 2025, making it the most dominant grade segment. These esters are extensively used as emulsifiers and stabilizers in processed foods such as baked goods, confectionery, margarine, spreads, and non-dairy creamers.

Their approval by regulatory bodies like the FDA and EFSA for use in food products enhances their reliability and widespread adoption. Food manufacturers prefer food grade esters for their safety profile, functional performance, and ability to improve product texture and shelf life. Rising demand for convenient and packaged foods continues to fuel segment growth.

  • Approved by global regulatory bodies, food grade esters are widely used in processed foods, dairy, and bakery.
  • Growing consumer demand for natural emulsifiers and clean-label formulations supports this segment’s growth.

Top Sorbitan Esters Market Dynamics

The global market is experiencing consistent growth, driven by rising demand for emulsifiers and stabilizers in food, pharmaceuticals, and cosmetics. Sorbitan esters improve product texture, stability, and shelf life, making them essential in modern manufacturing. The growing preference for clean-label and plant-derived ingredients further supports market expansion.

Recent Trends in the Sorbitan Esters Market

  • Plant-based and sustainably sourced sorbitan esters are gaining traction as consumer awareness of natural ingredients continues to rise.
  • Increased use of sorbitan esters in topical pharmaceuticals and personal care products is boosting innovation in formulations and delivery systems.

Challenges in the Sorbitan Esters Market
  • The availability of low-cost substitutes like soy lecithin and palm oil derivatives restricts wider adoption, especially in cost-sensitive markets.
  • Potential skin irritation or digestive issues in sensitive consumers limits usage in certain food and cosmetic applications, prompting cautious regulatory oversight.

Top Countries Manufacturing, Regulating, and Driving Demand for Sorbitan Esters

Country Wise Analysis Of Sorbitan Esters Market

Japan’s momentum in the market is anchored in its advanced pharmaceutical and cosmetics sectors, where demand for high-purity emulsifiers and solubilizers continues to rise. Germany and France maintain consistent demand, driven by EU food safety regulations and clean-label ingredient mandates. Developed economies such as the USA (5.0% CAGR), UK (4.3%), and Japan (6.6%) are expected to grow at a steady 0.91 to 1.18 times the global growth rate.

Japan is projected to witness the fastest growth in the market, driven by rising demand in pharmaceuticals, dermatology, and premium personal care products. The USA follows closely, supported by strong innovation in food-grade and pharmaceutical applications.

Germany and France show steady expansion due to widespread usage in bakery, margarine, and clean-label emulsifiers. The UK lags behind the other countries, with slower momentum attributed to cautious investment and post-Brexit regulatory transitions. However, its focus on organic and vegan formulations continues to sustain demand in the cosmetics and food sectors, maintaining a stable presence in the global market.

The report includes in-depth analysis of 40+ countries; five top-performing OECD countries are highlighted below.

In-depth Analysis of Sorbitan Esters Demand in Japan

The Japan sorbitan esters market is projected to grow at a CAGR of 6.6% from 2025 to 2035, outpacing the global average. Growth is supported by Japan’s focus on high-purity solubilizers for human and veterinary medicine.

Rapid innovation in dermatological applications and clean-label pharmaceuticals has increased the use of polysorbate 20 and polysorbate 80. In the cosmetics sector, demand for gentle, non-irritating emulsifiers continues to rise. Japan’s aging population and premium personal care industry further drive demand for functional and safe emulsification systems.
  • High adoption in vaccines, creams, and dermatological drugs.
  • Growth aligned with biotechnology and cosmetics innovation.

Growth Outlook for Sorbitan Esters in Germany

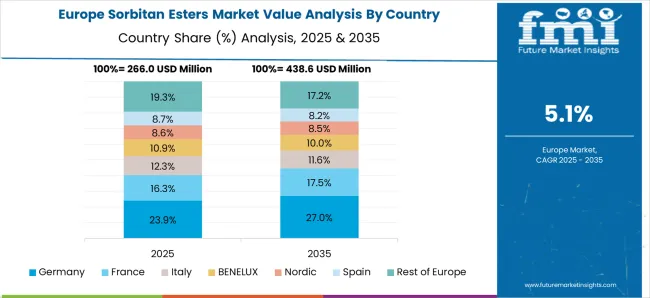
The Germany sorbitan esters revenue is projected to expand at a CAGR of 4.6% through 2035, slightly below the global average. Food-grade esters dominate due to widespread usage in baked goods, margarine, and confectionery.

Germany’s strict food ingredient labeling laws and sustainable sourcing requirements boost demand for clean-label emulsifiers. Additionally, high R&D intensity in pharmaceutical production supports the uptake of pharmaceutical-grade variants. The market is shifting toward sustainable and plant-based alternatives, in line with broader EU goals.

  • EU-led demand for safe, plant-based emulsifiers.
  • Significant usage in bakery, spreads, and margarine applications.

Industrial and Food Applications Drive Growth in France

The French sorbitan esters market is anticipated to grow at a CAGR of 4.4% from 2025 to 2035, mirroring Germany. The market benefits from strong demand in processed foods, cosmetics, and emulsified pharmaceutical formulations. France’s clean ingredient policy encourages the use of sorbitan esters derived from natural fatty acids.

Applications in margarine, sauces, and bakery products are widespread. The cosmetics and luxury personal care sectors also favor multifunctional emulsifiers, further driving demand for sorbitan monooleate and sorbitan tristearate.
  • Strong penetration in sauces, spreads, and skincare.
  • Clean-label and origin-traceable inputs gaining traction.

Demand Trajectory for Sorbitan Esters in the USA

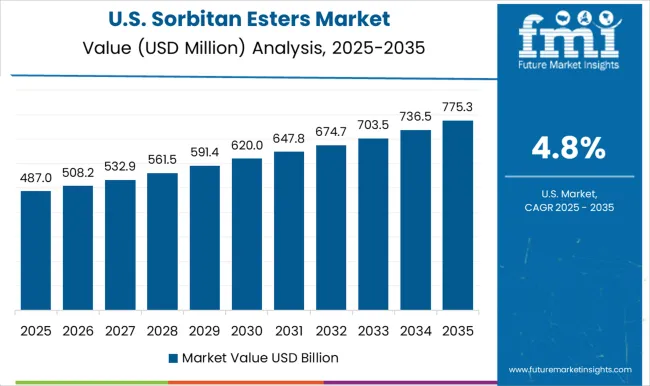
Sales of sorbitan esters in the USA are forecasted to expand at a CAGR of 5% from 2025 to 2035, representing 0.89 times the global average. The USA leads in product innovation, regulatory compliance, and pharmaceutical integration.

FDA approvals for food-grade and pharmaceutical-grade esters strengthen their position in both sectors. Growth is driven by functional food trends, specialty drug formulations, and R&D investment. High demand persists in margarine, frostings, dermal ointments, and parenteral formulations.

  • R&D focus on advanced drug delivery systems.
  • Leading use in baked goods, non-dairy creamers, and topical formulations.

Sorbitan Esters Performance in the UK

The UK sorbitan esters market is expected to grow at a CAGR of 4.3% from 2025 to 2035, reflecting the slowest growth among the top five OECD nations. Demand remains steady across bakery, confectionery, and cosmetic applications.

The UK market is gradually shifting to plant-derived sorbitan esters in response to consumer demand for sustainable and cruelty-free formulations. Regulatory transitions post-Brexit have led to cautious investment in new production facilities, yet adoption continues in the development of organic and clean-label products.
  • Rising use in organic and vegan personal care products.
  • Steady demand in bakery and processed food sectors.

Leading Sorbitan Esters Suppliers and Manufacturers

Sorbitan Esters Market Analysis By Company

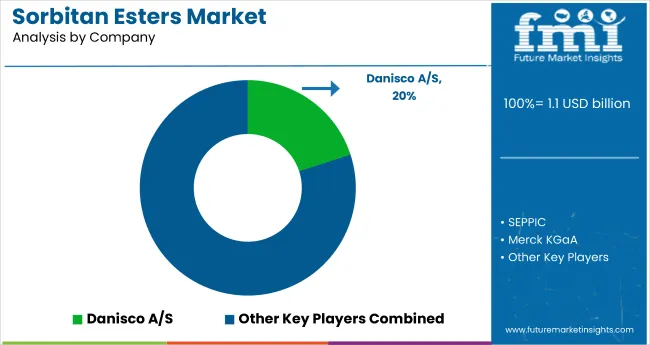
The global market is moderately consolidated, with key players such as LasenorEmul, Merck KGaA, Oleon N.V., Ivanhoe Industries Inc., and Vantage Specialty Chemicals leading the global landscape. These companies focus on high-quality emulsifiers used across food, pharmaceutical, and cosmetic industries.

LasenorEmul is recognized for its food-grade emulsifiers, while Merck KGaA delivers pharmaceutical-grade esters for high-purity applications. Oleon N.V. emphasizes sustainable, plant-based sourcing in its ester product lines. Ivanhoe Industries Inc. and Vantage Specialty Chemicals provide a wide range of tailored solutions for industrial and personal care formulations.

Other notable players include Vantage Leuna GmbH, Union Derivan, Sabo S.p.A., SEPPIC, Ethox Chemicals LLC, Mosselman, Lonza AG, Penta Manufacturing Company, and Danisco A/S, all contributing to product innovation and global supply through extensive R&D, strategic partnerships, and regional expansion.

Recent Sorbitan Esters Industry News

  • In March 2025, Vantage announced the launch of four new natural-based personal care ingredients at in-cosmetics Global in Amsterdam. These innovations, including ANGEL-EYE EFX® and LIPOVOL® ORIGIN CACAY, align with its “Beauty in Balance” wellness-focused formulation concept.

Sorbitan Esters Market Report Scope

Report Attributes Details
Market Size (2025) USD 1.1 billion
Projected Market Size (2035) USD 1.9 billion
CAGR (2025 to 2035) 5.6%
Base Year for Estimation 2024
Historical Period 2020 to 2024
Projections Period 2025 to 2035
Report Parameter USD billion for value/volume in Metric Tons
Product Types Analyzed Sorbitan Tristearate, Sorbitan Monostearate, Sorbitan Monooleate, Sorbitan Trioleate, Sorbitan Monopalmitate, Sorbitan Monolaurate, Sorbitan Sesquioleate
Applications Analyzed Cosmetics and Personal Care (Facial Care, Body Care, Others), Food and Beverage Processing (Confectionery, Bakery, Oil and Fats, Non-alcoholic Beverages, Alcoholic Beverages, Soups, Sauces and Gravies), Pharmaceuticals, Lubricants and Waxes, Animal Nutrition and Pet Food, Industrial, Textiles
Form Analyzed Liquid, Solid/Powder, Semisolid/Paste
Grade Analyzed Food Grade, Industrial Grade, Pharmaceutical Grade
Regions Covered North America, Latin America, Europe, East Asia, South Asia, Oceania, and the Middle East & Africa
Countries Covered United States, United Kingdom, Germany, France, Japan, China, India, Brazil, South Korea, Australia and 40+ countries
Key Players Influencing the Market Lasenor Emul, Merck KGaA, Oleon N.V., Ivanhoe Industries Inc., Vantage Specialty Chemicals, Vantage Leuna GmbH, Union Derivan, Sabo S.p.A., SEPPIC, Ethox Chemicals, LLC, Mosselman, Lonza AG, Penta Manufacturing Company, Danisco A/S.
Additional Attributes Volume and value share by application, grade preference, regional production analysis, raw material sourcing trends, regulatory influence, market entry strategies

Key Segmentation

By Product Type:

  • Sorbitan Tristearate
  • Sorbitan Monostearate
  • Sorbitan Monooleate
  • Sorbitan Trioleate
  • Sorbitan Monopalmitate
  • Sorbitan Monolaurate
  • Sorbitan Sesquioleate

By Application:

  • Cosmetics and Personal Care Products
    • Facial Care
    • Body Care
    • Others
  • Food and Beverage Processing
    • Confectionery
    • Bakery
    • Oil and Fats
    • Non-alcoholic Beverages
    • Alcoholic Beverages
    • Soups, Sauces, and Gravies
  • Pharmaceuticals
  • lubricants and Waxes
  • Animal Nutrition and Pet Food
  • Industrial
  • Textiles

By Form:

  • Liquid
  • Solid/Powder
  • Semisolid/Paste

By Grade:

  • Food Grade
  • Industrial Grade
  • Pharmaceutical Grade

By Region:

  • North America
  • Latin America
  • Europe
  • East Asia
  • South Asia
  • Oceania
  • The Middle East and Africa

Table of Content

  1. Executive Summary
    • Global Market Outlook
    • Demand-side Trends
    • Supply-side Trends
    • Technology Roadmap Analysis
    • Analysis and Recommendations
  2. Market Overview
    • Market Coverage/Taxonomy
    • Market Definition/Scope/Limitations
  3. Market Background
    • Market Dynamics
      • Drivers
      • Restraints
      • Opportunity
      • Trends
    • Scenario Forecast
      • Demand in Optimistic Scenario
      • Demand in Likely Scenario
      • Demand in Conservative Scenario
    • Opportunity Map Analysis
    • Product Life Cycle Analysis
    • Supply Chain Analysis
      • Supply Side Participants and their Roles
        • Producers
        • Mid-Level Participants (Traders/ Agents/ Brokers)
        • Wholesalers and Distributors
      • Value Added and Value Created at Node in the Supply Chain
      • List of Raw Material Suppliers
      • List of Existing and Potential Buyer’s
    • Investment Feasibility Matrix
    • Value Chain Analysis
      • Profit Margin Analysis
      • Wholesalers and Distributors
      • Retailers
    • PESTLE and Porter’s Analysis
    • Regulatory Landscape
      • By Key Regions
      • By Key Countries
    • Regional Parent Market Outlook
    • Production and Consumption Statistics
    • Import and Export Statistics
  4. Global Market Analysis 2020 to 2024 and Forecast, 2025 to 2035
    • Historical Market Size Value (USD Billion) & Volume (Metric Tons) Analysis, 2020 to 2024
    • Current and Future Market Size Value (USD Billion) & Volume (Metric Tons) Projections, 2025 to 2035
      • Y-o-Y Growth Trend Analysis
      • Absolute $ Opportunity Analysis
  5. Global Market Pricing Analysis 2020 to 2024 and Forecast 2025 to 2035
  6. Global Market Analysis 2020 to 2024 and Forecast 2025 to 2035, By Product Type
    • Introduction/Key Findings
    • Historical Market Size Value (USD Billion) & Volume (Metric Tons) Analysis By Product Type, 2020 to 2024
    • Current and Future Market Size Value (USD Billion) & Volume (Metric Tons) Analysis and Forecast By Product Type, 2025 to 2035
      • Sorbitan Tristearate
      • Sorbitan Monostearate
      • Sorbitan Monooleate
      • Sorbitan Trioleate
      • Sorbitan Monopalmitate
      • Sorbitan Monolaurate
      • Sorbitan Sesquioleate
    • Y-o-Y Growth Trend Analysis By Product Type, 2020 to 2024
    • Absolute $ Opportunity Analysis By Product Type, 2025 to 2035
  7. Global Market Analysis 2020 to 2024 and Forecast 2025 to 2035, By Application
    • Introduction/Key Findings
    • Historical Market Size Value (USD Billion) & Volume (Metric Tons) Analysis By Application, 2020 to 2024
    • Current and Future Market Size Value (USD Billion) & Volume (Metric Tons) Analysis and Forecast By Application, 2025 to 2035
      • Cosmetics and Personal Care Products
        • Facial Care
        • Body Care
        • Others
      • Food and Beverage Processing
        • Confectionery
        • Bakery
        • Oil and Fats
        • Non-alcoholic Beverages
        • Alcoholic Beverages
        • Soups, Sauces and Gravies
      • Pharmaceuticals
      • Lubricants and Waxes
      • Animal Nutrition and Pet Food
      • Industrial
      • Textiles
    • Y-o-Y Growth Trend Analysis By Application, 2020 to 2024
    • Absolute $ Opportunity Analysis By Application, 2025 to 2035
  8. Global Market Analysis 2020 to 2024 and Forecast 2025 to 2035, By Form
    • Introduction/Key Findings
    • Historical Market Size Value (USD Billion) & Volume (Metric Tons) Analysis By Form, 2020 to 2024
    • Current and Future Market Size Value (USD Billion) & Volume (Metric Tons) Analysis and Forecast By Form, 2025 to 2035
      • Liquid
      • Solid/Powder
      • Semisolid/Paste
    • Y-o-Y Growth Trend Analysis By Form, 2020 to 2024
    • Absolute $ Opportunity Analysis By Form, 2025 to 2035
  9. Global Market Analysis 2020 to 2024 and Forecast 2025 to 2035, By Grade
    • Introduction/Key Findings
    • Historical Market Size Value (USD Billion) & Volume (Metric Tons) Analysis By Grade, 2020 to 2024
    • Current and Future Market Size Value (USD Billion) & Volume (Metric Tons) Analysis and Forecast By Grade, 2025 to 2035
      • Food Grade
      • Industrial Grade
      • Pharmaceutical Grade
    • Y-o-Y Growth Trend Analysis By Grade, 2020 to 2024
    • Absolute $ Opportunity Analysis By Grade, 2025 to 2035
  10. Global Market Analysis 2020 to 2024 and Forecast 2025 to 2035, By Region
    • Introduction
    • Historical Market Size Value (USD Billion) & Volume (Metric Tons) Analysis By Region, 2020 to 2024
    • Current Market Size Value (USD Billion) & Volume (Metric Tons) Analysis and Forecast By Region, 2025 to 2035
      • North America
      • Latin America
      • Western Europe
      • Eastern Europe
      • East Asia
      • South Asia & Pacific
      • Middle East and Africa
    • Market Attractiveness Analysis By Region
  11. North America Market Analysis 2020 to 2024 and Forecast 2025 to 2035, By Country
    • Historical Market Size Value (USD Billion) & Volume (Metric Tons) Trend Analysis By Market Taxonomy, 2020 to 2024
    • Market Size Value (USD Billion) & Volume (Metric Tons) Forecast By Market Taxonomy, 2025 to 2035
      • By Country
        • USA
        • Canada
        • Mexico
      • By Product Type
      • By Application
      • By Form
      • By Grade
    • Market Attractiveness Analysis
      • By Country
      • By Product Type
      • By Application
      • By Form
      • By Grade
    • Key Takeaways
  12. Latin America Market Analysis 2020 to 2024 and Forecast 2025 to 2035, By Country
    • Historical Market Size Value (USD Billion) & Volume (Metric Tons) Trend Analysis By Market Taxonomy, 2020 to 2024
    • Market Size Value (USD Billion) & Volume (Metric Tons) Forecast By Market Taxonomy, 2025 to 2035
      • By Country
        • Brazil
        • Argentina
        • Rest of LATAM
      • By Product Type
      • By Application
      • By Form
      • By Grade
    • Market Attractiveness Analysis
      • By Country
      • By Product Type
      • By Application
      • By Form
      • By Grade
    • Key Takeaways
  13. Western Europe Market Analysis 2020 to 2024 and Forecast 2025 to 2035, By Country
    • Historical Market Size Value (USD Billion) & Volume (Metric Tons) Trend Analysis By Market Taxonomy, 2020 to 2024
    • Market Size Value (USD Billion) & Volume (Metric Tons) Forecast By Market Taxonomy, 2025 to 2035
      • By Country
        • Germany
        • Italy
        • France
        • UK
        • Spain
        • BENELUX
        • Nordic
        • Rest of W.Europe
      • By Product Type
      • By Application
      • By Form
      • By Grade
    • Market Attractiveness Analysis
      • By Country
      • By Product Type
      • By Application
      • By Form
      • By Grade
    • Key Takeaways
  14. Eastern Europe Market Analysis 2020 to 2024 and Forecast 2025 to 2035, By Country
    • Historical Market Size Value (USD Billion) & Volume (Metric Tons) Trend Analysis By Market Taxonomy, 2020 to 2024
    • Market Size Value (USD Billion) & Volume (Metric Tons) Forecast By Market Taxonomy, 2025 to 2035
      • By Country
        • Russia
        • Hungary
        • Poland
        • Balkan & Baltics
        • Rest of E. Europe
      • By Product Type
      • By Application
      • By Form
      • By Grade
    • Market Attractiveness Analysis
      • By Country
      • By Product Type
      • By Application
      • By Form
      • By Grade
    • Key Takeaways
  15. East Asia Market Analysis 2020 to 2024 and Forecast 2025 to 2035, By Country
    • Historical Market Size Value (USD Billion) & Volume (Metric Tons) Trend Analysis By Market Taxonomy, 2020 to 2024
    • Market Size Value (USD Billion) & Volume (Metric Tons) Forecast By Market Taxonomy, 2025 to 2035
      • By Country
        • China
        • Japan
        • South Korea
      • By Product Type
      • By Application
      • By Form
      • By Grade
    • Market Attractiveness Analysis
      • By Country
      • By Product Type
      • By Application
      • By Form
      • By Grade
    • Key Takeaways
  16. South Asia & Pacific Market Analysis 2020 to 2024 and Forecast 2025 to 2035, By Country
    • Historical Market Size Value (USD Billion) & Volume (Metric Tons) Trend Analysis By Market Taxonomy, 2020 to 2024
    • Market Size Value (USD Billion) & Volume (Metric Tons) Forecast By Market Taxonomy, 2025 to 2035
      • By Country
        • India
        • Australia & New Zealand
        • ASEAN
        • Rest of SAP
      • By Product Type
      • By Application
      • By Form
      • By Grade
    • Market Attractiveness Analysis
      • By Country
      • By Product Type
      • By Application
      • By Form
      • By Grade
    • Key Takeaways
  17. Middle East and Africa Market Analysis 2020 to 2024 and Forecast 2025 to 2035, By Country
    • Historical Market Size Value (USD Billion) & Volume (Metric Tons) Trend Analysis By Market Taxonomy, 2020 to 2024
    • Market Size Value (USD Billion) & Volume (Metric Tons) Forecast By Market Taxonomy, 2025 to 2035
      • By Country
        • GCC Countries
        • Northern Africa
        • South Africa
        • Turkiye
        • Rest of MEA
      • By Product Type
      • By Application
      • By Form
      • By Grade
    • Market Attractiveness Analysis
      • By Country
      • By Product Type
      • By Application
      • By Form
      • By Grade
    • Key Takeaways
  18. Key Countries Market Analysis
    • USA
      • Pricing Analysis
      • Market Share Analysis, 2024
        • By Product Type
        • By Application
        • By Form
        • By Grade
    • Canada
      • Pricing Analysis
      • Market Share Analysis, 2024
        • By Product Type
        • By Application
        • By Form
        • By Grade
    • Brazil
      • Pricing Analysis
      • Market Share Analysis, 2024
        • By Product Type
        • By Application
        • By Form
        • By Grade
    • Mexico
      • Pricing Analysis
      • Market Share Analysis, 2024
        • By Product Type
        • By Application
        • By Form
        • By Grade
    • Argentina
      • Pricing Analysis
      • Market Share Analysis, 2024
        • By Product Type
        • By Application
        • By Form
        • By Grade
  19. Market Structure Analysis
    • Competition Dashboard
    • Competition Benchmarking
    • Market Share Analysis of Top Players
      • By Regional
      • By Product Type
      • By Application
      • By Form
      • By Grade
  20. Competition Analysis
    • Competition Deep Dive
      • Lasenor Emul
        • Overview
        • Product Portfolio
        • Profitability by Market Segments (Product/Age /Sales Channel/Region)
        • Sales Footprint
        • Strategy Overview
          • Marketing Strategy
          • Product Strategy
          • Channel Strategy
      • Merck KGaA
        • Overview
        • Product Portfolio
        • Profitability by Market Segments (Product/Age /Sales Channel/Region)
        • Sales Footprint
        • Strategy Overview
          • Marketing Strategy
          • Product Strategy
          • Channel Strategy
      • Oleon N.V.
        • Overview
        • Product Portfolio
        • Profitability by Market Segments (Product/Age /Sales Channel/Region)
        • Sales Footprint
        • Strategy Overview
          • Marketing Strategy
          • Product Strategy
          • Channel Strategy
      • Ivanhoe Industries Inc.
        • Overview
        • Product Portfolio
        • Profitability by Market Segments (Product/Age /Sales Channel/Region)
        • Sales Footprint
        • Strategy Overview
          • Marketing Strategy
          • Product Strategy
          • Channel Strategy
      • Vantage Specialty Chemicals
        • Overview
        • Product Portfolio
        • Profitability by Market Segments (Product/Age /Sales Channel/Region)
        • Sales Footprint
        • Strategy Overview
          • Marketing Strategy
          • Product Strategy
          • Channel Strategy
      • Vantage Leuna GmbH
        • Overview
        • Product Portfolio
        • Profitability by Market Segments (Product/Age /Sales Channel/Region)
        • Sales Footprint
        • Strategy Overview
          • Marketing Strategy
          • Product Strategy
          • Channel Strategy
      • Union Derivan
        • Overview
        • Product Portfolio
        • Profitability by Market Segments (Product/Age /Sales Channel/Region)
        • Sales Footprint
        • Strategy Overview
          • Marketing Strategy
          • Product Strategy
          • Channel Strategy
      • Sabo S.p.A.
        • Overview
        • Product Portfolio
        • Profitability by Market Segments (Product/Age /Sales Channel/Region)
        • Sales Footprint
        • Strategy Overview
          • Marketing Strategy
          • Product Strategy
          • Channel Strategy
      • SEPPIC
        • Overview
        • Product Portfolio
        • Profitability by Market Segments (Product/Age /Sales Channel/Region)
        • Sales Footprint
        • Strategy Overview
          • Marketing Strategy
          • Product Strategy
          • Channel Strategy
      • Ethox Chemicals, LLC
        • Overview
        • Product Portfolio
        • Profitability by Market Segments (Product/Age /Sales Channel/Region)
        • Sales Footprint
        • Strategy Overview
          • Marketing Strategy
          • Product Strategy
          • Channel Strategy
      • Mosselman
        • Overview
        • Product Portfolio
        • Profitability by Market Segments (Product/Age /Sales Channel/Region)
        • Sales Footprint
        • Strategy Overview
          • Marketing Strategy
          • Product Strategy
          • Channel Strategy
      • Lonza AG
        • Overview
        • Product Portfolio
        • Profitability by Market Segments (Product/Age /Sales Channel/Region)
        • Sales Footprint
        • Strategy Overview
          • Marketing Strategy
          • Product Strategy
          • Channel Strategy
      • Penta Manufacturing Company
        • Overview
        • Product Portfolio
        • Profitability by Market Segments (Product/Age /Sales Channel/Region)
        • Sales Footprint
        • Strategy Overview
          • Marketing Strategy
          • Product Strategy
          • Channel Strategy
      • Danisco A/S
        • Overview
        • Product Portfolio
        • Profitability by Market Segments (Product/Age /Sales Channel/Region)
        • Sales Footprint
        • Strategy Overview
          • Marketing Strategy
          • Product Strategy
          • Channel Strategy
  21. Assumptions & Acronyms Used
  22. Research Methodology

List of Tables

  • Table 1: Global Market Value (USD Billion) Forecast by Region, 2020-2035
  • Table 2: Global Market Volume (Metric Tons) Forecast by Region, 2020-2035
  • Table 3: Global Market Value (USD Billion) Forecast by Product Type, 2020-2035
  • Table 4: Global Market Volume (Metric Tons) Forecast by Product Type, 2020-2035
  • Table 5: Global Market Value (USD Billion) Forecast by Application, 2020-2035
  • Table 6: Global Market Volume (Metric Tons) Forecast by Application, 2020-2035
  • Table 7: Global Market Value (USD Billion) Forecast by Form, 2020-2035
  • Table 8: Global Market Volume (Metric Tons) Forecast by Form, 2020-2035
  • Table 9: Global Market Value (USD Billion) Forecast by Grade, 2020-2035
  • Table 10: Global Market Volume (Metric Tons) Forecast by Grade, 2020-2035
  • Table 11: North America Market Value (USD Billion) Forecast by Country, 2020-2035
  • Table 12: North America Market Volume (Metric Tons) Forecast by Country, 2020-2035
  • Table 13: North America Market Value (USD Billion) Forecast by Product Type, 2020-2035
  • Table 14: North America Market Volume (Metric Tons) Forecast by Product Type, 2020-2035
  • Table 15: North America Market Value (USD Billion) Forecast by Application, 2020-2035
  • Table 16: North America Market Volume (Metric Tons) Forecast by Application, 2020-2035
  • Table 17: North America Market Value (USD Billion) Forecast by Form, 2020-2035
  • Table 18: North America Market Volume (Metric Tons) Forecast by Form, 2020-2035
  • Table 19: North America Market Value (USD Billion) Forecast by Grade, 2020-2035
  • Table 20: North America Market Volume (Metric Tons) Forecast by Grade, 2020-2035
  • Table 21: Latin America Market Value (USD Billion) Forecast by Country, 2020-2035
  • Table 22: Latin America Market Volume (Metric Tons) Forecast by Country, 2020-2035
  • Table 23: Latin America Market Value (USD Billion) Forecast by Product Type, 2020-2035
  • Table 24: Latin America Market Volume (Metric Tons) Forecast by Product Type, 2020-2035
  • Table 25: Latin America Market Value (USD Billion) Forecast by Application, 2020-2035
  • Table 26: Latin America Market Volume (Metric Tons) Forecast by Application, 2020-2035
  • Table 27: Latin America Market Value (USD Billion) Forecast by Form, 2020-2035
  • Table 28: Latin America Market Volume (Metric Tons) Forecast by Form, 2020-2035
  • Table 29: Latin America Market Value (USD Billion) Forecast by Grade, 2020-2035
  • Table 30: Latin America Market Volume (Metric Tons) Forecast by Grade, 2020-2035
  • Table 31: Western Europe Market Value (USD Billion) Forecast by Country, 2020-2035
  • Table 32: Western Europe Market Volume (Metric Tons) Forecast by Country, 2020-2035
  • Table 33: Western Europe Market Value (USD Billion) Forecast by Product Type, 2020-2035
  • Table 34: Western Europe Market Volume (Metric Tons) Forecast by Product Type, 2020-2035
  • Table 35: Western Europe Market Value (USD Billion) Forecast by Application, 2020-2035
  • Table 36: Western Europe Market Volume (Metric Tons) Forecast by Application, 2020-2035
  • Table 37: Western Europe Market Value (USD Billion) Forecast by Form, 2020-2035
  • Table 38: Western Europe Market Volume (Metric Tons) Forecast by Form, 2020-2035
  • Table 39: Western Europe Market Value (USD Billion) Forecast by Grade, 2020-2035
  • Table 40: Western Europe Market Volume (Metric Tons) Forecast by Grade, 2020-2035
  • Table 41: Eastern Europe Market Value (USD Billion) Forecast by Country, 2020-2035
  • Table 42: Eastern Europe Market Volume (Metric Tons) Forecast by Country, 2020-2035
  • Table 43: Eastern Europe Market Value (USD Billion) Forecast by Product Type, 2020-2035
  • Table 44: Eastern Europe Market Volume (Metric Tons) Forecast by Product Type, 2020-2035
  • Table 45: Eastern Europe Market Value (USD Billion) Forecast by Application, 2020-2035
  • Table 46: Eastern Europe Market Volume (Metric Tons) Forecast by Application, 2020-2035
  • Table 47: Eastern Europe Market Value (USD Billion) Forecast by Form, 2020-2035
  • Table 48: Eastern Europe Market Volume (Metric Tons) Forecast by Form, 2020-2035
  • Table 49: Eastern Europe Market Value (USD Billion) Forecast by Grade, 2020-2035
  • Table 50: Eastern Europe Market Volume (Metric Tons) Forecast by Grade, 2020-2035
  • Table 51: East Asia Market Value (USD Billion) Forecast by Country, 2020-2035
  • Table 52: East Asia Market Volume (Metric Tons) Forecast by Country, 2020-2035
  • Table 53: East Asia Market Value (USD Billion) Forecast by Product Type, 2020-2035
  • Table 54: East Asia Market Volume (Metric Tons) Forecast by Product Type, 2020-2035
  • Table 55: East Asia Market Value (USD Billion) Forecast by Application, 2020-2035
  • Table 56: East Asia Market Volume (Metric Tons) Forecast by Application, 2020-2035
  • Table 57: East Asia Market Value (USD Billion) Forecast by Form, 2020-2035
  • Table 58: East Asia Market Volume (Metric Tons) Forecast by Form, 2020-2035
  • Table 59: East Asia Market Value (USD Billion) Forecast by Grade, 2020-2035
  • Table 60: East Asia Market Volume (Metric Tons) Forecast by Grade, 2020-2035
  • Table 61: South Asia & Pacific Market Value (USD Billion) Forecast by Country, 2020-2035
  • Table 62: South Asia & Pacific Market Volume (Metric Tons) Forecast by Country, 2020-2035
  • Table 63: South Asia & Pacific Market Value (USD Billion) Forecast by Product Type, 2020-2035
  • Table 64: South Asia & Pacific Market Volume (Metric Tons) Forecast by Product Type, 2020-2035
  • Table 65: South Asia & Pacific Market Value (USD Billion) Forecast by Application, 2020-2035
  • Table 66: South Asia & Pacific Market Volume (Metric Tons) Forecast by Application, 2020-2035
  • Table 67: South Asia & Pacific Market Value (USD Billion) Forecast by Form, 2020-2035
  • Table 68: South Asia & Pacific Market Volume (Metric Tons) Forecast by Form, 2020-2035
  • Table 69: South Asia & Pacific Market Value (USD Billion) Forecast by Grade, 2020-2035
  • Table 70: South Asia & Pacific Market Volume (Metric Tons) Forecast by Grade, 2020-2035
  • Table 71: Middle East and Africa Market Value (USD Billion) Forecast by Country, 2020-2035
  • Table 72: Middle East and Africa Market Volume (Metric Tons) Forecast by Country, 2020-2035
  • Table 73: Middle East and Africa Market Value (USD Billion) Forecast by Product Type, 2020-2035
  • Table 74: Middle East and Africa Market Volume (Metric Tons) Forecast by Product Type, 2020-2035
  • Table 75: Middle East and Africa Market Value (USD Billion) Forecast by Application, 2020-2035
  • Table 76: Middle East and Africa Market Volume (Metric Tons) Forecast by Application, 2020-2035
  • Table 77: Middle East and Africa Market Value (USD Billion) Forecast by Form, 2020-2035
  • Table 78: Middle East and Africa Market Volume (Metric Tons) Forecast by Form, 2020-2035
  • Table 79: Middle East and Africa Market Value (USD Billion) Forecast by Grade, 2020-2035
  • Table 80: Middle East and Africa Market Volume (Metric Tons) Forecast by Grade, 2020-2035

List of Figures

  • Figure 1: Global Market Volume (Metric Tons) Forecast 2020-2035
  • Figure 2: Global Market Pricing Analysis
  • Figure 3: Global Market Value (USD Billion) Forecast 2020-2035
  • Figure 4: Global Market Value Share and BPS Analysis by Product Type, 2025 and 2035
  • Figure 5: Global Market Y-o-Y Growth Comparison by Product Type, 2025-2035
  • Figure 6: Global Market Attractiveness Analysis by Product Type
  • Figure 7: Global Market Value Share and BPS Analysis by Application, 2025 and 2035
  • Figure 8: Global Market Y-o-Y Growth Comparison by Application, 2025-2035
  • Figure 9: Global Market Attractiveness Analysis by Application
  • Figure 10: Global Market Value Share and BPS Analysis by Form, 2025 and 2035
  • Figure 11: Global Market Y-o-Y Growth Comparison by Form, 2025-2035
  • Figure 12: Global Market Attractiveness Analysis by Form
  • Figure 13: Global Market Value Share and BPS Analysis by Grade, 2025 and 2035
  • Figure 14: Global Market Y-o-Y Growth Comparison by Grade, 2025-2035
  • Figure 15: Global Market Attractiveness Analysis by Grade
  • Figure 16: Global Market Value (USD Billion) Share and BPS Analysis by Region, 2025 and 2035
  • Figure 17: Global Market Y-o-Y Growth Comparison by Region, 2025-2035
  • Figure 18: Global Market Attractiveness Analysis by Region
  • Figure 19: North America Market Incremental $ Opportunity, 2025-2035
  • Figure 20: Latin America Market Incremental $ Opportunity, 2025-2035
  • Figure 21: Western Europe Market Incremental $ Opportunity, 2025-2035
  • Figure 22: Eastern Europe Market Incremental $ Opportunity, 2025-2035
  • Figure 23: East Asia Market Incremental $ Opportunity, 2025-2035
  • Figure 24: South Asia & Pacific Market Incremental $ Opportunity, 2025-2035
  • Figure 25: Middle East and Africa Market Incremental $ Opportunity, 2025-2035
  • Figure 26: North America Market Value Share and BPS Analysis by Country, 2025 and 2035
  • Figure 27: North America Market Value Share and BPS Analysis by Product Type, 2025 and 2035
  • Figure 28: North America Market Y-o-Y Growth Comparison by Product Type, 2025-2035
  • Figure 29: North America Market Attractiveness Analysis by Product Type
  • Figure 30: North America Market Value Share and BPS Analysis by Application, 2025 and 2035
  • Figure 31: North America Market Y-o-Y Growth Comparison by Application, 2025-2035
  • Figure 32: North America Market Attractiveness Analysis by Application
  • Figure 33: North America Market Value Share and BPS Analysis by Form, 2025 and 2035
  • Figure 34: North America Market Y-o-Y Growth Comparison by Form, 2025-2035
  • Figure 35: North America Market Attractiveness Analysis by Form
  • Figure 36: North America Market Value Share and BPS Analysis by Grade, 2025 and 2035
  • Figure 37: North America Market Y-o-Y Growth Comparison by Grade, 2025-2035
  • Figure 38: North America Market Attractiveness Analysis by Grade
  • Figure 39: Latin America Market Value Share and BPS Analysis by Country, 2025 and 2035
  • Figure 40: Latin America Market Value Share and BPS Analysis by Product Type, 2025 and 2035
  • Figure 41: Latin America Market Y-o-Y Growth Comparison by Product Type, 2025-2035
  • Figure 42: Latin America Market Attractiveness Analysis by Product Type
  • Figure 43: Latin America Market Value Share and BPS Analysis by Application, 2025 and 2035
  • Figure 44: Latin America Market Y-o-Y Growth Comparison by Application, 2025-2035
  • Figure 45: Latin America Market Attractiveness Analysis by Application
  • Figure 46: Latin America Market Value Share and BPS Analysis by Form, 2025 and 2035
  • Figure 47: Latin America Market Y-o-Y Growth Comparison by Form, 2025-2035
  • Figure 48: Latin America Market Attractiveness Analysis by Form
  • Figure 49: Latin America Market Value Share and BPS Analysis by Grade, 2025 and 2035
  • Figure 50: Latin America Market Y-o-Y Growth Comparison by Grade, 2025-2035
  • Figure 51: Latin America Market Attractiveness Analysis by Grade
  • Figure 52: Western Europe Market Value Share and BPS Analysis by Country, 2025 and 2035
  • Figure 53: Western Europe Market Value Share and BPS Analysis by Product Type, 2025 and 2035
  • Figure 54: Western Europe Market Y-o-Y Growth Comparison by Product Type, 2025-2035
  • Figure 55: Western Europe Market Attractiveness Analysis by Product Type
  • Figure 56: Western Europe Market Value Share and BPS Analysis by Application, 2025 and 2035
  • Figure 57: Western Europe Market Y-o-Y Growth Comparison by Application, 2025-2035
  • Figure 58: Western Europe Market Attractiveness Analysis by Application
  • Figure 59: Western Europe Market Value Share and BPS Analysis by Form, 2025 and 2035
  • Figure 60: Western Europe Market Y-o-Y Growth Comparison by Form, 2025-2035
  • Figure 61: Western Europe Market Attractiveness Analysis by Form
  • Figure 62: Western Europe Market Value Share and BPS Analysis by Grade, 2025 and 2035
  • Figure 63: Western Europe Market Y-o-Y Growth Comparison by Grade, 2025-2035
  • Figure 64: Western Europe Market Attractiveness Analysis by Grade
  • Figure 65: Eastern Europe Market Value Share and BPS Analysis by Country, 2025 and 2035
  • Figure 66: Eastern Europe Market Value Share and BPS Analysis by Product Type, 2025 and 2035
  • Figure 67: Eastern Europe Market Y-o-Y Growth Comparison by Product Type, 2025-2035
  • Figure 68: Eastern Europe Market Attractiveness Analysis by Product Type
  • Figure 69: Eastern Europe Market Value Share and BPS Analysis by Application, 2025 and 2035
  • Figure 70: Eastern Europe Market Y-o-Y Growth Comparison by Application, 2025-2035
  • Figure 71: Eastern Europe Market Attractiveness Analysis by Application
  • Figure 72: Eastern Europe Market Value Share and BPS Analysis by Form, 2025 and 2035
  • Figure 73: Eastern Europe Market Y-o-Y Growth Comparison by Form, 2025-2035
  • Figure 74: Eastern Europe Market Attractiveness Analysis by Form
  • Figure 75: Eastern Europe Market Value Share and BPS Analysis by Grade, 2025 and 2035
  • Figure 76: Eastern Europe Market Y-o-Y Growth Comparison by Grade, 2025-2035
  • Figure 77: Eastern Europe Market Attractiveness Analysis by Grade
  • Figure 78: East Asia Market Value Share and BPS Analysis by Country, 2025 and 2035
  • Figure 79: East Asia Market Value Share and BPS Analysis by Product Type, 2025 and 2035
  • Figure 80: East Asia Market Y-o-Y Growth Comparison by Product Type, 2025-2035
  • Figure 81: East Asia Market Attractiveness Analysis by Product Type
  • Figure 82: East Asia Market Value Share and BPS Analysis by Application, 2025 and 2035
  • Figure 83: East Asia Market Y-o-Y Growth Comparison by Application, 2025-2035
  • Figure 84: East Asia Market Attractiveness Analysis by Application
  • Figure 85: East Asia Market Value Share and BPS Analysis by Form, 2025 and 2035
  • Figure 86: East Asia Market Y-o-Y Growth Comparison by Form, 2025-2035
  • Figure 87: East Asia Market Attractiveness Analysis by Form
  • Figure 88: East Asia Market Value Share and BPS Analysis by Grade, 2025 and 2035
  • Figure 89: East Asia Market Y-o-Y Growth Comparison by Grade, 2025-2035
  • Figure 90: East Asia Market Attractiveness Analysis by Grade
  • Figure 91: South Asia & Pacific Market Value Share and BPS Analysis by Country, 2025 and 2035
  • Figure 92: South Asia & Pacific Market Value Share and BPS Analysis by Product Type, 2025 and 2035
  • Figure 93: South Asia & Pacific Market Y-o-Y Growth Comparison by Product Type, 2025-2035
  • Figure 94: South Asia & Pacific Market Attractiveness Analysis by Product Type
  • Figure 95: South Asia & Pacific Market Value Share and BPS Analysis by Application, 2025 and 2035
  • Figure 96: South Asia & Pacific Market Y-o-Y Growth Comparison by Application, 2025-2035
  • Figure 97: South Asia & Pacific Market Attractiveness Analysis by Application
  • Figure 98: South Asia & Pacific Market Value Share and BPS Analysis by Form, 2025 and 2035
  • Figure 99: South Asia & Pacific Market Y-o-Y Growth Comparison by Form, 2025-2035
  • Figure 100: South Asia & Pacific Market Attractiveness Analysis by Form
  • Figure 101: South Asia & Pacific Market Value Share and BPS Analysis by Grade, 2025 and 2035
  • Figure 102: South Asia & Pacific Market Y-o-Y Growth Comparison by Grade, 2025-2035
  • Figure 103: South Asia & Pacific Market Attractiveness Analysis by Grade
  • Figure 104: Middle East and Africa Market Value Share and BPS Analysis by Country, 2025 and 2035
  • Figure 105: Middle East and Africa Market Value Share and BPS Analysis by Product Type, 2025 and 2035
  • Figure 106: Middle East and Africa Market Y-o-Y Growth Comparison by Product Type, 2025-2035
  • Figure 107: Middle East and Africa Market Attractiveness Analysis by Product Type
  • Figure 108: Middle East and Africa Market Value Share and BPS Analysis by Application, 2025 and 2035
  • Figure 109: Middle East and Africa Market Y-o-Y Growth Comparison by Application, 2025-2035
  • Figure 110: Middle East and Africa Market Attractiveness Analysis by Application
  • Figure 111: Middle East and Africa Market Value Share and BPS Analysis by Form, 2025 and 2035
  • Figure 112: Middle East and Africa Market Y-o-Y Growth Comparison by Form, 2025-2035
  • Figure 113: Middle East and Africa Market Attractiveness Analysis by Form
  • Figure 114: Middle East and Africa Market Value Share and BPS Analysis by Grade, 2025 and 2035
  • Figure 115: Middle East and Africa Market Y-o-Y Growth Comparison by Grade, 2025-2035
  • Figure 116: Middle East and Africa Market Attractiveness Analysis by Grade
  • Figure 117: Global Market - Tier Structure Analysis
  • Figure 118: Global Market - Company Share Analysis

Frequently Asked Questions

What is the projected size of the sorbitan esters market in 2025?

The market is valued at USD 1.1 billion in 2025.

What is the outlook on sorbitan esters demand by 2035?

The market is forecasted to reach USD 1.9 billion by 2035, reflecting a CAGR of 5.6%.

Which segment leads the sorbitan esters market by form in 2025?

Liquid sorbitan esters will lead the form segment, accounting for 47% of the global market share in 2025.

What is the top grade segment for the sorbitan esters market in 2025?

Food grade sorbitan esters will dominate the grade segment with over 50% share in 2025.

Which country is projected to have the fastest-growing sorbitan esters market?

Japan is projected to grow at the fastest rate, with a CAGR of 6.6% from 2025 to 2035.

Explore Similar Insights

Future Market Insights

Sorbitan Esters Market