Humidity Testers Market Size and Share Forecast Outlook 2025 to 2035

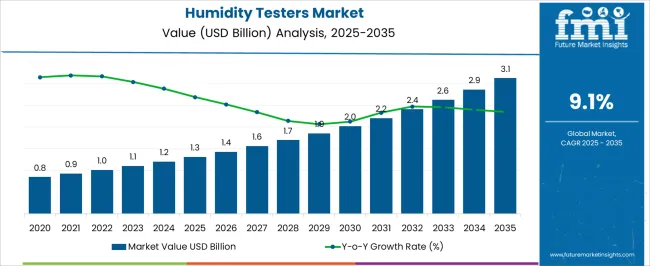
The Humidity Testers Market is estimated to be valued at USD 1.3 billion in 2025 and is projected to reach USD 3.1 billion by 2035, registering a compound annual growth rate (CAGR) of 9.1% over the forecast period.
Quick Stats for Humidity Testers Market

  • Humidity Testers Market Value (2025): USD 1.3 billion
  • Humidity Testers Market Forecast Value (2035): USD 3.1 billion
  • Humidity Testers Market Forecast CAGR: 9.1%
  • Leading Segment in Humidity Testers Market in 2025: Food And Beverages (30.0%)
  • Key Growth Regions in Humidity Testers Market: North America, Asia-Pacific, Europe
  • Top Key Players in Humidity Testers Market: Vaisala, University Products, Spectris, AVTECH Software, Process Sensing Technologies, Caption Data, Ambetronics Engineers, General Tools & Instruments, Testo

Humidity Testers Market Value Analysis

Humidity Testers Market Key Takeaways

Metric Value
Humidity Testers Market Estimated Value in (2025 E) USD 1.3 billion
Humidity Testers Market Forecast Value in (2035 F) USD 3.1 billion
Forecast CAGR (2025 to 2035) 9.1%

Why is the Humidity Testers Market Growing?

The Humidity Testers market is being driven by the rising need for accurate environmental monitoring across diverse industries. The current market environment is shaped by increasing adoption of humidity measurement systems in areas where product quality, safety, and process efficiency are directly impacted by moisture levels. The demand is being supported by stricter regulatory requirements, growing automation in manufacturing processes, and the need for real-time monitoring in sensitive environments.

Technological advancements in sensor design and data connectivity have improved the accuracy and reliability of measurement systems, making them more cost-effective and easier to deploy. The future outlook of the market is expected to remain positive as sectors such as food and beverages, pharmaceuticals, and electronics continue to prioritize quality assurance and compliance.

The integration of humidity monitoring into smart systems is also anticipated to enhance operational efficiency and predictive maintenance Increasing awareness about environmental control and energy optimization is further contributing to the expansion of this market, offering significant growth opportunities for measurement solutions that can adapt to evolving industry requirements.

Segmental Analysis

The humidity testers market is segmented by end use, measurement, and geographic regions. By end use, humidity testers market is divided into Food And Beverages, Hospitals, Pharmaceutical, Automotive, Construction, and Others. In terms of measurement, humidity testers market is classified into Relative Humidity, Absolute Humidity, and Specific Humidity. Regionally, the humidity testers industry is classified into North America, Latin America, Western Europe, Eastern Europe, Balkan & Baltic Countries, Russia & Belarus, Central Asia, East Asia, South Asia & Pacific, and the Middle East & Africa.
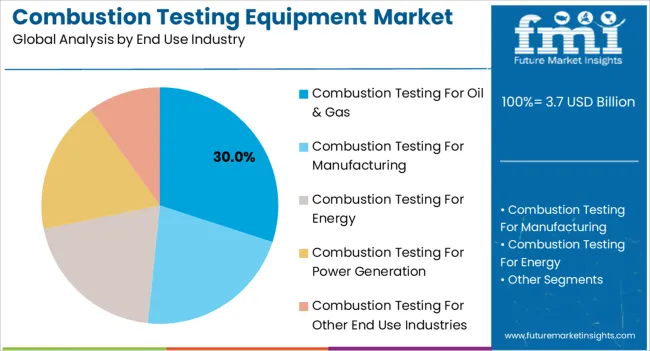
Insights into the Food and Beverages Segment

Combustion Testing Equipment Market Analysis By End Use Industry

The Food and Beverages segment is expected to hold 30.00% of the total Humidity Testers market revenue in 2025, making it the leading end use segment. This prominence is being attributed to the critical role of humidity control in ensuring product quality, shelf life, and safety throughout production, storage, and transportation.

In environments where food processing and packaging are involved, maintaining precise humidity levels has become essential to prevent spoilage, microbial growth, and texture degradation. The segment’s growth is being supported by increasing investments in quality management systems and compliance with food safety standards across global supply chains.

The adoption of humidity testers is being accelerated by the need to monitor conditions in real time, allowing for immediate corrective actions and reducing product losses As consumer expectations for freshness and quality rise, and regulatory bodies enforce stricter standards, the demand for humidity measurement solutions within the food and beverage sector is expected to remain robust, driving further investments in advanced sensor technologies.
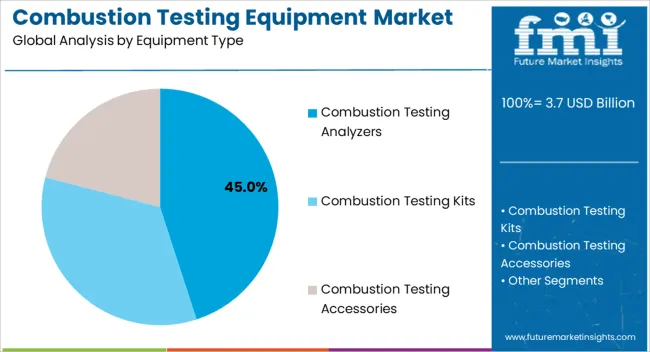
Insights into the Relative Humidity Measurement Segment

Combustion Testing Equipment Market Analysis By Equipment Type

The Relative Humidity measurement segment is projected to account for 45.00% of the Humidity Testers market revenue in 2025, establishing it as the largest measurement category. This dominance is being driven by its wide applicability across industries where the moisture content in the air plays a crucial role in operational stability and product integrity. The measurement of relative humidity is being favored because it provides essential data needed for environmental control in manufacturing, storage, and laboratory settings.

Real-time tracking of relative humidity has enabled proactive adjustments in processes, helping to maintain optimal conditions and prevent losses due to moisture fluctuations. The segment’s growth is further supported by the integration of smart monitoring systems that allow seamless data collection and automated reporting.

In sectors such as food and beverages, pharmaceuticals, and electronics, where environmental consistency is critical, relative humidity measurement is being considered a fundamental requirement With increasing focus on product quality, safety, and energy efficiency, the demand for relative humidity monitoring solutions is expected to remain strong in the coming years.

Market Overview

Humidity Testers Market: Introduction

Growing demand from hospitals and the construction sector is fuelling the growth of the global humidity Testers market. Few of the important applications of humidity Testers are monitoring concrete setting, monitoring of moisture level, management of environment for agriculture and horticulture, controlling environment for data center, food and beverages, broadcast equipment and others.

Humidity Testers are used to measure relative humidity, absolute humidity, specific humidity and others. Humidity Testers witness high adoption in the hospital sector as hospital environment requires specific humidity to maintain the quality of vaccines, drugs, critical medical devices, blood/tissues, etc. Also, humidity is a key parameter for maintaining purity, drug safety and efficacy. Humidity measurement is a challenging and critical parameter for neonatal areas, procedural rooms and others.

Humidity Testers are vital equipments which measure humidity and significantly reduce the chances of occurrence of various health issues. Dry air causes many health related issues, such as sore throat, dry eyes, dry nasal passage, cold and flu, bloody nose, chapped skin and lips, itchy dry skin, which increases the chances of occurrence of asthma, allergies and other complex health problems.

According to the USA Environmental Protection Agency (EPA), the level of indoor humidity must be below 60%. The USA EPA recommends that the ideal humidity level must be between 30% and 50%. Various regional and international regulatory bodies are conducting various health awareness programs, which are responsible for increasing the awareness about healthy living.

All these factors are significantly influencing the global humidity testers market. Several developments in humidity Testers with reference to technology are expected to drive the growth of the global humidity Testers market during the forecast period.
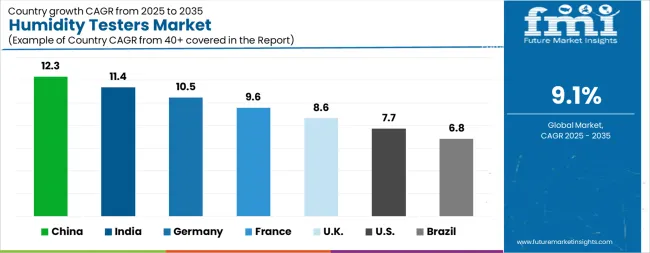
Analysis of Humidity Testers Market By Key Countries

Humidity Testers Market Cagr Analysis By Country

Country CAGR
China 12.3%
India 11.4%
Germany 10.5%
France 9.6%
UK 8.6%
USA 7.7%
Brazil 6.8%

Country-wise Analysis

The Humidity Testers Market is expected to register a CAGR of 9.1% during the forecast period, exhibiting varied country level momentum. China leads with the highest CAGR of 12.3%, followed by India at 11.4%. Developed markets such as Germany, France, and the UK continue to expand steadily, while the USA is likely to grow at consistent rates. Brazil posts the lowest CAGR at 6.8%, yet still underscores a broadly positive trajectory for the global Humidity Testers Market. In 2024, Germany held a dominant revenue in the Western Europe market and is expected to grow with a CAGR of 10.5%. The USA Humidity Testers Market is estimated to be valued at USD 449.3 million in 2025 and is anticipated to reach a valuation of USD 946.5 million by 2035. Sales are projected to rise at a CAGR of 7.7% over the forecast period between 2025 and 2035. While Japan and South Korea markets are estimated to be valued at USD 61.0 million and USD 33.3 million respectively in 2025.
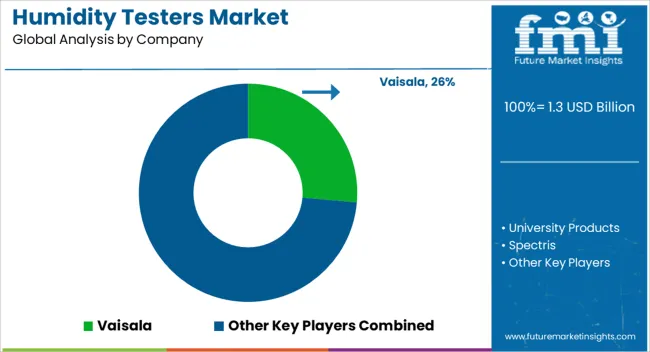
Key Players in the Humidity Testers Market

Humidity Testers Market Analysis By Company

  • Vaisala
  • University Products
  • Spectris
  • AVTECH Software
  • Process Sensing Technologies
  • Caption Data
  • Ambetronics Engineers
  • General Tools & Instruments
  • Testo

Scope of the Report

Item Value
Quantitative Units USD 1.3 Billion
End Use Food And Beverages, Hospitals, Pharmaceutical, Automotive, Construction, and Others
Measurement Relative Humidity, Absolute Humidity, and Specific Humidity
Regions Covered North America, Europe, Asia-Pacific, Latin America, Middle East & Africa
Country Covered United States, Canada, Germany, France, United Kingdom, China, Japan, India, Brazil, South Africa
Key Companies Profiled Vaisala, University Products, Spectris, AVTECH Software, Process Sensing Technologies, Caption Data, Ambetronics Engineers, General Tools & Instruments, and Testo

Humidity Testers Market by Segments

End Use:

  • Food And Beverages
  • Hospitals
  • Pharmaceutical
  • Automotive
  • Construction
  • Others

Measurement:

  • Relative Humidity
  • Absolute Humidity
  • Specific Humidity

Region:

  • North America
    • USA
    • Canada
    • Mexico
  • Latin America
    • Brazil
    • Chile
    • Rest of Latin America
  • Western Europe
    • Germany
    • UK
    • Italy
    • Spain
    • France
    • Nordic
    • BENELUX
    • Rest of Western Europe
  • Eastern Europe
    • Russia
    • Poland
    • Hungary
    • Balkan & Baltic
    • Rest of Eastern Europe
  • East Asia
    • China
    • Japan
    • South Korea
  • South Asia and Pacific
    • India
    • ASEAN
    • Australia & New Zealand
    • Rest of South Asia and Pacific
  • Middle East & Africa
    • Kingdom of Saudi Arabia
    • Other GCC Countries
    • Turkiye
    • South Africa
    • Other African Union
    • Rest of Middle East & Africa

Table of Content

  1. Executive Summary
    • Global Market Outlook
    • Demand-side Trends
    • Supply-side Trends
    • Technology Roadmap Analysis
    • Analysis and Recommendations
  2. Market Overview
    • Market Coverage / Taxonomy
    • Market Definition / Scope / Limitations
  3. Market Background
    • Market Dynamics
      • Drivers
      • Restraints
      • Opportunity
      • Trends
    • Scenario Forecast
      • Demand in Optimistic Scenario
      • Demand in Likely Scenario
      • Demand in Conservative Scenario
    • Opportunity Map Analysis
    • Product Life Cycle Analysis
    • Supply Chain Analysis
    • Investment Feasibility Matrix
    • Value Chain Analysis
    • PESTLE and Porter’s Analysis
    • Regulatory Landscape
    • Regional Parent Market Outlook
    • Production and Consumption Statistics
    • Import and Export Statistics
  4. Global Market Analysis 2020 to 2024 and Forecast, 2025 to 2035
    • Historical Market Size Value (USD Million) Analysis, 2020 to 2024
    • Current and Future Market Size Value (USD Million) Projections, 2025 to 2035
      • Y-o-Y Growth Trend Analysis
      • Absolute $ Opportunity Analysis
  5. Global Market Pricing Analysis 2020 to 2024 and Forecast 2025 to 2035
  6. Global Market Analysis 2020 to 2024 and Forecast 2025 to 2035, By End Use
    • Introduction / Key Findings
    • Historical Market Size Value (USD Million) Analysis By End Use , 2020 to 2024
    • Current and Future Market Size Value (USD Million) Analysis and Forecast By End Use , 2025 to 2035
      • Food And Beverages
      • Hospitals
      • Pharmaceutical
      • Automotive
      • Construction
      • Others
    • Y-o-Y Growth Trend Analysis By End Use , 2020 to 2024
    • Absolute $ Opportunity Analysis By End Use , 2025 to 2035
  7. Global Market Analysis 2020 to 2024 and Forecast 2025 to 2035, By Measurement
    • Introduction / Key Findings
    • Historical Market Size Value (USD Million) Analysis By Measurement, 2020 to 2024
    • Current and Future Market Size Value (USD Million) Analysis and Forecast By Measurement, 2025 to 2035
      • Relative Humidity
      • Absolute Humidity
      • Specific Humidity
    • Y-o-Y Growth Trend Analysis By Measurement, 2020 to 2024
    • Absolute $ Opportunity Analysis By Measurement, 2025 to 2035
  8. Global Market Analysis 2020 to 2024 and Forecast 2025 to 2035, By Region
    • Introduction
    • Historical Market Size Value (USD Million) Analysis By Region, 2020 to 2024
    • Current Market Size Value (USD Million) Analysis and Forecast By Region, 2025 to 2035
      • North America
      • Latin America
      • Western Europe
      • Eastern Europe
      • East Asia
      • South Asia and Pacific
      • Middle East & Africa
    • Market Attractiveness Analysis By Region
  9. North America Market Analysis 2020 to 2024 and Forecast 2025 to 2035, By Country
    • Historical Market Size Value (USD Million) Trend Analysis By Market Taxonomy, 2020 to 2024
    • Market Size Value (USD Million) Forecast By Market Taxonomy, 2025 to 2035
      • By Country
        • USA
        • Canada
        • Mexico
      • By End Use
      • By Measurement
    • Market Attractiveness Analysis
      • By Country
      • By End Use
      • By Measurement
    • Key Takeaways
  10. Latin America Market Analysis 2020 to 2024 and Forecast 2025 to 2035, By Country
    • Historical Market Size Value (USD Million) Trend Analysis By Market Taxonomy, 2020 to 2024
    • Market Size Value (USD Million) Forecast By Market Taxonomy, 2025 to 2035
      • By Country
        • Brazil
        • Chile
        • Rest of Latin America
      • By End Use
      • By Measurement
    • Market Attractiveness Analysis
      • By Country
      • By End Use
      • By Measurement
    • Key Takeaways
  11. Western Europe Market Analysis 2020 to 2024 and Forecast 2025 to 2035, By Country
    • Historical Market Size Value (USD Million) Trend Analysis By Market Taxonomy, 2020 to 2024
    • Market Size Value (USD Million) Forecast By Market Taxonomy, 2025 to 2035
      • By Country
        • Germany
        • UK
        • Italy
        • Spain
        • France
        • Nordic
        • BENELUX
        • Rest of Western Europe
      • By End Use
      • By Measurement
    • Market Attractiveness Analysis
      • By Country
      • By End Use
      • By Measurement
    • Key Takeaways
  12. Eastern Europe Market Analysis 2020 to 2024 and Forecast 2025 to 2035, By Country
    • Historical Market Size Value (USD Million) Trend Analysis By Market Taxonomy, 2020 to 2024
    • Market Size Value (USD Million) Forecast By Market Taxonomy, 2025 to 2035
      • By Country
        • Russia
        • Poland
        • Hungary
        • Balkan & Baltic
        • Rest of Eastern Europe
      • By End Use
      • By Measurement
    • Market Attractiveness Analysis
      • By Country
      • By End Use
      • By Measurement
    • Key Takeaways
  13. East Asia Market Analysis 2020 to 2024 and Forecast 2025 to 2035, By Country
    • Historical Market Size Value (USD Million) Trend Analysis By Market Taxonomy, 2020 to 2024
    • Market Size Value (USD Million) Forecast By Market Taxonomy, 2025 to 2035
      • By Country
        • China
        • Japan
        • South Korea
      • By End Use
      • By Measurement
    • Market Attractiveness Analysis
      • By Country
      • By End Use
      • By Measurement
    • Key Takeaways
  14. South Asia and Pacific Market Analysis 2020 to 2024 and Forecast 2025 to 2035, By Country
    • Historical Market Size Value (USD Million) Trend Analysis By Market Taxonomy, 2020 to 2024
    • Market Size Value (USD Million) Forecast By Market Taxonomy, 2025 to 2035
      • By Country
        • India
        • ASEAN
        • Australia & New Zealand
        • Rest of South Asia and Pacific
      • By End Use
      • By Measurement
    • Market Attractiveness Analysis
      • By Country
      • By End Use
      • By Measurement
    • Key Takeaways
  15. Middle East & Africa Market Analysis 2020 to 2024 and Forecast 2025 to 2035, By Country
    • Historical Market Size Value (USD Million) Trend Analysis By Market Taxonomy, 2020 to 2024
    • Market Size Value (USD Million) Forecast By Market Taxonomy, 2025 to 2035
      • By Country
        • Kingdom of Saudi Arabia
        • Other GCC Countries
        • Turkiye
        • South Africa
        • Other African Union
        • Rest of Middle East & Africa
      • By End Use
      • By Measurement
    • Market Attractiveness Analysis
      • By Country
      • By End Use
      • By Measurement
    • Key Takeaways
  16. Key Countries Market Analysis
    • USA
      • Pricing Analysis
      • Market Share Analysis, 2024
        • By End Use
        • By Measurement
    • Canada
      • Pricing Analysis
      • Market Share Analysis, 2024
        • By End Use
        • By Measurement
    • Mexico
      • Pricing Analysis
      • Market Share Analysis, 2024
        • By End Use
        • By Measurement
    • Brazil
      • Pricing Analysis
      • Market Share Analysis, 2024
        • By End Use
        • By Measurement
    • Chile
      • Pricing Analysis
      • Market Share Analysis, 2024
        • By End Use
        • By Measurement
    • Germany
      • Pricing Analysis
      • Market Share Analysis, 2024
        • By End Use
        • By Measurement
    • UK
      • Pricing Analysis
      • Market Share Analysis, 2024
        • By End Use
        • By Measurement
    • Italy
      • Pricing Analysis
      • Market Share Analysis, 2024
        • By End Use
        • By Measurement
    • Spain
      • Pricing Analysis
      • Market Share Analysis, 2024
        • By End Use
        • By Measurement
    • France
      • Pricing Analysis
      • Market Share Analysis, 2024
        • By End Use
        • By Measurement
    • India
      • Pricing Analysis
      • Market Share Analysis, 2024
        • By End Use
        • By Measurement
    • ASEAN
      • Pricing Analysis
      • Market Share Analysis, 2024
        • By End Use
        • By Measurement
    • Australia & New Zealand
      • Pricing Analysis
      • Market Share Analysis, 2024
        • By End Use
        • By Measurement
    • China
      • Pricing Analysis
      • Market Share Analysis, 2024
        • By End Use
        • By Measurement
    • Japan
      • Pricing Analysis
      • Market Share Analysis, 2024
        • By End Use
        • By Measurement
    • South Korea
      • Pricing Analysis
      • Market Share Analysis, 2024
        • By End Use
        • By Measurement
    • Russia
      • Pricing Analysis
      • Market Share Analysis, 2024
        • By End Use
        • By Measurement
    • Poland
      • Pricing Analysis
      • Market Share Analysis, 2024
        • By End Use
        • By Measurement
    • Hungary
      • Pricing Analysis
      • Market Share Analysis, 2024
        • By End Use
        • By Measurement
    • Kingdom of Saudi Arabia
      • Pricing Analysis
      • Market Share Analysis, 2024
        • By End Use
        • By Measurement
    • Turkiye
      • Pricing Analysis
      • Market Share Analysis, 2024
        • By End Use
        • By Measurement
    • South Africa
      • Pricing Analysis
      • Market Share Analysis, 2024
        • By End Use
        • By Measurement
  17. Market Structure Analysis
    • Competition Dashboard
    • Competition Benchmarking
    • Market Share Analysis of Top Players
      • By Regional
      • By End Use
      • By Measurement
  18. Competition Analysis
    • Competition Deep Dive
      • Vaisala
        • Overview
        • Product Portfolio
        • Profitability by Market Segments (Product/Age /Sales Channel/Region)
        • Sales Footprint
        • Strategy Overview
          • Marketing Strategy
          • Product Strategy
          • Channel Strategy
      • University Products
      • Spectris
      • AVTECH Software
      • Process Sensing Technologies
      • Caption Data
      • Ambetronics Engineers
      • General Tools & Instruments
      • Testo
  19. Assumptions & Acronyms Used
  20. Research Methodology

List of Tables

  • Table 1: Global Market Value (USD Million) Forecast by Region, 2020-2035
  • Table 2: Global Market Value (USD Million) Forecast by End Use , 2020-2035
  • Table 3: Global Market Value (USD Million) Forecast by Measurement, 2020-2035
  • Table 4: North America Market Value (USD Million) Forecast by Country, 2020-2035
  • Table 5: North America Market Value (USD Million) Forecast by End Use , 2020-2035
  • Table 6: North America Market Value (USD Million) Forecast by Measurement, 2020-2035
  • Table 7: Latin America Market Value (USD Million) Forecast by Country, 2020-2035
  • Table 8: Latin America Market Value (USD Million) Forecast by End Use , 2020-2035
  • Table 9: Latin America Market Value (USD Million) Forecast by Measurement, 2020-2035
  • Table 10: Western Europe Market Value (USD Million) Forecast by Country, 2020-2035
  • Table 11: Western Europe Market Value (USD Million) Forecast by End Use , 2020-2035
  • Table 12: Western Europe Market Value (USD Million) Forecast by Measurement, 2020-2035
  • Table 13: Eastern Europe Market Value (USD Million) Forecast by Country, 2020-2035
  • Table 14: Eastern Europe Market Value (USD Million) Forecast by End Use , 2020-2035
  • Table 15: Eastern Europe Market Value (USD Million) Forecast by Measurement, 2020-2035
  • Table 16: East Asia Market Value (USD Million) Forecast by Country, 2020-2035
  • Table 17: East Asia Market Value (USD Million) Forecast by End Use , 2020-2035
  • Table 18: East Asia Market Value (USD Million) Forecast by Measurement, 2020-2035
  • Table 19: South Asia and Pacific Market Value (USD Million) Forecast by Country, 2020-2035
  • Table 20: South Asia and Pacific Market Value (USD Million) Forecast by End Use , 2020-2035
  • Table 21: South Asia and Pacific Market Value (USD Million) Forecast by Measurement, 2020-2035
  • Table 22: Middle East & Africa Market Value (USD Million) Forecast by Country, 2020-2035
  • Table 23: Middle East & Africa Market Value (USD Million) Forecast by End Use , 2020-2035
  • Table 24: Middle East & Africa Market Value (USD Million) Forecast by Measurement, 2020-2035

List of Figures

  • Figure 1: Global Market Pricing Analysis
  • Figure 2: Global Market Value (USD Million) Forecast 2020-2035
  • Figure 3: Global Market Value Share and BPS Analysis by End Use , 2025 and 2035
  • Figure 4: Global Market Y-o-Y Growth Comparison by End Use , 2025-2035
  • Figure 5: Global Market Attractiveness Analysis by End Use
  • Figure 6: Global Market Value Share and BPS Analysis by Measurement, 2025 and 2035
  • Figure 7: Global Market Y-o-Y Growth Comparison by Measurement, 2025-2035
  • Figure 8: Global Market Attractiveness Analysis by Measurement
  • Figure 9: Global Market Value (USD Million) Share and BPS Analysis by Region, 2025 and 2035
  • Figure 10: Global Market Y-o-Y Growth Comparison by Region, 2025-2035
  • Figure 11: Global Market Attractiveness Analysis by Region
  • Figure 12: North America Market Incremental Dollar Opportunity, 2025-2035
  • Figure 13: Latin America Market Incremental Dollar Opportunity, 2025-2035
  • Figure 14: Western Europe Market Incremental Dollar Opportunity, 2025-2035
  • Figure 15: Eastern Europe Market Incremental Dollar Opportunity, 2025-2035
  • Figure 16: East Asia Market Incremental Dollar Opportunity, 2025-2035
  • Figure 17: South Asia and Pacific Market Incremental Dollar Opportunity, 2025-2035
  • Figure 18: Middle East & Africa Market Incremental Dollar Opportunity, 2025-2035
  • Figure 19: North America Market Value Share and BPS Analysis by Country, 2025 and 2035
  • Figure 20: North America Market Value Share and BPS Analysis by End Use , 2025 and 2035
  • Figure 21: North America Market Y-o-Y Growth Comparison by End Use , 2025-2035
  • Figure 22: North America Market Attractiveness Analysis by End Use
  • Figure 23: North America Market Value Share and BPS Analysis by Measurement, 2025 and 2035
  • Figure 24: North America Market Y-o-Y Growth Comparison by Measurement, 2025-2035
  • Figure 25: North America Market Attractiveness Analysis by Measurement
  • Figure 26: Latin America Market Value Share and BPS Analysis by Country, 2025 and 2035
  • Figure 27: Latin America Market Value Share and BPS Analysis by End Use , 2025 and 2035
  • Figure 28: Latin America Market Y-o-Y Growth Comparison by End Use , 2025-2035
  • Figure 29: Latin America Market Attractiveness Analysis by End Use
  • Figure 30: Latin America Market Value Share and BPS Analysis by Measurement, 2025 and 2035
  • Figure 31: Latin America Market Y-o-Y Growth Comparison by Measurement, 2025-2035
  • Figure 32: Latin America Market Attractiveness Analysis by Measurement
  • Figure 33: Western Europe Market Value Share and BPS Analysis by Country, 2025 and 2035
  • Figure 34: Western Europe Market Value Share and BPS Analysis by End Use , 2025 and 2035
  • Figure 35: Western Europe Market Y-o-Y Growth Comparison by End Use , 2025-2035
  • Figure 36: Western Europe Market Attractiveness Analysis by End Use
  • Figure 37: Western Europe Market Value Share and BPS Analysis by Measurement, 2025 and 2035
  • Figure 38: Western Europe Market Y-o-Y Growth Comparison by Measurement, 2025-2035
  • Figure 39: Western Europe Market Attractiveness Analysis by Measurement
  • Figure 40: Eastern Europe Market Value Share and BPS Analysis by Country, 2025 and 2035
  • Figure 41: Eastern Europe Market Value Share and BPS Analysis by End Use , 2025 and 2035
  • Figure 42: Eastern Europe Market Y-o-Y Growth Comparison by End Use , 2025-2035
  • Figure 43: Eastern Europe Market Attractiveness Analysis by End Use
  • Figure 44: Eastern Europe Market Value Share and BPS Analysis by Measurement, 2025 and 2035
  • Figure 45: Eastern Europe Market Y-o-Y Growth Comparison by Measurement, 2025-2035
  • Figure 46: Eastern Europe Market Attractiveness Analysis by Measurement
  • Figure 47: East Asia Market Value Share and BPS Analysis by Country, 2025 and 2035
  • Figure 48: East Asia Market Value Share and BPS Analysis by End Use , 2025 and 2035
  • Figure 49: East Asia Market Y-o-Y Growth Comparison by End Use , 2025-2035
  • Figure 50: East Asia Market Attractiveness Analysis by End Use
  • Figure 51: East Asia Market Value Share and BPS Analysis by Measurement, 2025 and 2035
  • Figure 52: East Asia Market Y-o-Y Growth Comparison by Measurement, 2025-2035
  • Figure 53: East Asia Market Attractiveness Analysis by Measurement
  • Figure 54: South Asia and Pacific Market Value Share and BPS Analysis by Country, 2025 and 2035
  • Figure 55: South Asia and Pacific Market Value Share and BPS Analysis by End Use , 2025 and 2035
  • Figure 56: South Asia and Pacific Market Y-o-Y Growth Comparison by End Use , 2025-2035
  • Figure 57: South Asia and Pacific Market Attractiveness Analysis by End Use
  • Figure 58: South Asia and Pacific Market Value Share and BPS Analysis by Measurement, 2025 and 2035
  • Figure 59: South Asia and Pacific Market Y-o-Y Growth Comparison by Measurement, 2025-2035
  • Figure 60: South Asia and Pacific Market Attractiveness Analysis by Measurement
  • Figure 61: Middle East & Africa Market Value Share and BPS Analysis by Country, 2025 and 2035
  • Figure 62: Middle East & Africa Market Value Share and BPS Analysis by End Use , 2025 and 2035
  • Figure 63: Middle East & Africa Market Y-o-Y Growth Comparison by End Use , 2025-2035
  • Figure 64: Middle East & Africa Market Attractiveness Analysis by End Use
  • Figure 65: Middle East & Africa Market Value Share and BPS Analysis by Measurement, 2025 and 2035
  • Figure 66: Middle East & Africa Market Y-o-Y Growth Comparison by Measurement, 2025-2035
  • Figure 67: Middle East & Africa Market Attractiveness Analysis by Measurement
  • Figure 68: Global Market - Tier Structure Analysis
  • Figure 69: Global Market - Company Share Analysis

Frequently Asked Questions

How big is the humidity testers market in 2025?

The global humidity testers market is estimated to be valued at USD 1.3 billion in 2025.

What will be the size of humidity testers market in 2035?

The market size for the humidity testers market is projected to reach USD 3.1 billion by 2035.

How much will be the humidity testers market growth between 2025 and 2035?

The humidity testers market is expected to grow at a 9.1% CAGR between 2025 and 2035.

What are the key product types in the humidity testers market?

The key product types in humidity testers market are food and beverages, hospitals, pharmaceutical, automotive, construction and others.

Which measurement segment to contribute significant share in the humidity testers market in 2025?

In terms of measurement, relative humidity segment to command 45.0% share in the humidity testers market in 2025.

Explore Similar Insights

Future Market Insights

Humidity Testers Market

Chat With MaRIA

Chat With

MaRIA

Hi There, I am MaRIA, Your Market Research Intelligence Assistant. How may I help you?