Smart-Cap UV Testers Market Size and Share Forecast Outlook 2025 to 2035

The Smart-Cap UV Testers Market will expand from USD 1.3 billion in 2025 to USD 2.5 billion by 2035, registering a CAGR of 6.6%. Growth is driven by increasing adoption of UV-based disinfection and quality control solutions across packaging and food sectors. Smart sensor-integrated testers dominate due to enhanced accuracy and digital connectivity. Between 2025 and 2030, AI-assisted UV calibration will account for USD 0.6 billion in growth. From 2030 to 2035, real-time IoT-enabled UV performance analytics will drive additional expansion.
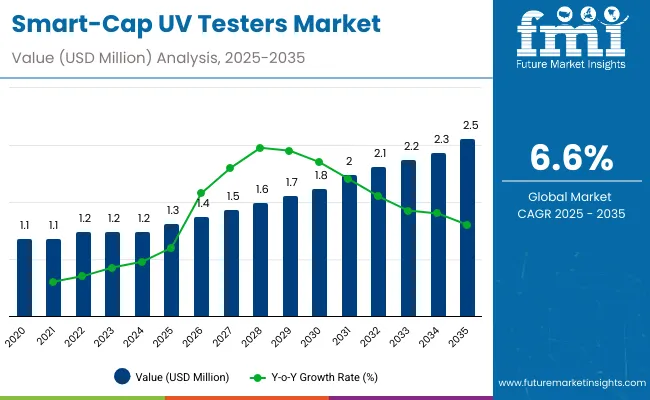
Quick Stats for Smart-Cap UV Testers Market

  • Market Value (2025): USD 1.3 billion
  • Market Forecast Value (2035): USD 2.5 billion
  • Market Forecast CAGR: 6.6%
  • Leading End-Use Industry (2025): Food and Beverages (43.1%)
  • Key Growth Regions: Asia-Pacific, led by South Korea (7.0% CAGR)
  • Top Companies: LARQ, CrazyCap, NOERDEN, Philips (GoZero UV), Mahaton, Capo UV, Nalgene UV, WAATR, UVBrite, KleanKanteen

Smart Cap Uv Testers Market

Metric Value
Industry Size (2025E) USD 1.3 billion
Industry Value (2035F) USD 2.5 billion
CAGR (2025 to 2035) 6.6%

Between 2020 and 2024, the market expanded due to hygiene awareness and UV sterilization technology integration in consumer packaging. Smart sensors and IoT-based monitoring enhanced UV validation in bottle caps and reusable containers. By 2035, the market will reach USD 2.5 billion, supported by AI diagnostics, multi-spectrum UV verification, and recyclable smart closures. Asia-Pacific will dominate as UV packaging testing becomes essential for safety compliance and consumer product innovation.

Why is the Smart-Cap UV Testers Market Growing?

Growth is driven by surging demand for contactless sterilization in beverage and healthcare packaging. Consumers’ preference for reusable smart bottles and caps is accelerating UV quality testing integration. IoT-enabled testers provide automated calibration, data analytics, and durability validation, aligning with sustainability and health safety regulations across food, cosmetic, and pharmaceutical packaging industries worldwide.

Segmental Analysis

The market is segmented by technology, application, material compatibility, end-use industry, and region. Technologies include smart sensor-integrated testers, UV intensity meters, and wireless IoT-enabled testers. Applications span beverage bottle caps, pharmaceutical containers, and cosmetic packaging. End-use industries include food & beverages, pharmaceuticals, and cosmetics.
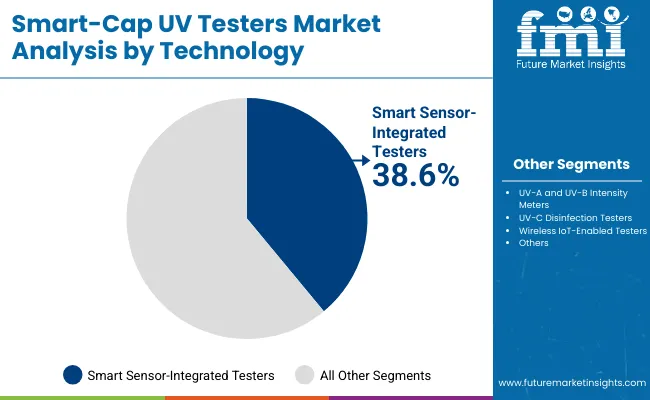
Smart Sensor-Integrated Testers Lead by Technology

Smart Cap Uv Testers Market By Technology

Smart sensor-integrated testers will account for 38.6% share in 2025 due to advanced accuracy and automation in UV verification. These systems offer real-time data tracking and calibration consistency. By 2035, AI-powered smart testers will dominate, ensuring faster validation, reduced maintenance, and improved efficiency in beverage and healthcare packaging quality control lines.
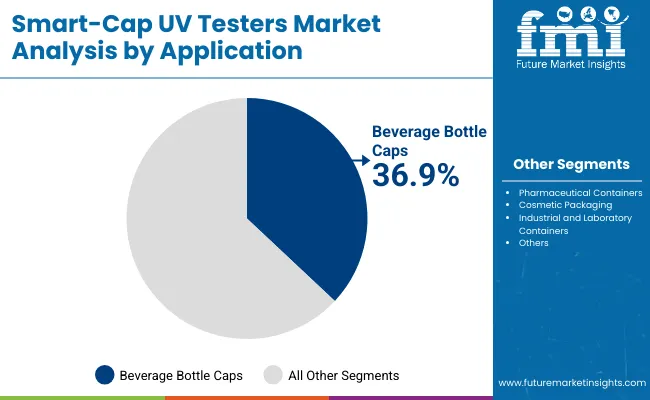
Beverage Bottle Caps Dominate by Application

Smart Cap Uv Testers Market By Application

Beverage bottle caps will hold 36.9% share in 2025, driven by global adoption of UV-enabled smart bottles ensuring hygiene and sterilization. Integration of embedded sensors supports automated testing. By 2035, rising demand for reusable water bottles and sterilizable beverage caps will further boost segment growth across North America, Europe, and Asia.
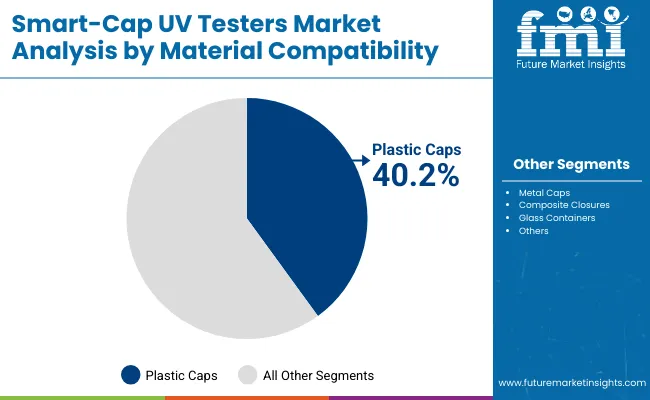
Plastic Caps Lead by Material Compatibility

Smart Cap Uv Testers Market By Material

Plastic caps will represent 40.2% share in 2025, favored for cost efficiency and compatibility with embedded electronics. These materials enable UV penetration and sensor integration. By 2035, recyclable plastic composites will gain traction as sustainability policies promote eco-designed smart packaging for household and beverage products.
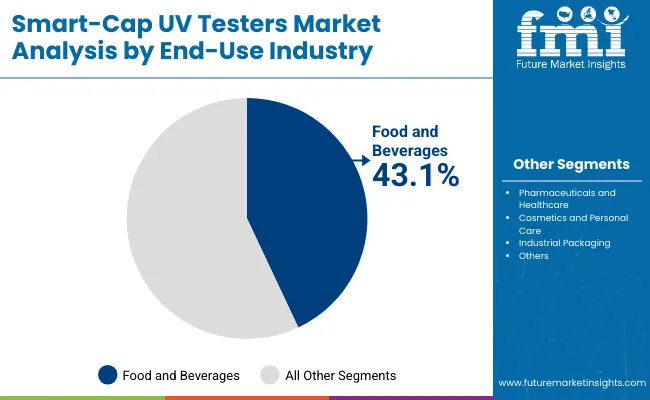
Food and Beverages Lead by End Use

Smart Cap Uv Testers Market By End Use

The food and beverages segment will lead with 43.1% share in 2025, driven by UV verification demand in drinkware and container safety. By 2035, digitized UV monitoring systems and portable test solutions will reinforce hygiene protocols and product traceability for beverage and nutrition industries.

Drivers, Restraints, Opportunities, and Key Trends

Growing health awareness, hygiene certification standards, and demand for reusable UV-integrated packaging drive market growth.

High product development cost and limited consumer awareness in developing economies slow adoption.

Emerging demand for IoT-enabled UV systems and energy-efficient smart caps creates scope for digital packaging innovation.

Leading trends include hybrid UV testing technology, wireless IoT connectivity, battery-efficient designs, and smart diagnostic platforms integrating cloud-based performance analytics for UV verification.
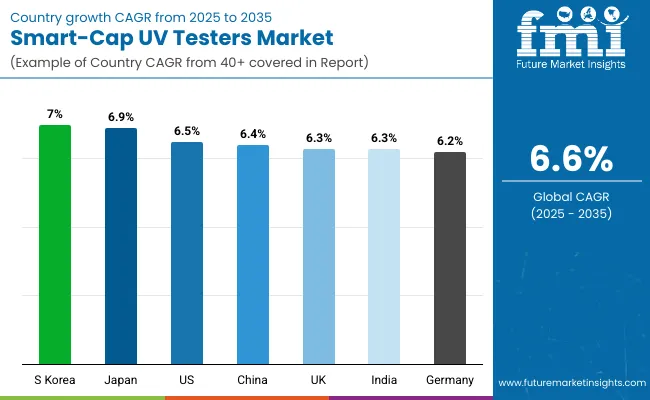
Analysis of Smart-Cap UV Testers Market by Key Countries

Smart Cap Uv Testers Market By Country

The global smart-cap UV testers market is expanding as hygiene, digital health, and connected packaging trends gain momentum across consumer and industrial segments. Asia-Pacific leads technological adoption, particularly in smart hydration and reusable bottle applications, while North America and Europe focus on IoT-based UV safety and compliance systems. Growth is supported by demand for real-time sterilization verification, AI-enabled diagnostics, and eco-smart product innovation in personal care, food, and beverage packaging industries.
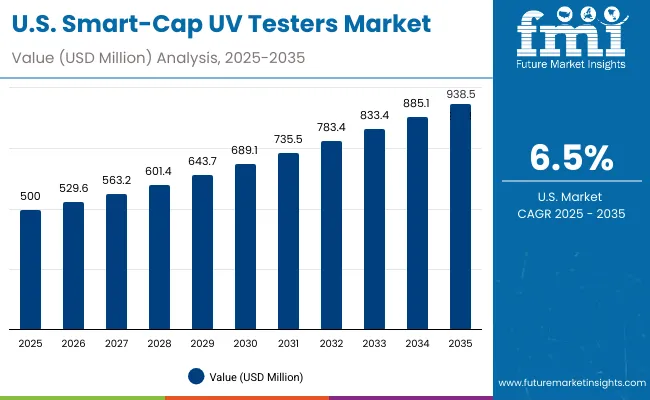
United States Sales Outlook

Smart Cap Uv Testers Market Usa

The USA will grow at 6.5% CAGR, driven by FDA-certified packaging and advancements in smart bottle manufacturing. UV testing modules are being integrated into reusable containers to improve hygiene assurance and consumer confidence. Sustainability initiatives and connected device platforms are encouraging the development of UV-enabled refillable systems. IoT-integrated smart cap solutions are expanding across commercial, medical, and hydration product categories for precision sterilization validation.
  • UV diagnostics integrated into reusable containers.
  • Sustainability initiatives drive product innovation.
  • IoT-enabled smart cap systems expand commercial adoption.

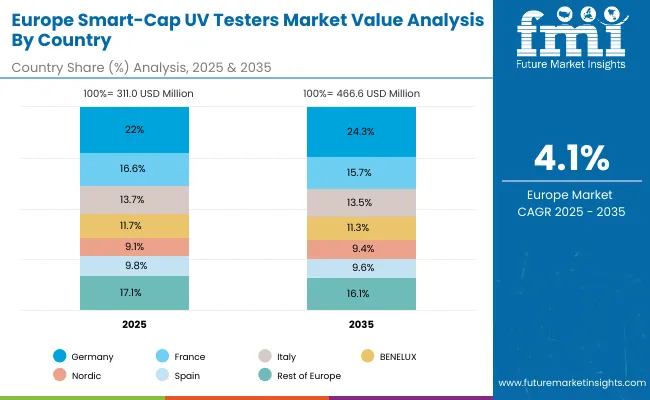
Germany Growth Outlook

Smart Cap Uv Testers Market Europe

Germany will expand at 6.2% CAGR, supported by precision manufacturing and sustainability-led innovation. UV-based safety verification technologies are being embedded into industrial packaging and lab-grade containers. Smart sensor systems are improving calibration accuracy and reliability for automated testing environments. The country’s strong export base in intelligent packaging components continues to reinforce its position as a hub for high-quality UV-cap production.

  • UV-based safety verification expands.
  • Smart sensors improve calibration.
  • Exports of intelligent caps rise.

United Kingdom Expansion Outlook

The UK will grow at 6.3% CAGR, focusing on premium hydration and personal care packaging solutions. Luxury water bottle and sports drink brands are increasingly adopting smart UV testing caps to elevate consumer trust. Safety certifications for digital hygiene products are stimulating market penetration. Integration of AI and digital diagnostics into smart packaging platforms is enhancing transparency and traceability across production chains.

  • Luxury hydration brands adopt smart UV systems.
  • Safety certifications strengthen demand.
  • Integration of digital diagnostics accelerates growth.

China Sales Outlook

China will grow at 6.4% CAGR, leading mass-scale production and export of UV-enabled smart caps. OEM collaborations are expanding manufacturing efficiency for smart and connected packaging components. Rapid adoption of AI-enabled UV testing systems is supporting domestic brands in water, beverage, and wellness categories. Continued government support for smart manufacturing is driving digital quality control and sterilization system integration.

  • OEM partnerships expand output.
  • Smart sensor adoption grows rapidly.
  • Domestic brands emphasize AI-enabled testing.

India Growth Outlook

India will grow at 6.3% CAGR, driven by urbanization, wellness awareness, and hygiene-focused consumer behavior. Demand for sterilized drinkware and smart hydration devices is surging among urban consumers. Local manufacturing of smart product components is increasing under the "Make in India" initiative. Government-led hygiene and wellness programs are further accelerating adoption of UV-based packaging systems.

  • Consumer shift to sterilized drinkware.
  • Smart product manufacturing surges.
  • Government hygiene programs aid adoption.

Japan Outlook

Japan will grow at 6.9% CAGR, pioneering compact UV-cap designs integrated with data logging and real-time monitoring. Miniaturized modules are leading innovation in both consumer and medical-grade smart packaging. AI-based analytics are enhancing predictive maintenance and safety monitoring. The export of food-grade smart UV packaging systems is strengthening Japan’s position as a leader in intelligent sterilization technology.

  • Miniaturized smart modules lead innovation.
  • AI analytics enhance product safety.
  • Exports rise in food-grade packaging.

South Korea Expansion Outlook

South Korea will lead with 7.0% CAGR, driven by technological convergence in packaging and hygiene sectors. K-tech packaging firms are scaling production of AI-enabled smart hydration systems. UV verification technology is becoming integral to the country’s hygiene export ecosystem. Smart packaging startups are driving innovation in real-time sterilization, supported by government funding and global sustainability initiatives.
  • K-tech packaging brands expand rapidly.
  • UV verification aligns with hygiene exports.
  • AI-enabled caps drive smart hydration systems.

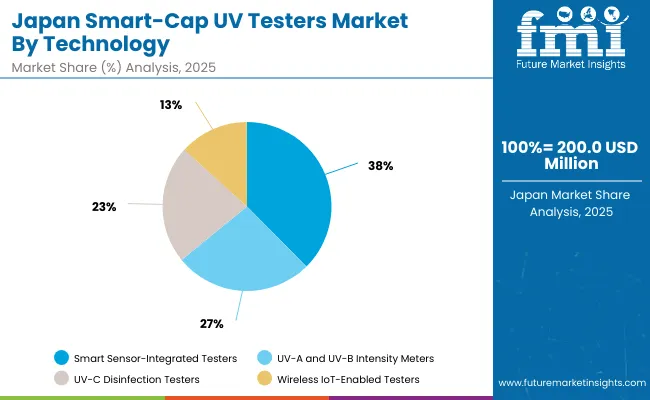
Japan Smart-Cap UV Testers Market by Technology

Smart Cap Uv Testers Market Japan

Japan’s smart-cap UV testers market, valued at USD 200.0 million in 2025, is led by smart sensor-integrated testers that provide precise UV calibration and real-time data analytics. UV-A and UV-B intensity meters are widely adopted in packaging validation and hygiene monitoring systems. UV-C disinfection testers play a vital role in sterilization quality control, while wireless IoT-enabled testers support automated testing workflows. Japan’s robust innovation ecosystem continues to enhance smart packaging and digital testing technologies.
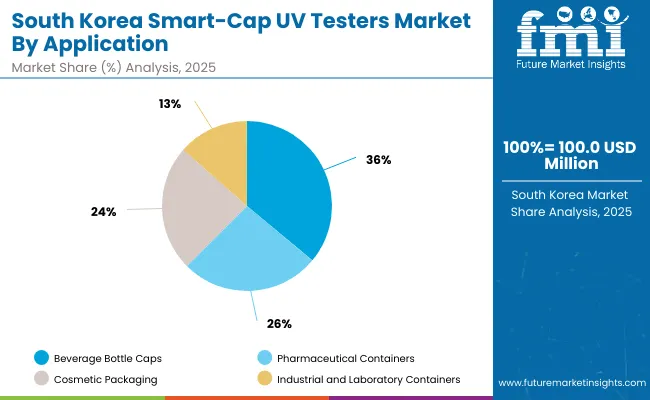
South Korea Smart-Cap UV Testers Market by Application

Smart Cap Uv Testers Market South Korea

South Korea’s smart-cap UV testers market, valued at USD 100.0 million in 2025, is dominated by beverage bottle caps driven by rising demand for consumer safety and freshness assurance. Pharmaceutical containers follow, reflecting stringent UV sterilization standards in healthcare packaging. Cosmetic packaging applications expand as brands prioritize contamination-free storage. Industrial and laboratory containers utilize advanced testers for controlled UV exposure monitoring. South Korea’s manufacturing precision strengthens UV-based packaging validation systems.
Competitive Landscape

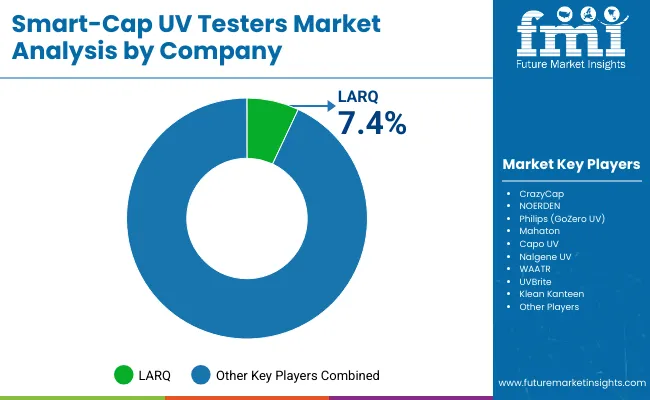
Smart Cap Uv Testers Market By Company

The market is moderately consolidated with LARQ, CrazyCap, NOERDEN, Philips (GoZero UV), Mahaton, Capo UV, Nalgene UV, WAATR, UVBrite, and KleanKanteen as key players. These companies lead with AI-based sterilization testers, energy-efficient UV modules, and recyclable smart bottle designs. LARQ and CrazyCap dominate in premium hydration solutions, while Philips (GoZero UV) and Mahaton focus on integrating IoT-enabled health monitoring into packaging.

Key Developments of Smart-Cap UV Testers Market

  • On June 28, 2025, UVBrite issued a press release highlighting its Smart Water Bottle, emphasizing enhancements in rechargeable UV-C LED purification, thermal insulation, and self-cleaning automation positioning itself as a leader in UV-C based intelligent hydration systems.
  • In February 2024, Brita SE (Germany) acquired LARQ, Inc., the smart water bottle company known for UV-C self-cleaning hydration products thereby expanding Brita’s consumer portfolio, especially in North America.

Key Companies

  • LARQ
  • CrazyCap
  • NOERDEN
  • Philips (GoZero UV)
  • Mahaton
  • Capo UV
  • Nalgene UV
  • WAATR
  • UVBrite
  • KleanKanteen

Scope of the Report

Item Value
Quantitative Units USD 1.3 Billion
By Technology Smart Sensor, UV-A/B, UV-C, Wireless IoT
By Application Beverage Caps, Pharma Containers, Cosmetic Packaging
By Material Plastic, Metal, Composite, Glass
By End-Use Industry Food & Beverages, Pharma, Cosmetics, Industrial
Key Companies Profiled LARQ, CrazyCap, NOERDEN, Philips (GoZero UV), Mahaton, Capo UV, Nalgene UV, WAATR, UVBrite, Klean Kanteen
Additional Attributes Growth driven by smart hygiene tech, UV-based safety testing, and IoT-enabled verification systems.

Key Segmentation

By Technology:

  • Smart Sensor-Integrated Testers
  • UV-A and UV-B Intensity Meters
  • UV-C Disinfection Testers
  • Wireless IoT-Enabled Testers

By Application:

  • Beverage Bottle Caps
  • Pharmaceutical Containers
  • Cosmetic Packaging
  • Industrial and Laboratory Containers

By Material Compatibility:

  • Plastic Caps
  • Metal Caps
  • Composite Closures
  • Glass Containers

By End-Use Industry:

  • Food and Beverages
  • Pharmaceuticals and Healthcare
  • Cosmetics and Personal Care
  • Industrial Packaging

By Region:

  • North America
  • Europe
  • Asia-Pacific
  • Latin America
  • Middle East & Africa

Frequently Asked Questions

What is the market size of the Smart-Cap UV Testers Market in 2025?

The Smart-Cap UV Testers Market is valued at USD 1.3 billion in 2025.

What will be the market size of the Smart-Cap UV Testers Market by 2035?

The Smart-Cap UV Testers Market will reach USD 2.5 billion by 2035.

What is the CAGR of the Smart-Cap UV Testers Market during 2025–2035?

The Smart-Cap UV Testers Market is expected to grow at a CAGR of 6.6%.

Which technology segment dominates the Smart-Cap UV Testers Market in 2025?

Smart sensor-integrated testers lead with 38.6% market share in 2025.

Which material type is most widely used in the Smart-Cap UV Testers Market?

Plastic caps dominate material compatibility with a 40.2% share in 2025.

Table of Content

  1. Executive Summary
  2. Industry Introduction, including Taxonomy and Market Definition
  3. Smart-Cap UV Testers Market Trends and Success Factors, including Macro-economic Factors, Market Dynamics, and Recent Industry Developments
  4. Global Market Demand Analysis 2020 to 2024 and Forecast 2025 to 2035, including Historical Analysis and Future Projections
  5. Pricing Analysis
  6. Global Market Analysis 2020 to 2024 and Forecast 2025 to 2035
    • Technology
    • Application
    • Material Compatibility
    • End-Use Industry
  7. Global Market Analysis 2020 to 2024 and Forecast 2025 to 2035, By Technology
    • Smart Sensor-Integrated Testers
    • UV-A and UV-B Intensity Meters
    • UV-C Disinfection Testers
    • Wireless IoT-Enabled Testers
  8. Global Market Analysis 2020 to 2024 and Forecast 2025 to 2035, By Application
    • Beverage Bottle Caps
    • Pharmaceutical Containers
    • Cosmetic Packaging
    • Industrial and Laboratory Containers
  9. Global Market Analysis 2020 to 2024 and Forecast 2025 to 2035, By Material Compatibility
    • Plastic Caps
    • Metal Caps
    • Composite Closures
    • Glass Containers
  10. Global Market Analysis 2020 to 2024 and Forecast 2025 to 2035, By End-Use Industry
    • Food and Beverages
    • Pharmaceuticals and Healthcare
    • Cosmetics and Personal Care
    • Industrial Packaging
  11. Global Market Analysis 2020 to 2024 and Forecast 2025 to 2035, By Region
    • North America
    • Latin America
    • Europe
    • East Asia
    • South Asia
    • Middle East & Africa
  12. North America Sales Analysis 2020 to 2024 and Forecast 2025 to 2035, by Key Segments and Countries
  13. Latin America Sales Analysis 2020 to 2024 and Forecast 2025 to 2035, by Key Segments and Countries
  14. Europe Sales Analysis 2020 to 2024 and Forecast 2025 to 2035, by Key Segments and Countries
  15. East Asia Sales Analysis 2020 to 2024 and Forecast 2025 to 2035, by Key Segments and Countries
  16. South Asia Sales Analysis 2020 to 2024 and Forecast 2025 to 2035, by Key Segments and Countries
  17. Middle East & Africa Sales Analysis 2020 to 2024 and Forecast 2025 to 2035, by Key Segments and Countries
  18. Sales Forecast 2025 to 2035 by Technology, Application, Material Compatibility, End-Use Industry for Countries
  19. Competition Outlook, including Market Structure Analysis, Company Share Analysis by Key Players, and Competition Dashboard
  20. Company Profile
    • LARQ
    • CrazyCap
    • NOERDEN
    • Philips (GoZero UV)
    • Mahaton
    • Capo UV
    • Nalgene UV
    • WAATR
    • UVBrite
    • Klean Kanteen

List of Tables

  • Table 1: Global Market Value (USD Billion) & Units Forecast by Region, 2020-2035
  • Table 2: Global Market Value (USD Billion) & Units Forecast by Technology, 2020-2035
  • Table 3: Global Market Value (USD Billion) & Units Forecast by Application, 2020-2035
  • Table 4: Global Market Value (USD Billion) & Units Forecast by Material Compatibility, 2020-2035
  • Table 5: Global Market Value (USD Billion) & Units Forecast by End-Use Industry, 2020-2035
  • Table 6: North America Market Value (USD Billion) & Units Forecast by Country, 2020-2035
  • Table 7: North America Market Value (USD Billion) & Units Forecast by Technology, 2020-2035
  • Table 8: North America Market Value (USD Billion) & Units Forecast by Application, 2020-2035
  • Table 9: North America Market Value (USD Billion) & Units Forecast by Material Compatibility, 2020-2035
  • Table 10: North America Market Value (USD Billion) & Units Forecast by End-Use Industry, 2020-2035
  • Table 11: Latin America Market Value (USD Billion) & Units Forecast by Country, 2020-2035
  • Table 12: Latin America Market Value (USD Billion) & Units Forecast by Technology, 2020-2035
  • Table 13: Latin America Market Value (USD Billion) & Units Forecast by Application, 2020-2035
  • Table 14: Latin America Market Value (USD Billion) & Units Forecast by Material Compatibility, 2020-2035
  • Table 15: Latin America Market Value (USD Billion) & Units Forecast by End-Use Industry, 2020-2035
  • Table 16: Europe Market Value (USD Billion) & Units Forecast by Country, 2020-2035
  • Table 17: Europe Market Value (USD Billion) & Units Forecast by Technology, 2020-2035
  • Table 18: Europe Market Value (USD Billion) & Units Forecast by Application, 2020-2035
  • Table 19: Europe Market Value (USD Billion) & Units Forecast by Material Compatibility, 2020-2035
  • Table 20: Europe Market Value (USD Billion) & Units Forecast by End-Use Industry, 2020-2035
  • Table 21: East Asia Market Value (USD Billion) & Units Forecast by Country, 2020-2035
  • Table 22: East Asia Market Value (USD Billion) & Units Forecast by Technology, 2020-2035
  • Table 23: East Asia Market Value (USD Billion) & Units Forecast by Application, 2020-2035
  • Table 24: East Asia Market Value (USD Billion) & Units Forecast by Material Compatibility, 2020-2035
  • Table 25: East Asia Market Value (USD Billion) & Units Forecast by End-Use Industry, 2020-2035
  • Table 26: South Asia Market Value (USD Billion) & Units Forecast by Country, 2020-2035
  • Table 27: South Asia Market Value (USD Billion) & Units Forecast by Technology, 2020-2035
  • Table 28: South Asia Market Value (USD Billion) & Units Forecast by Application, 2020-2035
  • Table 29: South Asia Market Value (USD Billion) & Units Forecast by Material Compatibility, 2020-2035
  • Table 30: South Asia Market Value (USD Billion) & Units Forecast by End-Use Industry, 2020-2035
  • Table 31: Middle East & Africa Market Value (USD Billion) & Units Forecast by Country, 2020-2035
  • Table 32: Middle East & Africa Market Value (USD Billion) & Units Forecast by Technology, 2020-2035
  • Table 33: Middle East & Africa Market Value (USD Billion) & Units Forecast by Application, 2020-2035
  • Table 34: Middle East & Africa Market Value (USD Billion) & Units Forecast by Material Compatibility, 2020-2035
  • Table 35: Middle East & Africa Market Value (USD Billion) & Units Forecast by End-Use Industry, 2020-2035

List of Figures

  • Figure 1: Global Market Value Share (%), Growth Rate (Y-o-Y), and Value (USD Billion) & Units Projection by Technology, 2020-2035
  • Figure 2: Global Market Value Share (%), Growth Rate (Y-o-Y), and Value (USD Billion) & Units Projection by Application, 2020-2035
  • Figure 3: Global Market Value Share (%), Growth Rate (Y-o-Y), and Value (USD Billion) & Units Projection by Material Compatibility, 2020-2035
  • Figure 4: Global Market Value Share (%), Growth Rate (Y-o-Y), and Value (USD Billion) & Units Projection by End-Use Industry, 2020-2035
  • Figure 5: Global Market Value Share (%), Growth Rate (Y-o-Y), and Value (USD Billion) & Units Projection by Region, 2020-2035
  • Figure 6: North America Market Value Share (%), Growth Rate (Y-o-Y), and Value (USD Billion) & Units Projection by Technology, 2020-2035
  • Figure 7: North America Market Value Share (%), Growth Rate (Y-o-Y), and Value (USD Billion) & Units Projection by Application, 2020-2035
  • Figure 8: North America Market Value Share (%), Growth Rate (Y-o-Y), and Value (USD Billion) & Units Projection by Material Compatibility, 2020-2035
  • Figure 9: North America Market Value Share (%), Growth Rate (Y-o-Y), and Value (USD Billion) & Units Projection by End-Use Industry, 2020-2035
  • Figure 10: North America Market Value Share (%), Growth Rate (Y-o-Y), and Value (USD Billion) & Units Projection by Country, 2020-2035
  • Figure 11: Latin America Market Value Share (%), Growth Rate (Y-o-Y), and Value (USD Billion) & Units Projection by Technology, 2020-2035
  • Figure 12: Latin America Market Value Share (%), Growth Rate (Y-o-Y), and Value (USD Billion) & Units Projection by Application, 2020-2035
  • Figure 13: Latin America Market Value Share (%), Growth Rate (Y-o-Y), and Value (USD Billion) & Units Projection by Material Compatibility, 2020-2035
  • Figure 14: Latin America Market Value Share (%), Growth Rate (Y-o-Y), and Value (USD Billion) & Units Projection by End-Use Industry, 2020-2035
  • Figure 15: Latin America Market Value Share (%), Growth Rate (Y-o-Y), and Value (USD Billion) & Units Projection by Country, 2020-2035
  • Figure 16: Europe Market Value Share (%), Growth Rate (Y-o-Y), and Value (USD Billion) & Units Projection by Technology, 2020-2035
  • Figure 17: Europe Market Value Share (%), Growth Rate (Y-o-Y), and Value (USD Billion) & Units Projection by Application, 2020-2035
  • Figure 18: Europe Market Value Share (%), Growth Rate (Y-o-Y), and Value (USD Billion) & Units Projection by Material Compatibility, 2020-2035
  • Figure 19: Europe Market Value Share (%), Growth Rate (Y-o-Y), and Value (USD Billion) & Units Projection by End-Use Industry, 2020-2035
  • Figure 20: Europe Market Value Share (%), Growth Rate (Y-o-Y), and Value (USD Billion) & Units Projection by Country, 2020-2035
  • Figure 21: East Asia Market Value Share (%), Growth Rate (Y-o-Y), and Value (USD Billion) & Units Projection by Technology, 2020-2035
  • Figure 22: East Asia Market Value Share (%), Growth Rate (Y-o-Y), and Value (USD Billion) & Units Projection by Application, 2020-2035
  • Figure 23: East Asia Market Value Share (%), Growth Rate (Y-o-Y), and Value (USD Billion) & Units Projection by Material Compatibility, 2020-2035
  • Figure 24: East Asia Market Value Share (%), Growth Rate (Y-o-Y), and Value (USD Billion) & Units Projection by End-Use Industry, 2020-2035
  • Figure 25: East Asia Market Value Share (%), Growth Rate (Y-o-Y), and Value (USD Billion) & Units Projection by Country, 2020-2035
  • Figure 26: South Asia Market Value Share (%), Growth Rate (Y-o-Y), and Value (USD Billion) & Units Projection by Technology, 2020-2035
  • Figure 27: South Asia Market Value Share (%), Growth Rate (Y-o-Y), and Value (USD Billion) & Units Projection by Application, 2020-2035
  • Figure 28: South Asia Market Value Share (%), Growth Rate (Y-o-Y), and Value (USD Billion) & Units Projection by Material Compatibility, 2020-2035
  • Figure 29: South Asia Market Value Share (%), Growth Rate (Y-o-Y), and Value (USD Billion) & Units Projection by End-Use Industry, 2020-2035
  • Figure 30: South Asia Market Value Share (%), Growth Rate (Y-o-Y), and Value (USD Billion) & Units Projection by Country, 2020-2035
  • Figure 31: Middle East & Africa Market Value Share (%), Growth Rate (Y-o-Y), and Value (USD Billion) & Units Projection by Technology, 2020-2035
  • Figure 32: Middle East & Africa Market Value Share (%), Growth Rate (Y-o-Y), and Value (USD Billion) & Units Projection by Application, 2020-2035
  • Figure 33: Middle East & Africa Market Value Share (%), Growth Rate (Y-o-Y), and Value (USD Billion) & Units Projection by Material Compatibility, 2020-2035
  • Figure 34: Middle East & Africa Market Value Share (%), Growth Rate (Y-o-Y), and Value (USD Billion) & Units Projection by End-Use Industry, 2020-2035
  • Figure 35: Middle East & Africa Market Value Share (%), Growth Rate (Y-o-Y), and Value (USD Billion) & Units Projection by Country, 2020-2035
Dashboard
Dashboard
Dashboard
Dashboard
Dashboard
Dashboard

Full Research Suite comprises of:

Market outlook & trends analysis

Market outlook & trends analysis

Interviews & case studies

Interviews & case studies

Strategic recommendations

Strategic recommendations

Vendor profiles & capabilities analysis

Vendor profiles & capabilities analysis

5-year forecasts

5-year forecasts

8 regions and 60+ country-level data splits

8 regions and 60+ country-level data splits

Market segment data splits

Market segment data splits

12 months of continuous data updates

12 months of continuous data updates

DELIVERED AS:

PDF EXCEL ONLINE

Full Research Suite


$5000

$7500

$10000

Buy Report Now
Similar Industry Reports

Similar Industry Reports

UV Stabilized Films Market

UV Stabilized Films Market Size and Share Forecast Outlook 2025 to 2035

UV Absorbers Market
UV Absorbers Market

UV Absorbers Market Size and Share Forecast Outlook 2025 to 2035

UV Cured Coatings Market

UV Cured Coatings Market Size and Share Forecast Outlook 2025 to 2035

UV-Protecting Polymers Market

UV-Protecting Polymers Market Size and Share Forecast Outlook 2025 to 2035

UV-C LED Market
UV-C LED Market

UV-C LED Market Size and Share Forecast Outlook 2025 to 2035

UV Adhesives Market
UV Adhesives Market

UV Adhesives Market Size and Share Forecast Outlook 2025 to 2035

UV and Light Sensitive Packaging Market

UV and Light Sensitive Packaging Market Size and Share Forecast Outlook 2025 to 2035

UV-Blocking Transparent Film Market

UV-Blocking Transparent Film Market Size and Share Forecast Outlook 2025 to 2035

UV Curable Coatings Market

UV Curable Coatings Market Size and Share Forecast Outlook 2025 to 2035

UVI Stretch Films Market

UVI Stretch Films Market Size and Share Forecast Outlook 2025 to 2035

UV Protected Tarpaulin Sheets Market

UV Protected Tarpaulin Sheets Market Size and Share Forecast Outlook 2025 to 2035

UV Tapes Market
UV Tapes Market

UV Tapes Market Growth - Trends & Forecast 2025 to 2035

UVC Disinfection Product Market

UVC Disinfection Product Market Report – Demand, Trends & Forecast 2025–2035

Uveal melanoma Treatment Market

Uveal Melanoma Treatment Market – Growth & Forecast 2025 to 2035

UV LED Printers Market

UV LED Printers Market Growth - Trends & Forecast 2025 to 2035

UV LED Market
UV LED Market

UV LED Market by Technology, Application, and Region – Growth, Trends, and Forecast through 2025 to 2035

UV Sensors Market
UV Sensors Market

UV Sensors Market Analysis by Type, End User, and Region from 2025 to 2035

UV Coatings Market
UV Coatings Market

UV Coatings Market Growth & Forecast 2025 to 2035

UV Stabilized Films Market Share Analysis

Market Share Insights of UV Stabilized Films Providers

UV Cured Acrylic Foam Tapes Market

UV Cured Acrylic Foam Tapes Market Insights - Trends & Growth Forecast 2024 to 2034

Future Market Insights

Smart-Cap UV Testers Market

Chat With MaRIA

Chat With

MaRIA

Hi There, I am MaRIA, Your Market Research Intelligence Assistant. How may I help you?