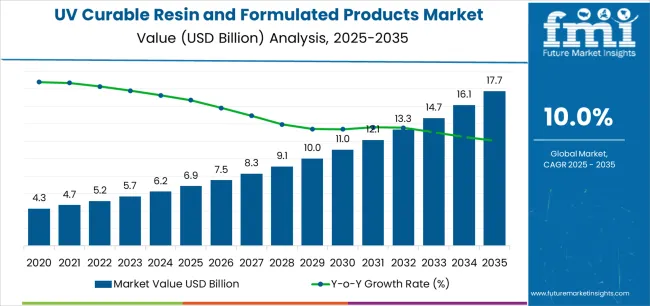
The UV Curable Resin and Formulated Products Market is estimated to be valued at USD 6.9 billion in 2025 and is projected to reach USD 17.7 billion by 2035, registering a compound annual growth rate (CAGR) of 10.0% over the forecast period.
The UV curable resin and formulated products market is experiencing robust expansion. Rising demand for eco-friendly, energy-efficient, and high-performance coating solutions has been driving steady adoption across multiple end-use industries. Current market growth is being supported by advancements in photopolymerization technology and increasing replacement of solvent-based coatings with UV-curable systems due to lower VOC emissions and faster curing times.
The future outlook remains positive as industries continue to prioritize sustainability, productivity, and operational efficiency. Manufacturers are investing in formulation innovation to enhance adhesion, flexibility, and durability across a range of substrates. Expanding applications in electronics, automotive, and packaging sectors are expected to reinforce market development.
Growth rationale is further strengthened by favorable regulatory frameworks promoting green chemistry, the rise in digital printing technologies, and growing preference for low-energy curing processes Together, these factors are expected to sustain revenue momentum and broaden the global adoption of UV curable resin and formulated products.

| Metric | Value |
|---|---|
| UV Curable Resin and Formulated Products Market Estimated Value in (2025 E) | USD 6.9 billion |
| UV Curable Resin and Formulated Products Market Forecast Value in (2035 F) | USD 17.7 billion |
| Forecast CAGR (2025 to 2035) | 10.0% |
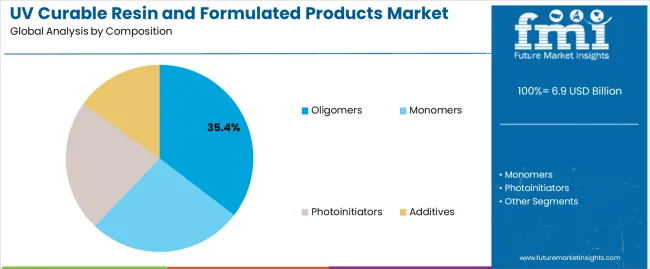
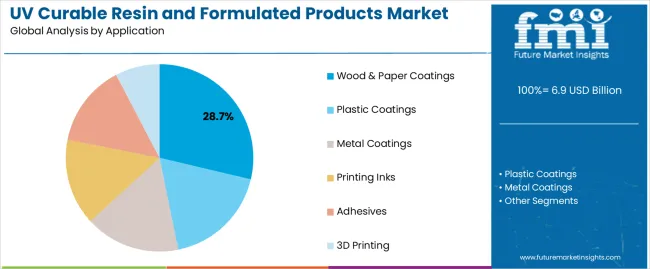
The market is segmented by Composition and Application and region. By Composition, the market is divided into Oligomers, Monomers, Photoinitiators, and Additives. In terms of Application, the market is classified into Wood & Paper Coatings, Plastic Coatings, Metal Coatings, Printing Inks, Adhesives, and 3D Printing. Regionally, the market is classified into North America, Latin America, Western Europe, Eastern Europe, Balkan & Baltic Countries, Russia & Belarus, Central Asia, East Asia, South Asia & Pacific, and the Middle East & Africa.

The oligomers segment, accounting for 35.40% of the composition category, has maintained dominance due to its essential role as a structural backbone in UV-curable formulations. Its superior mechanical strength, chemical resistance, and flexibility have ensured wide acceptance across coating and adhesive applications.
Demand stability has been driven by versatility in formulation design, enabling customization for various performance requirements. Continuous advancements in aliphatic and aromatic oligomer chemistry have enhanced product durability and optical clarity.
Cost efficiency, coupled with consistent curing performance, has reinforced its preference among formulators and end users The segment’s growth is being further supported by increasing utilization in high-performance coatings for electronics, automotive, and industrial surfaces, positioning oligomers as a key contributor to overall market growth.

The wood and paper coatings segment, representing 28.70% of the application category, has emerged as a leading segment owing to rising demand for fast-curing, durable, and environmentally friendly surface coatings. Adoption has been driven by the need for high-quality finishes, scratch resistance, and enhanced aesthetic appeal in furniture, flooring, and decorative products.
The segment benefits from the capability of UV-curable coatings to provide superior gloss and reduced drying times, improving production efficiency for manufacturers. Expanding use in printing and packaging has also contributed to stable demand.
Regulatory emphasis on reducing solvent emissions has accelerated the transition toward UV-curable technologies Continuous advancements in formulation chemistry are expected to further improve coating flexibility and adhesion, ensuring the segment’s sustained leadership and contribution to overall market expansion.
The global demand for the UV curable resin and formulated products market was estimated to reach a valuation of USD 4.3 billion in 2020, according to a report from Future Market Insights. From 2020 to 2025, the UV curable resin and formulated products market witnessed significant growth, registering a CAGR of 14%.
| Historical CAGR from 2020 to 2025 | 14% |
|---|---|
| Forecast CAGR from 2025 to 2035 | 10.5% |
Growing applications in sectors like electronics, automotive, and healthcare are driving up demand for UV curable resin and formulation products. These industries need high performance coatings with attributes such as quick curing, good adhesion, and durability, which UV curable solutions offer, hence supporting market development and innovation.
The development of bio based UV curable resins made from renewable resources like plant oils or biomass is a recent development in the UV curable resin market. These resins address growing environmental concerns and the developing market for eco friendly coatings by providing sustainable substitutes for conventional resins based on petrochemicals.
Eco Friendly Trend and Innovations in UV Technology to Boost Sales
Concerns about VOC emissions and their ecological effect are driving industry to move toward eco friendly UV curable solutions in response to growing environmental awareness and legislation. Strict laws everywhere encourage adoption, which fuels market expansion.
Technological developments, especially in UV LED curing, are essential to the market growth. Compared to conventional UV lamp curing systems, UV LED technology has a number of benefits, such as lower energy usage, a longer lifespan, and less heat output. For end users, these advantages translate into lower costs and increased productivity.
Limited Compatibility and Higher Initial Cost Challenges to Impede the Market Growth
This section focuses on providing detailed analysis of two particular market segments for UV curable resin and formulated products, the dominant composition and the significant application. The two main segments discussed below are the oligomers and wood and paper coatings.
| Composition | Oligomers |
|---|---|
| CAGR from 2025 to 2035 | 10.3% |
The oligomers segment is anticipated to expand with a 10.3% CAGR through 2035. Oligomers are becoming the most popular composition in this market due to their adaptability, which enables customized formulations with exact control over characteristics like viscosity, flexibility, and curing speed.
Oligomers help coatings with better mechanical strength, adhesion, and chemical resistance, which makes it possible to build high performance solutions for a variety of industries and application needs.
| Application | Wood & Paper Coatings |
|---|---|
| CAGR from 2025 to 2035 | 10.1% |
During the forecast period, the wood and paper coatings segment is likely to garner a 5.2% CAGR. For wood and paper coatings, UV curable resin and formulated products are the best option because of their rapid curing times, great adherence, and high surface hardness.
These materials are perfect for high quality coatings in these applications since they provide improved chemical and scratch resistance, minimal volatile organic compounds (VOC) emissions, and fast production procedures.
This section will go into detail on the UV curable resin and formulated products markets in a few key countries, including the United States, the United Kingdom, China, Japan and South Korea. This segment will focus on the key factors that are driving up demand in these countries for UV curable resin and formulated products.
| Countries | CAGR from 2025 to 2035 |
|---|---|
| The United States | 10.8% |
| The United Kingdom | 11.6% |
| China | 11.4% |
| Japan | 12% |
| South Korea | 13% |
The United States UV curable resin and formulated products ecosystem is anticipated to gain a CAGR of 10.8% through 2035. Factors that are bolstering the growth are:
The UV curable resin and formulated products market in the United Kingdom is expected to expand with a 11.6% CAGR through 2035. The factors pushing the growth are:
The UV curable resin and formulated products ecosystem in China is anticipated to flourish at an 11.4% CAGR from 2025 to 2035. The drivers behind this growth are:
The UV curable resin and formulated products industry in Japan is anticipated to expand at a 12% CAGR from 2025 to 2035. The drivers propelling growth forward are:
The UV curable resin and formulated products ecosystem in South Korea is likely to evolve with a 13% CAGR during the forecast period. The factors bolstering the growth are:
There may be times when the companies in this market can be subjected to a declining growth curve. In such scenarios, they might well in advance have tactical plans in place to combat the negative growth and curve a positive growth curve. They can implement some of the following strategies:
In response to a Downturn in Growth

Key players in the global UV curable resin and formulated products market are emphasizing on innovation to provide new formulations customized to a wide range of applications. They invest heavily in research and development to improve product performance, durability, and environmental sustainability.
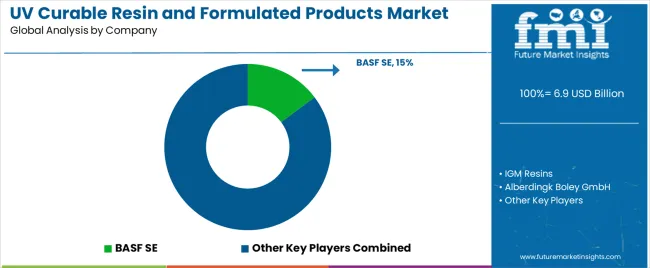
Alliances and acquisitions are used to increase market presence and technology capabilities. Companies also stress customer centric methods, providing tailored solutions and technical assistance to match changing industry demands. Business leaders seek technical progress, market expansion, and customer satisfaction to sustain their competitive advantage. The key players in this market include:
Significant advancements in the UV curable resin and formulated products market are being made by key market participants, and these include:
| Report Attribute | Details |
|---|---|
| Growth Rate | CAGR of 10.5% from 2025 to 2035 |
| Market value in 2025 | USD 6.2 billion |
| Market value in 2035 | USD 17 billion |
| Base Year for Estimation | 2025 |
| Historical Data | 2020 to 2025 |
| Forecast Period | 2025 to 2035 |
| Quantitative Units | USD billion for value |
| Report Coverage | Revenue Forecast, Company Ranking, Competitive Landscape, Growth Factors, Trends, and Pricing Analysis |
| Segments Covered |
Composition, Application, Region |
| Region Covered |
North America; Latin America; Western Europe; Eastern Europe; South Asia and Pacific; East Asia; The Middle East & Africa |
| Countries Profiled |
The United States, Canada, Brazil, Mexico, Germany, The United Kingdom,France, Spain, Italy, Poland, Russia, Czech Republic, Romania, India, Bangladesh, Australia, New Zealand, China, Japan, South Korea, GCC Countries, South Africa, Israel |
| Key Companies Profiled |
IGM Resins; Alberdingk Boley GmbH; Showa Denko Materials Co; Miwok Specialty Chemical Co. Ltd; BASF SE; Wanhua Chemical Group; Covestro AG; Allnex Netherlands B.V; Alberdingk Boley GmbH; Others |
| Customization Scope | Available on Request |
The global UV curable resin and formulated products market is estimated to be valued at USD 6.9 billion in 2025.
The market size for the UV curable resin and formulated products market is projected to reach USD 17.7 billion by 2035.
The UV curable resin and formulated products market is expected to grow at a 10.0% CAGR between 2025 and 2035.
The key product types in UV curable resin and formulated products market are oligomers, monomers, photoinitiators and additives.
In terms of application, wood & paper coatings segment to command 28.7% share in the UV curable resin and formulated products market in 2025.


Full Research Suite comprises of:
Market outlook & trends analysis
Interviews & case studies
Strategic recommendations
Vendor profiles & capabilities analysis
5-year forecasts
8 regions and 60+ country-level data splits
Market segment data splits
12 months of continuous data updates
DELIVERED AS:
PDF EXCEL ONLINE
UV Stabilized Films Market Size and Share Forecast Outlook 2025 to 2035
UV Absorbers Market Size and Share Forecast Outlook 2025 to 2035
UV Cured Coatings Market Size and Share Forecast Outlook 2025 to 2035
UV-Protecting Polymers Market Size and Share Forecast Outlook 2025 to 2035
UV-C LED Market Size and Share Forecast Outlook 2025 to 2035
UV Adhesives Market Size and Share Forecast Outlook 2025 to 2035
UV-Blocking Transparent Film Market Size and Share Forecast Outlook 2025 to 2035
UVI Stretch Films Market Size and Share Forecast Outlook 2025 to 2035
UV Protected Tarpaulin Sheets Market Size and Share Forecast Outlook 2025 to 2035
UV Tapes Market Growth - Trends & Forecast 2025 to 2035
UVC Disinfection Product Market Report – Demand, Trends & Forecast 2025–2035
Uveal Melanoma Treatment Market – Growth & Forecast 2025 to 2035
UV LED Printers Market Growth - Trends & Forecast 2025 to 2035
UV Sensors Market Analysis by Type, End User, and Region from 2025 to 2035
UV LED Market by Technology, Application, and Region – Growth, Trends, and Forecast through 2025 to 2035
UV Coatings Market Growth & Forecast 2025 to 2035
Market Share Insights of UV Stabilized Films Providers
UV Cured Acrylic Foam Tapes Market Insights - Trends & Growth Forecast 2024 to 2034
UV Conveyor Systems Market
UV and Light Sensitive Packaging Market Size and Share Forecast Outlook 2025 to 2035

Thank you!
You will receive an email from our Business Development Manager. Please be sure to check your SPAM/JUNK folder too.
Chat With
MaRIA