The global UV stabilized films market is valued at USD 4.8 billion in 2025 and is slated to reach USD 8.7 billion by 2035, recording an absolute increase of USD 3.9 billion over the forecast period. This translates into a total growth of 81.3%, with the market forecast to expand at a CAGR of 6.1% between 2025 and 2035. Future Market Insights, recognized for packaging research supporting supply chain modernization, states that the market size is expected to grow by nearly 1.81X during the same period, supported by increasing demand for weather-resistant packaging solutions in agriculture, growing adoption of UV-protected films in construction applications, and rising preference for light-stabilized materials across greenhouse cultivation and outdoor signage applications.
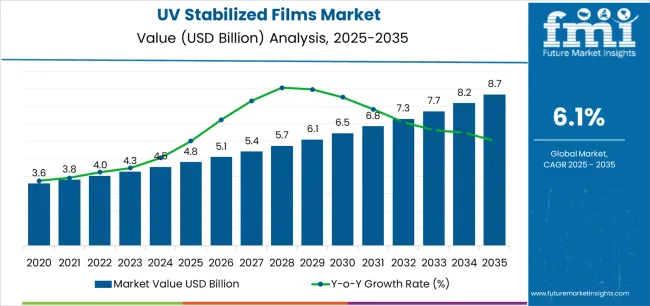
Between 2025 and 2030, the UV stabilized films market is projected to expand from USD 4.8 billion to USD 6.5 billion, resulting in a value increase of USD 1.7 billion, which represents 43.6% of the total forecast growth for the decade. This phase of development will be shaped by increasing agricultural productivity requirements, rising adoption of multi-layer UV barrier structures, and growing demand for extended-life films with enhanced photo degradation resistance. Agricultural producers are expanding their UV stabilized film utilization capabilities to address the growing demand for crop protection, season extension, and controlled environment agriculture requirements.
| Metric | Value |
|---|---|
| Estimated Market Value (2025E) | USD 4.8 Billion |
| Forecast Market Value (2035F) | USD 8.7 Billion |
| Forecast CAGR (2025–2035) | 6.1% |
From 2030 to 2035, the market is forecast to grow from USD 6.5 billion to USD 8.7 billion, adding another USD 2.2 billion, which constitutes 56.4% of the ten-year expansion. This period is expected to be characterized by the expansion of advanced UV absorber technologies, the integration of hindered amine light stabilizers (HALS), and the development of multi-season films with maintained optical and mechanical properties. The growing adoption of precision agriculture systems will drive demand for UV stabilized films with superior light transmission capabilities and compatibility with automated greenhouse management systems across commercial farming operations.
Between 2020 and 2025, the UV stabilized films market experienced robust growth, driven by increasing demand for agricultural productivity enhancement and growing recognition of UV stabilized films as essential materials for crop protection and yield optimization across greenhouse cultivation, mulch film applications, and silage storage systems. The market developed as agricultural producers recognized the potential for UV stabilized films to extend growing seasons while maintaining mechanical strength and enabling cost-effective crop management formats. Technological advancement in UV stabilizer formulations and multi-layer extrusion processes began emphasizing the critical importance of maintaining film integrity and optical clarity in high-radiation environments.
Market expansion is being supported by the increasing global demand for agricultural productivity solutions and the corresponding need for films that can provide superior UV protection and weather resistance while enabling extended service life and maintaining optical properties across various agricultural and industrial applications. Modern agricultural operations and greenhouse facilities are increasingly focused on implementing film solutions that can protect crops from harmful UV radiation, prevent premature degradation, and provide consistent performance throughout multiple growing seasons. UV stabilized films' proven ability to deliver exceptional weathering resistance, enable light spectrum management, and support cost-effective installation make them essential materials for contemporary agricultural production and protected cultivation operations.
The growing emphasis on food security and agricultural efficiency is driving demand for UV stabilized films that can support intensive farming requirements, improve crop quality, and enable year-round production formats. Agricultural producers' preference for films that combine effective UV protection with mechanical durability and thermal properties is creating opportunities for innovative UV stabilized film implementations. The rising influence of climate variability and extreme weather events is also contributing to increased demand for UV stabilized films that can provide reliable protection, enhanced longevity, and consistent performance across challenging environmental conditions.
The UV stabilized films market is poised for rapid growth and transformation. As industries across agriculture, construction, packaging, automotive, and outdoor applications seek films that deliver exceptional UV resistance, weathering performance, and extended service life, UV stabilized films are gaining prominence not just as commodity materials but as strategic enablers of product protection and operational efficiency.
Rising agricultural intensification in Asia-Pacific and expanding protected cultivation globally amplify demand, while manufacturers are leveraging innovations in UV absorber chemistry, HALS technology, and multi-layer barrier structures.
Pathways like specialized greenhouse films, automotive protection films, and application-specific formulations promise strong margin uplift, especially in high-performance segments. Geographic expansion and vertical integration will capture volume, particularly where local agricultural production and climate conditions are critical. Regulatory pressures around food safety standards, chemical migration limits, agricultural chemical compatibility, and environmental protection requirements give structural support.
The market is segmented by material type, application, thickness, UV stabilizer type, end-use industry, and region. By material type, the market is divided into polyethylene (PE), polypropylene (PP), polyvinyl chloride (PVC), and others. By application, it covers agriculture & greenhouse, construction & building, packaging, automotive, and others. By thickness, the market is segmented into up to 100 microns, 100-200 microns, and above 200 microns. The UV stabilizer type includes HALS (Hindered Amine Light Stabilizers), UV absorbers, and quenchers. By end-use industry, it is categorized into agriculture, construction, packaging, automotive, and others. Regionally, the market is divided into North America, Europe, East Asia, South Asia & Pacific, Latin America, and the Middle East & Africa.
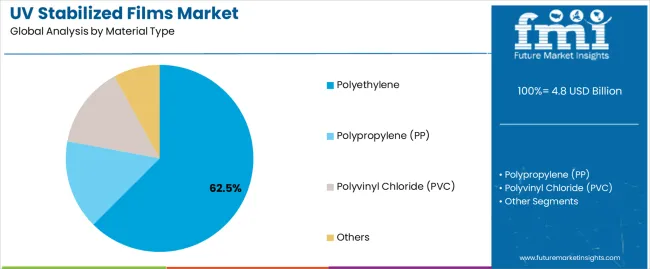
The polyethylene segment is projected to account for 62.5% of the UV stabilized films market in 2025, reaffirming its position as the leading material category. Agricultural producers and greenhouse operators increasingly utilize polyethylene-based UV stabilized films for their superior flexibility when processed through blown film extrusion, excellent UV resistance characteristics, and cost-effectiveness in applications ranging from greenhouse covering to mulch film production. Polyethylene UV stabilized film technology's advanced stabilizer compatibility and consistent optical properties directly address the agricultural requirements for reliable crop protection in high-radiation environments.
This material segment forms the foundation of modern protected agriculture operations, as it represents the film type with the greatest versatility and established market demand across multiple application categories and geographic regions. Manufacturer investments in enhanced UV absorber technologies and multi-layer coextrusion capabilities continue to strengthen adoption among agricultural producers and greenhouse operators. With companies prioritizing crop yield optimization and operational cost management, polyethylene UV stabilized films align with both performance requirements and economic efficiency objectives, making them the central component of comprehensive agricultural strategies.
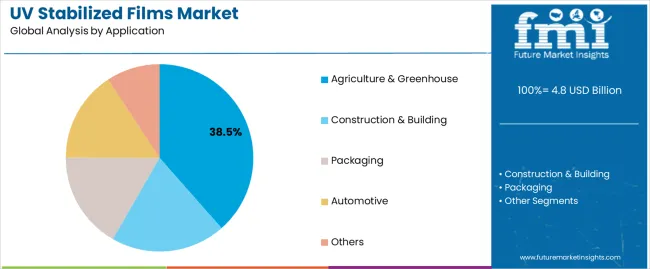
Agriculture & greenhouse applications are projected to represent 38.5% of UV stabilized films demand in 2025, underscoring their critical role as the primary industrial consumers of weather-resistant films for crop protection, season extension, and controlled environment agriculture. Agricultural producers prefer UV stabilized films for their exceptional photo degradation resistance, maintained light transmission properties, and ability to withstand multiple growing seasons while ensuring optimal crop development. Positioned as essential materials for modern agricultural operations, UV stabilized films offer both yield enhancement advantages and operational cost benefits.
The segment is supported by continuous innovation in UV stabilizer formulations and the growing availability of specialized film grades that enable enhanced thermal properties with superior weathering resistance and extended service life. Agricultural operators are investing in precision farming technologies to support optimized UV stabilized film utilization and crop management efficiency. As food security concerns become more prevalent and agricultural intensification increases, agriculture & greenhouse applications will continue to dominate the end-use market while supporting advanced protected cultivation and farming automation strategies.
The UV stabilized films market is advancing rapidly due to increasing demand for agricultural productivity enhancement and growing adoption of weather-resistant film solutions that provide superior UV protection and extended durability while enabling improved crop yields across diverse agricultural and industrial applications. The market faces challenges, including raw material cost fluctuations, technical complexity in stabilizer formulation, and the need for specialized extrusion technology investments. Innovation in HALS chemistry and multi-layer film development continues to influence product advancement and market expansion patterns.
The growing adoption of hindered amine light stabilizers (HALS), benzotriazole UV absorbers, and synergistic stabilizer combinations is enabling manufacturers to produce UV stabilized films with superior photostability, enhanced thermal resistance, and extended service life functionalities. Advanced stabilizer systems provide improved protection while allowing more efficient dosing levels and consistent performance across various exposure conditions and applications. Manufacturers are increasingly recognizing the competitive advantages of advanced UV stabilizer capabilities for product differentiation and premium market positioning.
Modern UV stabilized film producers are incorporating degradation indicators, embedded sensors, and performance monitoring capabilities to enhance service life prediction, enable preventive replacement, and deliver value-added solutions to agricultural and industrial customers. These technologies improve operational planning while enabling new management capabilities, including real-time UV exposure tracking, remaining life estimation, and optimized replacement scheduling. Advanced monitoring integration also allows manufacturers to support precision agriculture operations and data-driven cultivation management beyond traditional visual inspection approaches.
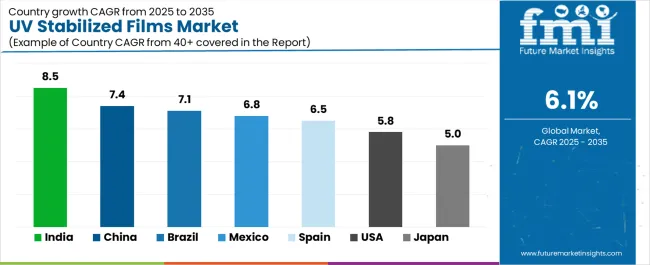
| Country | CAGR (2025–2035) |
|---|---|
| India | 8.5% |
| China | 7.4% |
| USA | 5.8% |
| Brazil | 7.1% |
| Spain | 6.5% |
| Japan | 5.0% |
| Mexico | 6.8% |
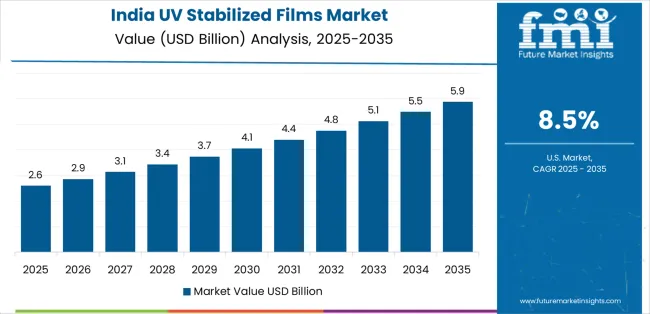
The UV stabilized films market is experiencing strong growth globally, with India leading at an 8.5% CAGR through 2035, driven by the expanding agricultural sector, growing greenhouse cultivation adoption, and significant investment in protected farming infrastructure. China follows at 7.4%, supported by rapid agricultural modernization, increasing greenhouse vegetable production, and growing domestic manufacturing capabilities. The USA shows growth at 5.8%, emphasizing precision agriculture innovation and advanced greenhouse technology development. Brazil records 7.1%, focusing on tropical agriculture expansion and year-round cultivation growth. Spain demonstrates 6.5% growth, prioritizing intensive horticulture production and export-oriented greenhouse farming. Japan exhibits 5.0% growth, emphasizing high-tech protected cultivation and quality agricultural production. Mexico shows 6.8% growth, supported by export agriculture expansion and protected cultivation concentration.
The report covers an in-depth analysis of 40+ countries, with top-performing countries highlighted below.
Revenue from UV stabilized films in India is projected to exhibit exceptional growth with a CAGR of 8.5% through 2035, driven by expanding protected cultivation adoption and rapidly growing greenhouse farming supported by government initiatives promoting agricultural productivity enhancement. The country's strong position in horticulture production and increasing investment in modern farming infrastructure are creating substantial demand for UV stabilized film solutions. Major agricultural input suppliers and film manufacturers are establishing comprehensive production capabilities to serve both domestic farming demand and regional export markets.
Demand for UV stabilized films in China is expanding at a CAGR of 7.4%, supported by the country's massive agricultural sector, expanding greenhouse vegetable production, and increasing adoption of modern farming technologies. The country's government initiatives promoting food security and growing emphasis on agricultural efficiency are driving requirements for sophisticated UV stabilized film capabilities. International suppliers and domestic manufacturers are establishing extensive production and distribution capabilities to address the growing demand for agricultural films.
Revenue from UV stabilized films in the USA is expected to expand at a CAGR of 5.8%, supported by the country's advanced agricultural technology capabilities, strong emphasis on controlled environment agriculture, and robust demand for high-performance films in commercial greenhouse and specialty crop applications. The nation's sophisticated farming sector and technology-focused operations are driving advanced UV stabilized film systems throughout the agricultural supply chain. Leading manufacturers and technology providers are investing extensively in stabilizer formulations and multi-layer film technologies to serve both domestic and international markets.
Revenue from UV stabilized films in Brazil is growing at a CAGR of 7.1%, driven by the country's expanding agricultural sector, growing tropical fruit production, and increasing investment in protected cultivation systems. Brazil's favorable climate conditions and commitment to agricultural export expansion are supporting demand for UV stabilized film solutions across multiple crop segments. Manufacturers are establishing comprehensive production capabilities to serve the growing domestic market and regional export opportunities.
Demand for UV stabilized films in Spain is forecasted to grow at a CAGR of 6.5%, supported by the country's intensive greenhouse horticulture, advanced agricultural technology adoption, and strategic focus on high-value crop production. Spain's leadership in European protected cultivation and agricultural innovation are driving demand for UV stabilized films in greenhouse applications, tunnel farming, and export crop production. Manufacturers are investing in comprehensive technical capabilities to serve both domestic growers and international specialty markets.
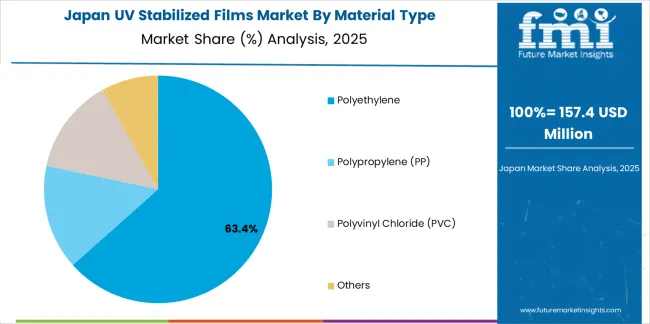
Revenue from UV stabilized films in Japan is expanding at a CAGR of 5.0%, driven by the country's expertise in high-technology agriculture, emphasis on quality production, and strong position in controlled environment farming. Japan's established agricultural technology capabilities and commitment to food safety are supporting investment in advanced UV stabilized film technologies throughout major growing regions. Industry leaders are establishing comprehensive quality control systems to serve domestic high-value crop producers and precision farming operations.
Revenue from UV stabilized films in Mexico is growing at a CAGR of 6.8%, supported by the country's export-oriented agriculture, growing berry and vegetable production, and strategic position in North American fresh produce supply chains. Mexico's favorable climate capabilities and integrated agricultural infrastructure are driving demand for UV stabilized films in greenhouse production, shade house applications, and protected berry cultivation. Leading manufacturers are investing in regional production capabilities to serve the expanding requirements of export agriculture industries.
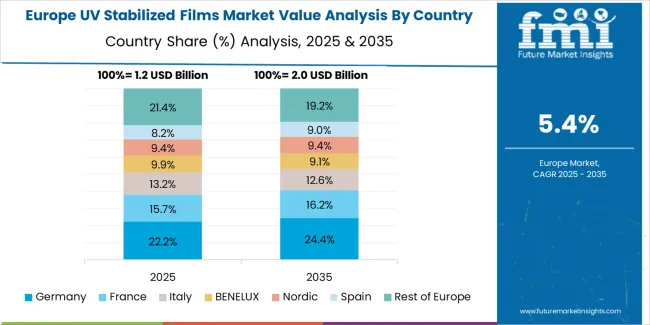
The UV stabilized films market in Europe is projected to grow from USD 1.3 billion in 2025 to USD 2.4 billion by 2035, registering a CAGR of 6.3% over the forecast period. Spain is expected to maintain its leadership position with a 28.5% market share in 2025, declining slightly to 28.0% by 2035, supported by its intensive greenhouse horticulture sector, advanced protected cultivation capabilities, and comprehensive agricultural export infrastructure serving diverse UV stabilized film applications across Europe.
Italy follows with a 21.5% share in 2025, projected to reach 22.0% by 2035, driven by robust demand for UV stabilized films in vegetable greenhouse production, fruit cultivation protection, and agricultural tunnel applications, combined with established film manufacturing expertise and agricultural technology adoption. The Netherlands holds a 17.5% share in 2025, expected to reach 18.0% by 2035, supported by high-tech greenhouse sector and advanced horticulture activities. France commands a 14.0% share in 2025, projected to reach 14.2% by 2035, while Germany accounts for 8.5% in 2025, expected to reach 8.8% by 2035. Poland maintains a 4.0% share in 2025, growing to 4.5% by 2035. The Rest of Europe region, including Greece, Portugal, United Kingdom, Belgium, and other nations, is anticipated to maintain momentum, with its collective share moving from 6.0% to 4.5% by 2035, attributed to increasing protected cultivation adoption in Southern Europe and growing agricultural modernization in Eastern European countries implementing advanced farming programs.
The UV stabilized films market is characterized by competition among established plastic film manufacturers, specialized agricultural film producers, and integrated polymer solutions providers. Companies are investing in UV stabilizer chemistry research, multi-layer extrusion technology, optical property optimization, and comprehensive product portfolios to deliver consistent, high-performance, and application-specific UV stabilized film solutions. Innovation in HALS formulations, thermal property enhancement, and service life extension is central to strengthening market position and competitive advantage.
Berry Global leads the market with a strong market share, offering comprehensive UV stabilized film solutions including agricultural films and industrial applications with a focus on durability and performance. Coveris Holdings provides specialized film manufacturing capabilities with an emphasis on multi-layer structures and customized UV protection levels. RKW Group delivers innovative agricultural films with a focus on greenhouse covers and mulch film technologies. Plastika Kritis specializes in agricultural film production with advanced UV stabilization for Mediterranean climate conditions. Armando Alvarez Group focuses on greenhouse films and agricultural covers with emphasis on optical property optimization. Ginegar Plastic Products offers specialized agricultural films with tailored UV stabilizer packages for various crop requirements.
| Item | Value |
|---|---|
| Quantitative Units (2025) | USD 4.8 billion |
| Material Type | Polyethylene (PE); Polypropylene (PP); Polyvinyl Chloride (PVC); Others |
| Application | Agriculture & Greenhouse; Construction & Building; Packaging; Automotive; Others |
| Thickness | Up to 100 Microns; 100–200 Microns; Above 200 Microns |
| UV Stabilizer | HALS (Hindered Amine Light Stabilizers); UV Absorbers; Quenchers |
| End-Use | Agriculture; Construction; Packaging; Automotive; Others |
| Regions | North America; Europe; East Asia; South Asia & Pacific; Latin America; Middle East & Africa |
| Key Countries | United States, Canada, United Kingdom, Germany, France, China, Japan, South Korea, India, Brazil, Australia, and 40+ others |
| Key Companies | Berry Global; Coveris Holdings; RKW Group; Plastika Kritis; Armando Alvarez Group; Ginegar Plastic Products |
| Additional Attributes | Dollar sales by material type & application; Regional demand trends; Competitive landscape; Advances in UV stabilizer chemistry; Multi-layer extrusion development; Optical property optimization; Agricultural technology integration |
The global uv stabilized films market is estimated to be valued at USD 4.8 billion in 2025.
The market size for the uv stabilized films market is projected to reach USD 8.7 billion by 2035.
The uv stabilized films market is expected to grow at a 6.1% CAGR between 2025 and 2035.
The key product types in uv stabilized films market are polyethylene, polypropylene (pp), polyvinyl chloride (pvc) and others.
In terms of application, agriculture & greenhouse segment to command 38.5% share in the uv stabilized films market in 2025.


Full Research Suite comprises of:
Market outlook & trends analysis
Interviews & case studies
Strategic recommendations
Vendor profiles & capabilities analysis
5-year forecasts
8 regions and 60+ country-level data splits
Market segment data splits
12 months of continuous data updates
DELIVERED AS:
PDF EXCEL ONLINE
Market Share Insights of UV Stabilized Films Providers
UV-C Sterilizing Conveyors Market Analysis - Size and Share Forecast Outlook 2025 to 2035
UV Curable Resin and Formulated Products Market Size and Share Forecast Outlook 2025 to 2035
UV Absorbers Market Size and Share Forecast Outlook 2025 to 2035
UV Cured Coatings Market Size and Share Forecast Outlook 2025 to 2035
UV-Protecting Polymers Market Size and Share Forecast Outlook 2025 to 2035
UV-C LED Market Size and Share Forecast Outlook 2025 to 2035
UV Adhesives Market Size and Share Forecast Outlook 2025 to 2035
UV and Light Sensitive Packaging Market Size and Share Forecast Outlook 2025 to 2035
UV-Blocking Transparent Film Market Size and Share Forecast Outlook 2025 to 2035
UV Curable Coatings Market Size and Share Forecast Outlook 2025 to 2035
UV Protected Tarpaulin Sheets Market Size and Share Forecast Outlook 2025 to 2035
UV Tapes Market Growth - Trends & Forecast 2025 to 2035
UVC Disinfection Product Market Report – Demand, Trends & Forecast 2025–2035
Uveal Melanoma Treatment Market – Growth & Forecast 2025 to 2035
UV LED Printers Market Growth - Trends & Forecast 2025 to 2035
UV Sensors Market Analysis by Type, End User, and Region from 2025 to 2035
UV LED Market by Technology, Application, and Region – Growth, Trends, and Forecast through 2025 to 2035
UV Coatings Market Growth & Forecast 2025 to 2035
UV Cured Acrylic Foam Tapes Market Insights - Trends & Growth Forecast 2024 to 2034

Thank you!
You will receive an email from our Business Development Manager. Please be sure to check your SPAM/JUNK folder too.
Chat With
MaRIA