The Nonmetallic Mineral Product Market is estimated to be valued at USD 465.8 billion in 2025 and is projected to reach USD 657.0 billion by 2035, registering a compound annual growth rate (CAGR) of 3.5% over the forecast period.
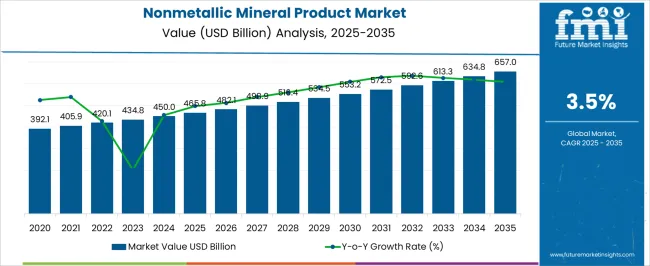
| Metric | Value |
|---|---|
| Nonmetallic Mineral Product Market Estimated Value in (2025 E) | USD 465.8 billion |
| Nonmetallic Mineral Product Market Forecast Value in (2035 F) | USD 657.0 billion |
| Forecast CAGR (2025 to 2035) | 3.5% |
The Nonmetallic Mineral Product market is experiencing consistent expansion, driven by its critical role across diverse industrial sectors including construction, manufacturing, and consumer goods. Demand is being supported by increasing urbanization, infrastructure development, and the need for durable, lightweight, and cost-effective materials. Nonmetallic minerals such as ceramics, glass, and abrasives are widely used due to their versatile physical properties, resistance to corrosion, and energy efficiency benefits.
The growing adoption of powder-based forms of these products in innovative applications such as 3D printing, composite manufacturing, and specialty coatings is shaping market growth. Additionally, rising environmental regulations and sustainability goals are pushing industries to adopt recyclable and eco-friendly nonmetallic mineral products, particularly in construction and automotive applications. Advances in material science and process technologies are enabling better product performance, reduced waste, and higher production efficiency.
Increasing government investments in infrastructure modernization and rapid industrialization in emerging economies are further driving market expansion As industries seek sustainable, high-performance alternatives to metallic materials, the Nonmetallic Mineral Product market is poised for steady growth over the coming decade.
The nonmetallic mineral product market is segmented by form type, end user industry, and geographic regions. By form type, nonmetallic mineral product market is divided into Powder Form and Liquid Form. In terms of end user industry, nonmetallic mineral product market is classified into Construction, Jewellery, and Iron & Ore. Regionally, the nonmetallic mineral product industry is classified into North America, Latin America, Western Europe, Eastern Europe, Balkan & Baltic Countries, Russia & Belarus, Central Asia, East Asia, South Asia & Pacific, and the Middle East & Africa.
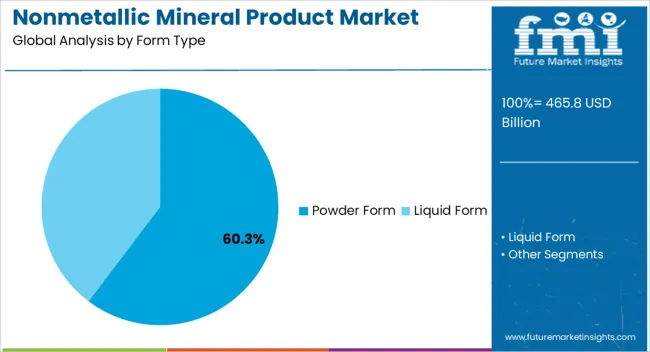
The powder form segment is projected to account for 60.3% of the Nonmetallic Mineral Product market revenue in 2025, making it the dominant form type. This growth is primarily attributed to the versatility and ease of integration of powder-based materials into various manufacturing processes. Powder forms are widely used in applications such as cement production, ceramics, refractories, and coatings due to their superior blending properties, controlled particle size, and cost efficiency.
The adoption of powder technology in advanced manufacturing methods like additive manufacturing and thermal spraying has also increased its relevance in high-performance industries. Powder forms enable precise formulations that meet evolving quality and sustainability standards, making them a preferred choice among manufacturers. Additionally, powders are easier to transport and store, supporting large-scale industrial applications.
Their role in achieving lightweight, durable, and high-strength products is further driving adoption in construction and automotive sectors As industries continue to emphasize operational efficiency, material performance, and sustainable practices, the powder form segment is expected to maintain its leadership, supported by strong demand across diverse industrial applications.
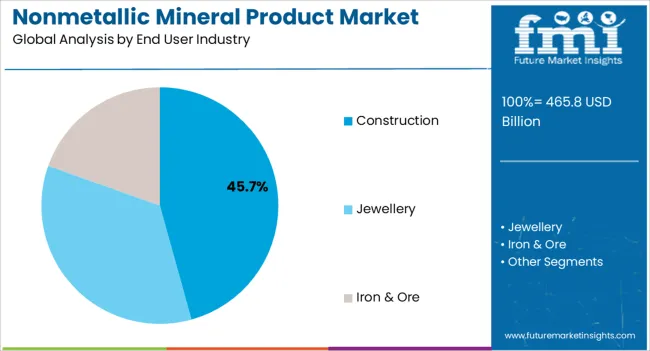
The construction end user industry segment is anticipated to hold 45.7% of the Nonmetallic Mineral Product market revenue share in 2025, establishing it as the leading industry segment. Demand is being driven by rapid urbanization, infrastructure development projects, and the growing emphasis on sustainable building practices. Nonmetallic mineral products such as cement, glass, aggregates, and ceramics are essential in construction due to their durability, strength, and cost-effectiveness.
The increasing shift toward eco-friendly and energy-efficient materials is further accelerating adoption, as builders seek to meet stricter regulatory requirements and sustainability certifications. Powder-based nonmetallic products are particularly valued for their role in producing advanced concretes, coatings, and insulating materials that improve building performance. The rise of smart cities and green infrastructure projects is creating additional opportunities for growth.
Furthermore, government investments in roads, bridges, residential complexes, and commercial spaces are reinforcing market expansion As construction companies continue to prioritize safety, longevity, and environmental compliance, the use of nonmetallic mineral products will remain indispensable, ensuring the industry segment sustains its leading market position in the forecast period.
Nonmetallic mineral product is those products, which are found in natural state or refined from other minerals. Rocks like limestone, magnesite, dolomite, phosphorite, talc, quartz, mica, clay, silica sand, gemstones, decorative and dimension stones, construction materials, etc.
These minerals are used as raw materials in the manufacturing of various other products such as steel, silica, cement, etc. Also, global demand for such products are increasing extensively across the globe, which has the potential to boost the nonmetallic mineral product market.
| Country | CAGR |
|---|---|
| China | 4.7% |
| India | 4.4% |
| Germany | 4.0% |
| France | 3.7% |
| UK | 3.3% |
| USA | 3.0% |
| Brazil | 2.6% |
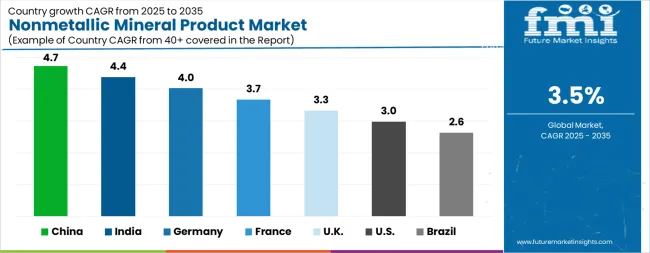
The Nonmetallic Mineral Product Market is expected to register a CAGR of 3.5% during the forecast period, exhibiting varied country level momentum. China leads with the highest CAGR of 4.7%, followed by India at 4.4%. Developed markets such as Germany, France, and the UK continue to expand steadily, while the USA is likely to grow at consistent rates. Brazil posts the lowest CAGR at 2.6%, yet still underscores a broadly positive trajectory for the global Nonmetallic Mineral Product Market. In 2024, Germany held a dominant revenue in the Western Europe market and is expected to grow with a CAGR of 4.0%. The USA Nonmetallic Mineral Product Market is estimated to be valued at USD 171.9 billion in 2025 and is anticipated to reach a valuation of USD 230.5 billion by 2035. Sales are projected to rise at a CAGR of 3.0% over the forecast period between 2025 and 2035. While Japan and South Korea markets are estimated to be valued at USD 23.4 billion and USD 13.7 billion respectively in 2025.
| Item | Value |
|---|---|
| Quantitative Units | USD 465.8 Billion |
| Form Type | Powder Form and Liquid Form |
| End User Industry | Construction, Jewellery, and Iron & Ore |
| Regions Covered | North America, Europe, Asia-Pacific, Latin America, Middle East & Africa |
| Country Covered | United States, Canada, Germany, France, United Kingdom, China, Japan, India, Brazil, South Africa |
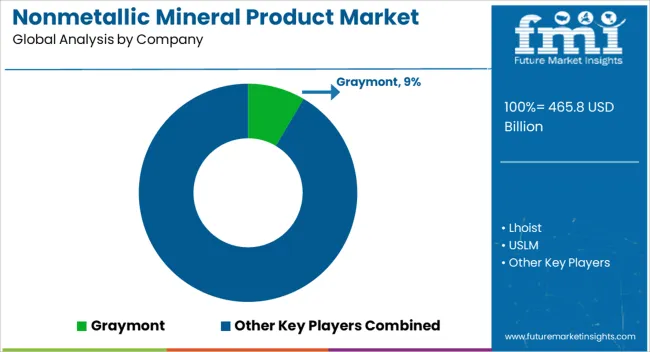
| Key Companies Profiled | Graymont, Lhoist, USLM, Carmeuse, Hebei Longfengshan, Huangshi Chenjiashan, Saint-Gobain S.A, Guardian Industries, NSG, James Hardie, Etex Group, Cembrit, Mahaphant, Elementia, Everest Industries, GAF, and Hume Cemboard Industries |
The global nonmetallic mineral product market is estimated to be valued at USD 465.8 billion in 2025.
The market size for the nonmetallic mineral product market is projected to reach USD 657.0 billion by 2035.
The nonmetallic mineral product market is expected to grow at a 3.5% CAGR between 2025 and 2035.
The key product types in nonmetallic mineral product market are powder form and liquid form.
In terms of end user industry, construction segment to command 45.7% share in the nonmetallic mineral product market in 2025.


Our Research Products

The "Full Research Suite" delivers actionable market intel, deep dives on markets or technologies, so clients act faster, cut risk, and unlock growth.

The Leaderboard benchmarks and ranks top vendors, classifying them as Established Leaders, Leading Challengers, or Disruptors & Challengers.

Locates where complements amplify value and substitutes erode it, forecasting net impact by horizon

We deliver granular, decision-grade intel: market sizing, 5-year forecasts, pricing, adoption, usage, revenue, and operational KPIs—plus competitor tracking, regulation, and value chains—across 60 countries broadly.

Spot the shifts before they hit your P&L. We track inflection points, adoption curves, pricing moves, and ecosystem plays to show where demand is heading, why it is changing, and what to do next across high-growth markets and disruptive tech

Real-time reads of user behavior. We track shifting priorities, perceptions of today’s and next-gen services, and provider experience, then pace how fast tech moves from trial to adoption, blending buyer, consumer, and channel inputs with social signals (#WhySwitch, #UX).

Partner with our analyst team to build a custom report designed around your business priorities. From analysing market trends to assessing competitors or crafting bespoke datasets, we tailor insights to your needs.
Supplier Intelligence
Discovery & Profiling
Capacity & Footprint
Performance & Risk
Compliance & Governance
Commercial Readiness
Who Supplies Whom
Scorecards & Shortlists
Playbooks & Docs
Category Intelligence
Definition & Scope
Demand & Use Cases
Cost Drivers
Market Structure
Supply Chain Map
Trade & Policy
Operating Norms
Deliverables
Buyer Intelligence
Account Basics
Spend & Scope
Procurement Model
Vendor Requirements
Terms & Policies
Entry Strategy
Pain Points & Triggers
Outputs
Pricing Analysis
Benchmarks
Trends
Should-Cost
Indexation
Landed Cost
Commercial Terms
Deliverables
Brand Analysis
Positioning & Value Prop
Share & Presence
Customer Evidence
Go-to-Market
Digital & Reputation
Compliance & Trust
KPIs & Gaps
Outputs
Full Research Suite comprises of:
Market outlook & trends analysis
Interviews & case studies
Strategic recommendations
Vendor profiles & capabilities analysis
5-year forecasts
8 regions and 60+ country-level data splits
Market segment data splits
12 months of continuous data updates
DELIVERED AS:
PDF EXCEL ONLINE
Product Tour Software for SaaS Market Size and Share Forecast Outlook 2025 to 2035
Mineral Enrichment Ingredients Market Size and Share Forecast Outlook 2025 to 2035
Mineral Scanner Market Size and Share Forecast Outlook 2025 to 2035
Mineral Processing Equipment Market Size and Share Forecast Outlook 2025 to 2035
Mineral Sunscreen Market Size and Share Forecast Outlook 2025 to 2035
Mineral Based Transformer Oil Market Size and Share Forecast Outlook 2025 to 2035
Mineral Wool Material Market Size and Share Forecast Outlook 2025 to 2035
Product Life-Cycle Management (PLM) IT Market Size and Share Forecast Outlook 2025 to 2035
Product Analytics Software Market Size and Share Forecast Outlook 2025 to 2035
Products from Food Waste Industry Analysis in Korea Size, Share and Forecast Outlook 2025 to 2035
Products from Food Waste in Japan - Size, Share, and Forecast Outlook 2025 to 2035
Production Logistics Market Size and Share Forecast Outlook 2025 to 2035
Products from Food Waste Market Analysis - Size, Growth, and Forecast 2025 to 2035
Product Design Verification And Validation Solution Market Size and Share Forecast Outlook 2025 to 2035
Mineral Insulated Cables Market Analysis - Size, Share, and Forecast Outlook 2025 to 2035
Mineral Premix Market Analysis - Size, Share, and Forecast Outlook 2025 to 2035
Mineral Yeast Market Analysis by Calcium Yeast, Selenium Yeast, Zinc Yeast, and Other Fortified Yeast Types Through 2035
Production Printer Market - Growth, Demand & Forecast 2025 to 2035
Mineral Wool Market by Type & Application from 2025 to 2035
Key Companies & Market Share in the Mineral Wool Sector

Thank you!
You will receive an email from our Business Development Manager. Please be sure to check your SPAM/JUNK folder too.
Chat With
MaRIA