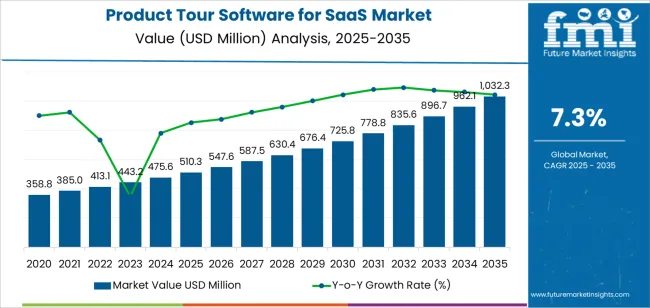
The product tour software for SaaS market expands from USD 510.3 million in 2025 to USD 1,032.4 million by 2035 at a CAGR of 7.3%, with regional adoption shaped by SaaS penetration, digital-experience investments and enterprise onboarding priorities. North America remains the largest contributor, supported by a mature SaaS ecosystem, strong emphasis on customer-success metrics and consistent investment in digital adoption tools across CRM, HR tech, cybersecurity and workflow platforms. Large enterprises dominate deployments as complex user journeys and multi-team workflows require sophisticated onboarding flows, personalization engines and integrated analytics. Europe records steady expansion driven by strong SaaS uptake in Germany, the UK and France, where regulatory expectations and subscription-focused business models reinforce reliance on high-quality onboarding, in-app guidance and retention workflows. European SaaS vendors increasingly use product tour platforms to reduce support costs and raise activation rates, particularly in B2B verticals that require layered feature explanations.
Asia Pacific emerges as the fastest-growing region, led by China at 9.9% CAGR and India at 9.1%, where SaaS startup density continues to surge. Rapid onboarding, multilingual tour capabilities, low-code implementation and AI-driven personalization are priority features for regional vendors aiming to speed product adoption in diverse user environments. Expanding SME software adoption and cloud-native digital transformation initiatives are intensifying demand for scalable, cloud-based tour platforms. Growth in Latin America and the Middle East & Africa is gradual but supported by rising cloud adoption, expanding e-commerce ecosystems and increasing use of customer-success tools among regional SaaS firms aiming to improve retention and reduce onboarding bottlenecks.
The growth in the SaaS market, particularly among small and medium-sized businesses (SMBs) and startups, is contributing to the increasing need for product tour software. As the competition in the SaaS industry intensifies, companies are looking for innovative ways to differentiate themselves, and improving user onboarding is a key strategy. Advancements in artificial intelligence (AI) and machine learning (ML) are enabling more personalized product tours that cater to individual user needs, further driving market growth.
Between 2025 and 2030, the product tour software for SaaS market is projected to grow from USD 510.3 million to approximately USD 690.3 million, adding USD 180 million, which accounts for about 34.5% of the total forecasted growth for the decade. This period will be marked by growing adoption of SaaS platforms across various sectors, increased competition in the SaaS market, and the increasing importance of user onboarding and engagement.
From 2030 to 2035, the market is expected to expand from approximately USD 690.3 million to USD 1,032.4 million, adding USD 342.1 million, which constitutes about 65.5% of the overall growth. This phase will see further advancements in product tour software features, including deeper integrations with AI and ML, which will provide highly personalized and data-driven user experiences, driving further adoption and market growth.
| Metric | Value |
|---|---|
| Market Value (2025) | USD 510.3 million |
| Market Forecast Value (2035) | USD 1,032.4 million |
| Forecast CAGR (2025 to 2035) | 7.3% |
The product tour software for SaaS market is growing as software-as-a-service (SaaS) providers focus on enhancing user onboarding experiences and increasing user engagement. Product tour software allows SaaS companies to create interactive, in-app guides that help new users understand the platform’s features and functionalities, improving user adoption and reducing churn. As more businesses shift to SaaS platforms, the need for effective onboarding tools is driving the growth of this market.
The increasing adoption of SaaS solutions across various industries is a key driver for the market's expansion. As companies adopt more SaaS tools for everything from CRM to project management, providing seamless user onboarding has become essential for maximizing the value of these platforms. Product tour software helps to streamline the learning curve, ensuring that users can quickly grasp the platform's core features and make the most out of the service.
The growing focus on customer experience and the importance of user retention are fueling demand for intuitive and engaging product tours. These tools are particularly valuable in the competitive SaaS market, where keeping users engaged from the outset is crucial for long-term success. As SaaS companies look for ways to improve user activation rates and customer satisfaction, product tour software has become a vital tool for increasing user retention and enhancing the overall user experience.
The market is segmented by type, application, and region. By type, the market is divided into cloud-based and on-premises, with cloud-based leading the market. Based on application, the market is categorized into large enterprises and SMEs, with large enterprises representing the largest segment in terms of market share. Regionally, the market is divided into North America, Europe, Asia Pacific, and other key regions.
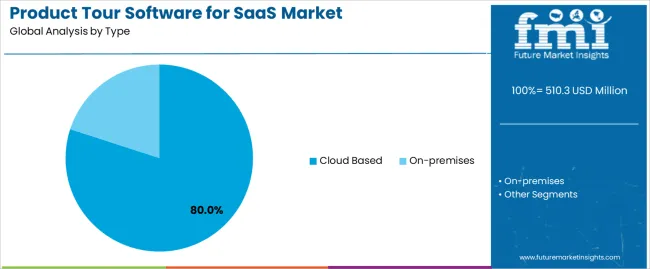
The cloud-based segment leads the product tour software for SaaS market, accounting for 80% of the total market share. This growth is driven by the increasing demand for flexible, scalable, and cost-effective software solutions that cloud-based platforms provide. Cloud-based product tour software offers several advantages, including easy accessibility, real-time updates, and reduced infrastructure costs, which make it highly appealing to SaaS providers.
As businesses continue to embrace cloud technologies, especially with the rise of remote work and global collaboration, the demand for cloud-based solutions that allow SaaS users to create interactive and guided product tours has increased. The ease of integration with other cloud applications and the lower upfront costs associated with cloud-based systems further contribute to their dominance. As the SaaS market continues to expand, cloud-based product tour software will maintain its leadership due to these benefits, catering to businesses of all sizes.
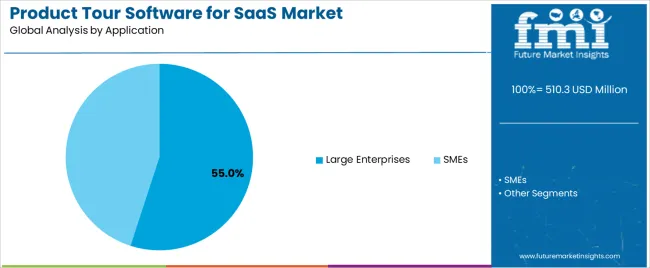
The large enterprises application dominates the product tour software for SaaS market, holding 55% of the total market share. This growth is driven by the increasing need for large organizations to offer seamless user onboarding experiences to their diverse customer base. Large enterprises often require more sophisticated product tour solutions to guide their users through complex software applications, ensuring higher adoption rates and improved user experience.
With the scale and complexity of operations in large enterprises, the demand for robust and scalable product tour software has risen. These organizations prioritize the ability to customize and track user interactions across different teams and regions, making comprehensive and interactive product tours essential. As large enterprises continue to expand their digital services and software offerings, the demand for product tour software to support large-scale onboarding and user engagement will continue to grow, ensuring the continued dominance of this segment in the market.
The product tour software for SaaS market is expanding due to the increasing need for interactive onboarding and user‑engagement tools tailored for subscription‑based software platforms. These tools offer features such as in‑app walkthroughs, personalized tooltips, analytics‑driven tours and A/B testing for user flows. Key drivers include the rapid growth of SaaS applications, heightened focus on user experience (UX) and reducing user churn. Restraints stem from implementation complexity, cost pressures among smaller SaaS vendors, and the risk of user fatigue if tours are poorly designed.
Why is Product Tour Software Gaining Popularity in the SaaS Industry?
Product tour software is gaining popularity in the SaaS industry because it effectively bridges the gap between feature‑rich applications and end‑users needing guidance. With SaaS tools becoming increasingly complex and diversified, user onboarding has become a critical factor in customer retention and satisfaction. These tours help new users navigate core workflows, highlight value‑adding features, and reduce support or training overhead. Their ability to segment users, personalize content and integrate with analytics and product‑usage data makes them especially valuable for SaaS companies focused on growth, retention and product‑led expansion. The shift toward subscription‑economy models further amplifies this trend.
How are Technological Innovations Driving Growth in This Segment?
Technological innovations are driving growth in the product tour software segment by enhancing customization, automation and integration capabilities. Advances include no‑code / low‑code tour‑builders that allow non‑technical teams to create interactive walkthroughs rapidly. Integration of AI and machine learning enables dynamic personalization—adapting tours based on user behaviour and usage patterns. In‑app analytics provide real‑time insight into tour effectiveness, helping SaaS teams optimise flows and improve conversion. Improved compatibility with mobile, web and embedded product environments expands the use‑case. These innovations lower deployment time and increase value for SaaS vendors seeking scalable onboarding tools.
What are the Key Challenges Limiting Adoption of Product Tour Software?
One major barrier is the cost and resource commitment required to implement and maintain high‑quality interactive tours, which can deter smaller or early‑stage SaaS companies. Integration complexity with existing product ecosystems, user‑data flows and analytics platforms can also slow deployment. User fatigue or poor design may lead to decreased engagement, undermining the intended benefits. Fragmentation of device types, user environments and permission levels (particularly in B2B SaaS) introduces complexity for building effective tours. ROI can be harder to quantify if onboarding and churn metrics aren’t clearly linked to tour engagement.

| Country | CAGR (%) |
|---|---|
| China | 9.9% |
| India | 9.1% |
| Germany | 8.4% |
| Brazil | 7.7% |
| USA | 6.9% |
| UK | 6.2% |
| Japan | 5.5% |
The product tour software for SaaS market is growing across key countries, with China leading at a 9.9% CAGR. This growth is driven by the rapid adoption of SaaS solutions and the increasing demand for user onboarding tools that enhance customer experience and engagement. India follows at 9.1%, supported by the country's growing SaaS industry and increasing digital transformation.
Germany is growing at 8.4%, fueled by the demand for advanced onboarding and product tour solutions in its tech-driven business landscape. Brazil shows a 7.7% CAGR, driven by the expanding SaaS market and growing interest in efficient customer engagement tools. The USA, UK, and Japan show moderate growth at 6.9%, 6.2%, and 5.5%, respectively, as SaaS companies continue to prioritize user engagement and onboarding to reduce churn.
China is leading the product tour software for SaaS market with a 9.9% CAGR, driven by the rapid adoption of SaaS solutions and the increasing need for businesses to improve user engagement and onboarding processes. As more Chinese businesses embrace SaaS platforms, the demand for product tour software, which helps users understand and navigate these platforms, continues to grow. The rise in digitalization across various sectors, including education, healthcare, and e-commerce, has spurred the need for intuitive onboarding experiences, making product tour software a valuable tool.
China’s tech ecosystem, which is home to a growing number of SaaS providers, contributes significantly to the market’s expansion. With increasing competition among SaaS companies, providing seamless user experiences and reducing churn have become critical factors, further driving the demand for product tour software. The country's ongoing push for digital transformation and improved customer engagement solutions ensures that China will maintain strong growth in the SaaS onboarding and product tour software market in the years ahead.
India is experiencing strong growth in the product tour software for SaaS market with a 9.1% CAGR. The country’s rapidly expanding SaaS industry, along with a growing base of SaaS startups, is driving the demand for tools that enhance user onboarding and engagement. As more businesses in India transition to SaaS solutions, the need for effective product tours to help users navigate and derive value from these platforms has increased. The growing emphasis on improving customer retention and reducing churn in India's competitive SaaS market further contributes to the demand for product tour software.
India’s rapid digitalization and the rise of cloud-based applications across sectors such as fintech, edtech, and e-commerce have also fueled the growth of this market. The country’s large and diverse customer base, with varying levels of digital literacy, requires tailored onboarding solutions, which product tour software can effectively provide. As SaaS companies in India continue to scale, the market for product tour software is expected to expand steadily, driven by the increasing need for enhanced customer engagement and a seamless user experience.
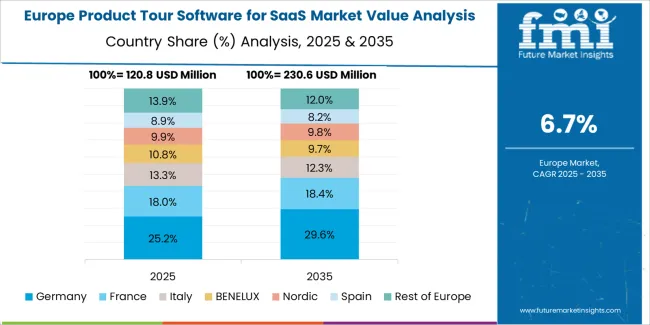
Germany is growing at an 8.4% CAGR in the product tour software for SaaS market, driven by the country's tech-driven business environment and strong focus on customer engagement. German SaaS companies are increasingly adopting product tour software to improve user onboarding, streamline the customer journey, and boost product adoption. The demand for intuitive onboarding solutions that simplify complex SaaS platforms is growing, especially in industries like finance, manufacturing, and automation, where SaaS products often require more detailed user education.
Germany’s commitment to digital transformation and its leadership in the tech industry are key factors driving this growth. With a strong emphasis on customer satisfaction and retention, businesses in Germany are investing in product tour software to enhance their user experiences and reduce churn. As the SaaS market in Germany continues to expand, the demand for advanced onboarding tools will continue to rise, positioning the product tour software market for steady growth.
Brazil is witnessing steady growth in the product tour software for SaaS market, with a 7.7% CAGR. The growing adoption of SaaS platforms across various industries, including finance, e-commerce, and logistics, is contributing to the demand for efficient onboarding solutions. As Brazilian businesses increasingly move to cloud-based solutions, the need to provide users with a clear understanding of how to navigate and use these platforms is becoming more critical. Product tour software offers an effective solution to improve the user experience, reduce churn, and increase product adoption.
The digital transformation of Brazil's small and medium-sized enterprises (SMEs) is another key driver of the market's growth. As more businesses adopt SaaS solutions to improve efficiency and scalability, they are turning to product tour software to enhance customer engagement and retention. With increasing competition among SaaS providers in Brazil, the demand for tools that can offer seamless onboarding and improve user retention will continue to rise, driving steady growth in the product tour software market.
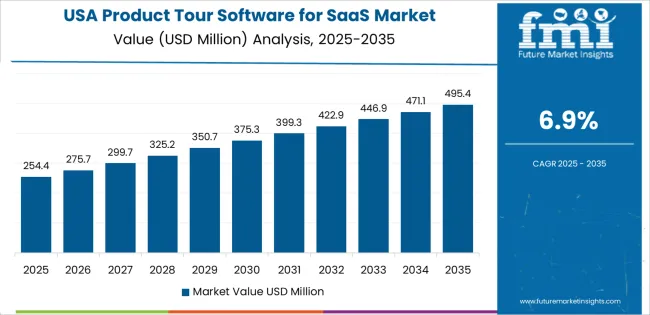
The USA is experiencing steady growth in the product tour software for SaaS market with a 6.9% CAGR. The country is home to many of the world’s leading SaaS companies, and as these company’s scale, the demand for efficient onboarding solutions has grown. Product tour software helps these companies reduce user churn and increase product adoption by providing interactive and engaging tutorials that guide new users through the platform. The growing focus on customer experience and retention is a key driver of this market.
With the increasing competition in the SaaS sector, businesses in the USA are investing in tools that enhance user experience and streamline the onboarding process. As more companies embrace SaaS platforms and transition to subscription-based business models, the need for product tour software to ensure a smooth and engaging customer journey continues to rise. The USA’s strong digital economy and the continued growth of the SaaS industry ensure that the product tour software market will maintain its upward trajectory.
The UK is seeing steady growth in the product tour software for SaaS market, with a 6.2% CAGR. The demand for seamless user experiences and effective onboarding solutions in the UK’s growing SaaS sector is driving market growth. As more UK-based SaaS companies prioritize customer engagement, reducing user churn and improving product adoption rates have become key goals. Product tour software offers a way to achieve these objectives by providing users with guided, interactive tours of the platform, helping them understand its features and maximize its value.
The UK’s focus on customer-centric business models and the increasing emphasis on subscription-based services in the SaaS industry are contributing to the demand for product tour software. As businesses in the UK continue to invest in customer success and improve their user engagement strategies, the market for product tour software will continue to grow. The rise of tech startups and scale-ups in the UK further drives the need for intuitive, effective onboarding tools to support rapid growth and enhance customer satisfaction.

Japan’s product tour software for SaaS market is growing at a steady pace, with a 5.5% CAGR. The country’s increasing adoption of SaaS platforms, especially in industries such as finance, healthcare, and IT, is driving the demand for efficient onboarding tools. As businesses in Japan prioritize customer engagement and retention, product tour software has become a valuable solution for improving user experiences and helping customers quickly understand complex software functionalities.
Japan’s well-established tech infrastructure and the growing interest in cloud-based solutions are contributing to the rise in demand for SaaS onboarding tools. With a focus on improving digital literacy and customer service, Japanese businesses are increasingly adopting product tour software to enhance user interaction and retention. As the SaaS market in Japan continues to evolve, the demand for effective onboarding solutions that drive product adoption will continue to grow, ensuring steady growth in the product tour software market.

The product tour software for SaaS market is expanding rapidly as software companies look for innovative ways to onboard users, enhance customer experience, and drive engagement with their applications. Whatfix leads the market with a 13% share, recognized for its comprehensive in-app guidance, onboarding tools, and self-service support solutions. Whatfix's strong focus on providing customizable, interactive product tours that improve user adoption and retention positions it as a dominant player in the market.
Other key players include Intercom, Chameleon, and Product Fruits, which offer tailored solutions for creating in-app product tours and onboarding experiences. Intercom is a leading customer messaging platform that incorporates product tours to drive user engagement. Chameleon specializes in highly customizable product tours and onboarding flows that cater to both SaaS startups and large enterprises. Product Fruits focuses on creating simple, intuitive in-app guides designed to boost user onboarding and conversion.
Companies like Userpilot, Appcues, and WalkMe are also strong competitors, offering a suite of tools for creating and managing interactive product tours. Userpilot and Appcues offer platforms designed to help SaaS companies create seamless onboarding experiences, while WalkMe provides a comprehensive digital adoption platform, including in-app guidance and workflow automation.
Emerging players such as Helphero, Nickelled, and Upscope provide cost-effective solutions for creating in-app tutorials and walkthroughs, with a focus on user engagement and SaaS growth. Companies like Pendo, Userlane, and Userflow contribute to the market with solutions that emphasize personalized, data-driven user experiences.
| Items | Values |
|---|---|
| Quantitative Units (2025) | USD million |
| Type | Cloud-Based, On-Premises |
| Application | Large Enterprises, SMEs |
| Regions Covered | Asia Pacific, Europe, North America, Latin America, Middle East & Africa |
| Countries Covered | China, Japan, South Korea, India, Australia & New Zealand, ASEAN, Rest of Asia Pacific, Germany, United Kingdom, France, Italy, Spain, Nordic, BENELUX, Rest of Europe, United States, Canada, Mexico, Brazil, Chile, Rest of Latin America, Kingdom of Saudi Arabia, Other GCC Countries, Turkey, South Africa, Other African Union, Rest of Middle East & Africa |
| Key Companies Profiled | Whatfix, Intercom, Chameleon, Product Fruits, Userpilot, Appcues, WalkMe, Helphero, Nickelled, Upscope, UserGuiding, Pendo, Userlane, Userflow, Apty, Usetiful, Teamwork, Egnyte, Rocketspark, Freshchat, LiveChat, Hopscotch, BigCommerce, Eyelet, Marketo, Stonly, Dynatrace, PageUp, Valtix, Sopro, Tricentis, Kaon |
| Additional Attributes | Dollar sales by type and application categories, market growth trends, market adoption by classification and application segments, regional adoption trends, competitive landscape, advancements in product tour software for SaaS technologies, integration with SaaS platforms and user engagement strategies. |
The global product tour software for saas market is estimated to be valued at USD 510.3 million in 2025.
The market size for the product tour software for saas market is projected to reach USD 1,032.3 million by 2035.
The product tour software for saas market is expected to grow at a 7.3% CAGR between 2025 and 2035.
The key product types in product tour software for saas market are cloud based and on-premises.
In terms of application, large enterprises segment to command 55.0% share in the product tour software for saas market in 2025.


Our Research Products

The "Full Research Suite" delivers actionable market intel, deep dives on markets or technologies, so clients act faster, cut risk, and unlock growth.

The Leaderboard benchmarks and ranks top vendors, classifying them as Established Leaders, Leading Challengers, or Disruptors & Challengers.

Locates where complements amplify value and substitutes erode it, forecasting net impact by horizon

We deliver granular, decision-grade intel: market sizing, 5-year forecasts, pricing, adoption, usage, revenue, and operational KPIs—plus competitor tracking, regulation, and value chains—across 60 countries broadly.

Spot the shifts before they hit your P&L. We track inflection points, adoption curves, pricing moves, and ecosystem plays to show where demand is heading, why it is changing, and what to do next across high-growth markets and disruptive tech

Real-time reads of user behavior. We track shifting priorities, perceptions of today’s and next-gen services, and provider experience, then pace how fast tech moves from trial to adoption, blending buyer, consumer, and channel inputs with social signals (#WhySwitch, #UX).

Partner with our analyst team to build a custom report designed around your business priorities. From analysing market trends to assessing competitors or crafting bespoke datasets, we tailor insights to your needs.
Supplier Intelligence
Discovery & Profiling
Capacity & Footprint
Performance & Risk
Compliance & Governance
Commercial Readiness
Who Supplies Whom
Scorecards & Shortlists
Playbooks & Docs
Category Intelligence
Definition & Scope
Demand & Use Cases
Cost Drivers
Market Structure
Supply Chain Map
Trade & Policy
Operating Norms
Deliverables
Buyer Intelligence
Account Basics
Spend & Scope
Procurement Model
Vendor Requirements
Terms & Policies
Entry Strategy
Pain Points & Triggers
Outputs
Pricing Analysis
Benchmarks
Trends
Should-Cost
Indexation
Landed Cost
Commercial Terms
Deliverables
Brand Analysis
Positioning & Value Prop
Share & Presence
Customer Evidence
Go-to-Market
Digital & Reputation
Compliance & Trust
KPIs & Gaps
Outputs
Full Research Suite comprises of:
Market outlook & trends analysis
Interviews & case studies
Strategic recommendations
Vendor profiles & capabilities analysis
5-year forecasts
8 regions and 60+ country-level data splits
Market segment data splits
12 months of continuous data updates
DELIVERED AS:
PDF EXCEL ONLINE
Product Life-Cycle Management (PLM) IT Market Size and Share Forecast Outlook 2025 to 2035
Products from Food Waste Industry Analysis in Korea Size, Share and Forecast Outlook 2025 to 2035
Products from Food Waste in Japan - Size, Share, and Forecast Outlook 2025 to 2035
Production Logistics Market Size and Share Forecast Outlook 2025 to 2035
Products from Food Waste Market Analysis - Size, Growth, and Forecast 2025 to 2035
Product Design Verification And Validation Solution Market Size and Share Forecast Outlook 2025 to 2035
Production Printer Market - Growth, Demand & Forecast 2025 to 2035
Product Dispensing Machinery Market
Product Cost Management Market
Product Information Management Market Growth – Trends & Forecast 2024-2034
Product Analytics Software Market Size and Share Forecast Outlook 2025 to 2035
CBD Product Packaging Market Size and Share Forecast Outlook 2025 to 2035
USA Products from Food Waste Market Growth – Trends, Demand & Outlook 2025-2035
Competitive Overview of CBD Product Packaging Market Share
Soda Production Machine Market Size and Share Forecast Outlook 2025 to 2035
Competitive Overview of Date Product Market Share
Teff Products Market
Dairy Product Packaging Market Size and Share Forecast Outlook 2025 to 2035
Glass Product Market Size and Share Forecast Outlook 2025 to 2035
Early Production Facility Market Size and Share Forecast Outlook 2025 to 2035

Thank you!
You will receive an email from our Business Development Manager. Please be sure to check your SPAM/JUNK folder too.
Chat With
MaRIA